Framework Template
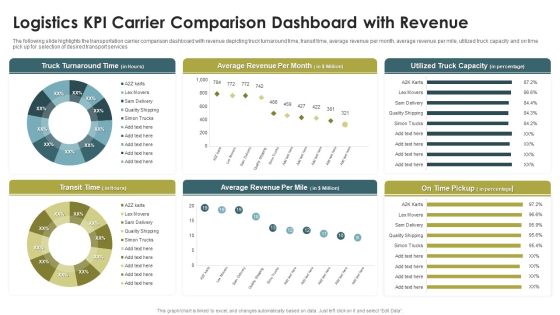
Logistics KPI Carrier Comparison Dashboard With Revenue Ppt Infographics Portfolio PDF
The following slide highlights the transportation carrier comparison dashboard with revenue depicting truck turnaround time, transit time, average revenue per month, average revenue per mile, utilized truck capacity and on time pick up for selection of desired transport services. Pitch your topic with ease and precision using this Logistics KPI Carrier Comparison Dashboard With Revenue Ppt Infographics Portfolio PDF. This layout presents information on Truck Turnaround Time, Average Revenue, Per Month, Transit Time. It is also available for immediate download and adjustment. So, changes can be made in the color, design, graphics or any other component to create a unique layout.

Four Categories Of Production In Manufacturing Plant Ppt Summary Show PDF
The following slide highlights the four categories of production in manufacturing plant illustrating key types which are unit production, batch production mass production and continuous production. Pitch your topic with ease and precision using this Four Categories Of Production In Manufacturing Plant Ppt Summary Show PDF. This layout presents information on Unit Production, Mass Production, Continuous Production, Batch Production. It is also available for immediate download and adjustment. So, changes can be made in the color, design, graphics or any other component to create a unique layout.
Market Insights Research Results With KPI Dashboard Ppt PowerPoint Presentation Icon File Formats PDF
The given below slide highlights the KPAs of market research associated with customer satisfaction. It includes net promoter score, customer effort score, monthly NPS and CES trend etc.Pitch your topic with ease and precision using this Market Insights Research Results With KPI Dashboard Ppt PowerPoint Presentation Icon File Formats PDF. This layout presents information on Satisfaction Score, Customer Effort, Customer Score. It is also available for immediate download and adjustment. So, changes can be made in the color, design, graphics or any other component to create a unique layout.

Customers Declining Graph In Offline Store Ppt PowerPoint Presentation Professional Clipart PDF
This slide contains the information related to the number of numbers that are shifting form in-store purchasing to online shopping because of some factors. Pitch your topic with ease and precision using this Customers Declining Graph In Offline Store Ppt PowerPoint Presentation Professional Clipart PDF. This layout presents information on Customers Choosing, Store Purchase, Time Saving. It is also available for immediate download and adjustment. So, changes can be made in the color, design, graphics or any other component to create a unique layout.
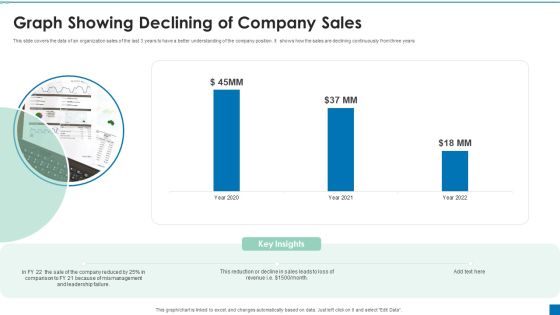
Graph Showing Declining Of Company Sales Ppt PowerPoint Presentation Portfolio Graphics Example PDF
This slide covers the data of an organization sales of the last 3 years to have a better understanding of the company position. It shows how the sales are declining continuously from three years.Pitch your topic with ease and precision using this Graph Showing Declining Of Company Sales Ppt PowerPoint Presentation Portfolio Graphics Example PDF. This layout presents information on Reduction Decline, Comparison, Mismanagement. It is also available for immediate download and adjustment. So, changes can be made in the color, design, graphics or any other component to create a unique layout.

Organic Page Reach Declining Graph With Stock Prices Ppt PowerPoint Presentation Ideas Styles PDF
This slide covers the information related to the share price and organic page reach of an organization to check the position of its working and to have records of them.Pitch your topic with ease and precision using this Organic Page Reach Declining Graph With Stock Prices Ppt PowerPoint Presentation Ideas Styles PDF. This layout presents information on Increasing High, Reach Declining, Supply Market. It is also available for immediate download and adjustment. So, changes can be made in the color, design, graphics or any other component to create a unique layout.

Technology Companies Market Cap Declining Graph Ppt PowerPoint Presentation File Smartart PDF
This slide shows the multiple companies capital that is invested by them in the market for making profits and advancing the technologies. It shows the decline of their capital amount in the following month. Pitch your topic with ease and precision using this Technology Companies Market Cap Declining Graph Ppt PowerPoint Presentation File Smartart PDF. This layout presents information on Overall Decline, Companies Low, Incurred Mor. It is also available for immediate download and adjustment. So, changes can be made in the color, design, graphics or any other component to create a unique layout.

Customized Vs Mass Marketing Comparison With Line Chart Ppt PowerPoint Presentation File Ideas PDF
This slide signifies the customized vs mass marketing with line chart. It includes comparison based on strategies that are being implemented for growth in customer engagement. Pitch your topic with ease and precision using this Customized Vs Mass Marketing Comparison With Line Chart Ppt PowerPoint Presentation File Ideas PDF. This layout presents information on Customized Marketing, Mass Marketing, 2016 To 2022. It is also available for immediate download and adjustment. So, changes can be made in the color, design, graphics or any other component to create a unique layout.

Cost Scrum Kpis Chart And Key Statistics Ppt Layouts Example Introduction PDF
This slide illustrates graphical representation of cost scrum metrics. It provides Projected Hours per story and actual hours per story point and other key statistics. Pitch your topic with ease and precision using this Cost Scrum Kpis Chart And Key Statistics Ppt Layouts Example Introduction PDF. This layout presents information on Projected Hours, Cost Per Story, Metrics, Actual Cost. It is also available for immediate download and adjustment. So, changes can be made in the color, design, graphics or any other component to create a unique layout.

Product Launch Time Relationship With Cost And Revenue Ppt Graphics PDF
The following slide highlights the time to market relationship with cost and revenue illustrating graphical representation of shorter time to market and longer time to market impact on cost, revenue and market establishment. Pitch your topic with ease and precision using this Product Launch Time Relationship With Cost And Revenue Ppt Graphics PDF. This layout presents information on Product Launch, Market Cost, Establish Market. It is also available for immediate download and adjustment. So, changes can be made in the color, design, graphics or any other component to create a unique layout.

Strategic Drivers For Project With Levels Of Reliability Ppt PowerPoint Presentation File Slideshow PDF
This slide exhibits the project drivers for hand hygiene compliance with short and global aim. It also provides information about the different levels of reliability for each driver. Pitch your topic with ease and precision using this Strategic Drivers For Project With Levels Of Reliability Ppt PowerPoint Presentation File Slideshow PDF. This layout presents information on Smart Aim, Global Aim, Key Drivers. It is also available for immediate download and adjustment. So, changes can be made in the color, design, graphics or any other component to create a unique layout.

Monthly Due Diligence Roadmap For M And A Ppt Pictures Guidelines PDF
The following slide showcases the due diligence schedule for merger or acquisition illustrating process preparation, marketing and pre-liminary non-binding bids and final bids. Pitch your topic with ease and precision using this Monthly Due Diligence Roadmap For M And A Ppt Pictures Guidelines PDF. This layout presents information on Process Preparation, Due Diligence, Conduct Management Meetings. It is also available for immediate download and adjustment. So, changes can be made in the color, design, graphics or any other component to create a unique layout.

Net Cash Flow To Measure Monetary Financial Study Ppt Layouts Clipart Images PDF
This slide shows net cash flow measurement of financial feasibility to assess the practicality of project. It includes factors such as amount and cumulative net cash flow. Pitch your topic with ease and precision using this Net Cash Flow To Measure Monetary Financial Study Ppt Layouts Clipart Images PDF. This layout presents information on Cash Flow, Profit Generation, Quick Payment Terms. It is also available for immediate download and adjustment. So, changes can be made in the color, design, graphics or any other component to create a unique layout.

Budget Vs Actual Cost Comparison Dashboard Ppt PowerPoint Presentation Professional Format Ideas PDF
This slide illustrates fact and figures relating to various project budgets of a company. It includes monthly budget graph, project budget meter and budget vs. Actual costs chart.Pitch your topic with ease and precision using this Budget Vs Actual Cost Comparison Dashboard Ppt PowerPoint Presentation Professional Format Ideas PDF. This layout presents information on Milestones, Budget Graph, Manager. It is also available for immediate download and adjustment. So, changes can be made in the color, design, graphics or any other component to create a unique layout.

Major Challenges Faced By Food And Beverage Sectors Ppt Gallery Influencers PDF
This slide covers three major challenges faced by manufacturers in food and beverage industry. It involves challenges such as cost pressures, ensuring superior customer service levels and tracking requirements. Pitch your topic with ease and precision using this Major Challenges Faced By Food And Beverage Sectors Ppt Gallery Influencers PDF. This layout presents information on Cost Pressures, Ensuring Superior, Tracking Requirements, Customer Service Levels. It is also available for immediate download and adjustment. So, changes can be made in the color, design, graphics or any other component to create a unique layout.

Corporate Governance In Line With Impact Assessment Dashboard Ppt File Backgrounds PDF
This slide shows a dashboard incorporating statistics of impacts on environment, employees and society at large due to the operations of a business undertaking. Herein, corporate governance plays a role in reducing the damage done to the environment by the firms operations. Pitch your topic with ease and precision using this Corporate Governance In Line With Impact Assessment Dashboard Ppt File Backgrounds PDF. This layout presents information on Financials, Profit, ABC Organization. It is also available for immediate download and adjustment. So, changes can be made in the color, design, graphics or any other component to create a unique layout.

Kpi Dashboard To Track Video Promotion Techniques Ppt Summary Guide PDF
This slide signifies the key performance indicator dashboard to measure video promotion techniques. It covers information regarding to the page visit, post reach, summary, click action on page. Pitch your topic with ease and precision using this Kpi Dashboard To Track Video Promotion Techniques Ppt Summary Guide PDF. This layout presents information on Page Visit, Page Summary, Post Overview. It is also available for immediate download and adjustment. So, changes can be made in the color, design, graphics or any other component to create a unique layout.

Video Promotion Techniques To Enhance Customer Engagement Rate Ppt Portfolio Images PDF
This slide signifies the key statistics on video promotion techniques to increase customer engagement rate. It covers information regarding to Twitter, Facebook, YouTube, Instagram and Snapchat. Pitch your topic with ease and precision using this Video Promotion Techniques To Enhance Customer Engagement Rate Ppt Portfolio Images PDF. This layout presents information on Facebook, Snapchat, Instagram, YouTube. It is also available for immediate download and adjustment. So, changes can be made in the color, design, graphics or any other component to create a unique layout.
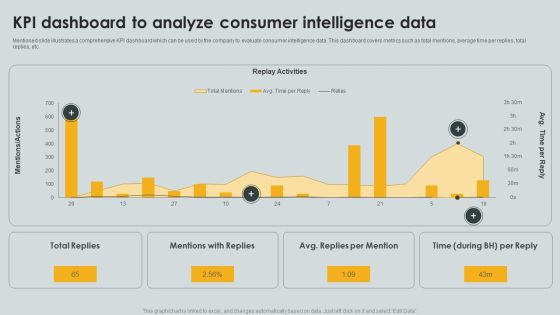
KPI Dashboard To Analyze Consumer Intelligence Data Ppt PowerPoint Presentation File Portfolio PDF
Mentioned slide illustrates a comprehensive KPI dashboard which can be used by the company to evaluate consumer intelligence data. This dashboard covers metrics such as total mentions, average time per replies, total replies, etc. Pitch your topic with ease and precision using this KPI Dashboard To Analyze Consumer Intelligence Data Ppt PowerPoint Presentation File Portfolio PDF. This layout presents information on Replay Activities, Total Replies, Mentions Replies. It is also available for immediate download and adjustment. So, changes can be made in the color, design, graphics or any other component to create a unique layout.

Ways To Reduce Environmental Impact Of Common Data Storage Ppt Show Ideas PDF
The following slide showcases approaches to be combined with other solutions to minimize the environmental impact of data storage. The approaches covered are using data storage technologies, reduce data quantity and data centre decommissioning. Pitch your topic with ease and precision using this Ways To Reduce Environmental Impact Of Common Data Storage Ppt Show Ideas PDF. This layout presents information on Reduce Data Quantity, Data Centre Decommissioning, Data Centre Decommissioning. It is also available for immediate download and adjustment. So, changes can be made in the color, design, graphics or any other component to create a unique layout.

Customer Behavior Analytics Dashboard To Improve Satisfaction Ppt File Infographics PDF
The following slide provides an insight of websites performance that includes date parameters. The dashboard includes sessions, users, pageviews, bounce rate and percentage of new sessions. Pitch your topic with ease and precision using this Customer Behavior Analytics Dashboard To Improve Satisfaction Ppt File Infographics PDF. This layout presents information on Session, Avg Session Duration, Bounce Rate. It is also available for immediate download and adjustment. So, changes can be made in the color, design, graphics or any other component to create a unique layout.
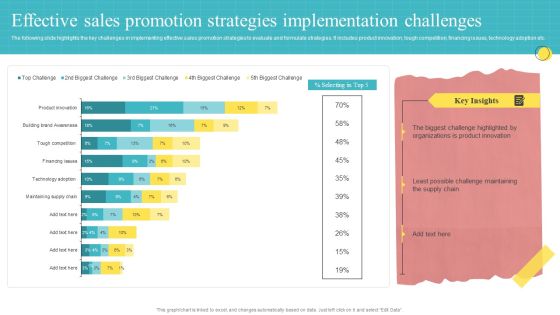
Effective Sales Promotion Strategies Implementation Challenges Ppt PowerPoint Presentation Ideas Graphics Tutorials PDF
The following slide highlights the key challenges in implementing effective sales promotion strategies to evaluate and formulate strategies. It includes product innovation, tough competition, financing issues, technology adoption etc. Pitch your topic with ease and precision using this Effective Sales Promotion Strategies Implementation Challenges Ppt PowerPoint Presentation Ideas Graphics Tutorials PDF. This layout presents information on Biggest Challenge, Product Innovation, Challenge Maintaining. It is also available for immediate download and adjustment. So, changes can be made in the color, design, graphics or any other component to create a unique layout.

Phases And Actions Of IT Risk Control Strategies Risk Management Ppt Show Vector PDF
This slide shows the five different phases and actions of information technology risk management which includes defining risk philosophy, understanding critical risks, quantify the cost of risk, optimize risk financing and reducing retained risk for controlling risks and threats. Pitch your topic with ease and precision using this Phases And Actions Of IT Risk Control Strategies Risk Management Ppt Show Vector PDF. This layout presents information on Define Risk Philosophy, Understand Critical Risks, Quantify Cost Risk. It is also available for immediate download and adjustment. So, changes can be made in the color, design, graphics or any other component to create a unique layout.

Annual Staff Productivity Enhancement Graph Ppt PowerPoint Presentation Styles Aids PDF
This slide can be used to show improvement in employee productivity over past four years. The main reason for productivity improvement is the managerial and organizational support provided to employees. Pitch your topic with ease and precision using this Annual Staff Productivity Enhancement Graph Ppt PowerPoint Presentation Styles Aids PDF. This layout presents information on Employee Productivity, Improved Last, Due Continuous. It is also available for immediate download and adjustment. So, changes can be made in the color, design, graphics or any other component to create a unique layout.

Production Strategic Tools Used By Organizations For 5S Lean Ppt Infographics Microsoft PDF
This slide defines the 5s lean strategic tools used by the organization. It includes information related dashboards, trend charts and checklist used to analyze the working conditions of an industry. Pitch your topic with ease and precision using this Production Strategic Tools Used By Organizations For 5S Lean Ppt Infographics Microsoft PDF. This layout presents information on Procedure, Checklist, Standardize. It is also available for immediate download and adjustment. So, changes can be made in the color, design, graphics or any other component to create a unique layout.

Customer Client Referral Program Performance Dashboard Ppt File Visual Aids PDF
This slide covers customer referral program performance evaluating dashboard. It involves participation rate by referrals, number of referred customers, conversion rate and total revenue generated. Pitch your topic with ease and precision using this Customer Client Referral Program Performance Dashboard Ppt File Visual Aids PDF. This layout presents information on Participation Rate Referrals, Number Referred Customers, Referral Conversion Rate. It is also available for immediate download and adjustment. So, changes can be made in the color, design, graphics or any other component to create a unique layout.

Comparative Assessment Of Block Chain Enabled Altcoins Vs Fiat Currencies Ppt Infographics Icons PDF
This slide covers difference between crypto and fiat currencies as medium of exchanges. It includes comparison based on intermediary requirements, block chain enablement, control, circulation, etc. Pitch your topic with ease and precision using this Comparative Assessment Of Block Chain Enabled Altcoins Vs Fiat Currencies Ppt Infographics Icons PDF. This layout presents information on Cryptocurrencies, Fiat Currencies, Decentralized Control. It is also available for immediate download and adjustment. So, changes can be made in the color, design, graphics or any other component to create a unique layout.

Employee Risk Key Performance Indicator Dashboard With Case Incident Rate Ppt Professional Information PDF
The following slide highlights the employee safety key performance indicator dashboard with case incident rate illustrating total case occurrence rate, last reported case, days without reported, causing items, corrective actions, incident pyramid, incident by month and major causes. Pitch your topic with ease and precision using this Employee Risk Key Performance Indicator Dashboard With Case Incident Rate Ppt Professional Information PDF. This layout presents information on Total Case, Incident Rate, Last Incident Reported, Incident Causing Items. It is also available for immediate download and adjustment. So, changes can be made in the color, design, graphics or any other component to create a unique layout.
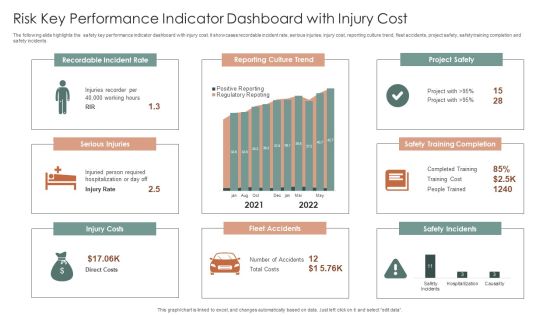
Risk Key Performance Indicator Dashboard With Injury Cost Ppt Summary Brochure PDF
The following slide highlights the safety key performance indicator dashboard with injury cost. It showcases recordable incident rate, serious injuries, injury cost, reporting culture trend, fleet accidents, project safety, safety training completion and safety incidents. Pitch your topic with ease and precision using this Risk Key Performance Indicator Dashboard With Injury Cost Ppt Summary Brochure PDF. This layout presents information on Recordable Incident Rate, Reporting Culture Trend, Project Safety. It is also available for immediate download and adjustment. So, changes can be made in the color, design, graphics or any other component to create a unique layout.

Healthcare Devices Development Process Risks With Solutions Ppt Summary Pictures PDF
This slide shows the threats and solutions in medical device development process to make developers aware of risks. It includes risk response, types of risks, risk mitigation strategies , and residual risks. Pitch your topic with ease and precision using this Healthcare Devices Development Process Risks With Solutions Ppt Summary Pictures PDF. This layout presents information on Critical Risk, Moderate Risks, Low Level Risks. It is also available for immediate download and adjustment. So, changes can be made in the color, design, graphics or any other component to create a unique layout.

3 Vendor Comparison Based On Survey Results Ppt Ideas Graphic Tips PDF
The following slide showcases rank of supplier comparison on the basis of responses obtained from customers. The comparison parameters covered are responsiveness, customer service and focus, reputation, knowledge, on time delivery, service and product quality. Pitch your topic with ease and precision using this 3 Vendor Comparison Based On Survey Results Ppt Ideas Graphic Tips PDF. This layout presents information on Survey Results, Key Insights, Parameters. It is also available for immediate download and adjustment. So, changes can be made in the color, design, graphics or any other component to create a unique layout.
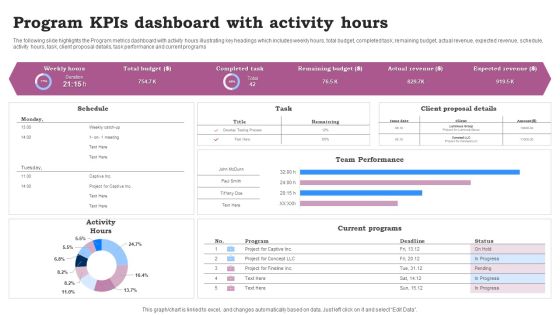
Program Kpis Dashboard With Activity Hours Ppt Infographics Clipart Images PDF
The following slide highlights the Program metrics dashboard with activity hours illustrating key headings which includes weekly hours, total budget, completed task, remaining budget, actual revenue, expected revenue, schedule, activity hours, task, client proposal details, task performance and current programs. Pitch your topic with ease and precision using this Program Kpis Dashboard With Activity Hours Ppt Infographics Clipart Images PDF. This layout presents information on Team Performance, Current Programs, Activity Hours. It is also available for immediate download and adjustment. So, changes can be made in the color, design, graphics or any other component to create a unique layout.
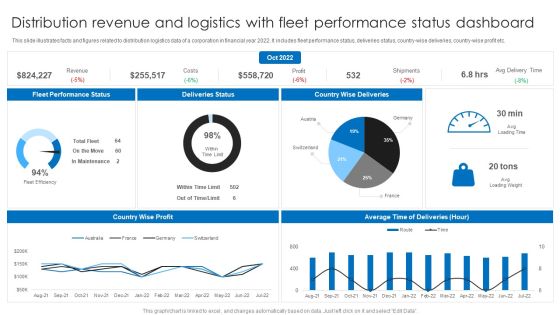
Distribution Revenue And Logistics With Fleet Performance Status Dashboard Ppt Layouts Background PDF
This slide illustrates facts and figures related to distribution logistics data of a corporation in financial year 2022. It includes fleet performance status, deliveries status, country-wise deliveries, country-wise profit etc. Pitch your topic with ease and precision using this Distribution Revenue And Logistics With Fleet Performance Status Dashboard Ppt Layouts Background PDF. This layout presents information on Deliveries Status, Country Wise Deliveries, Fleet Performance Status. It is also available for immediate download and adjustment. So, changes can be made in the color, design, graphics or any other component to create a unique layout.

Retail Store Data Map Dashboard Ppt PowerPoint Presentation Gallery Display PDF
This slide shows retail store data inventory dashboard. It provides information such as units sold, on hand, stock availability, top selling items, average inventory value by product category, etc. Pitch your topic with ease and precision using this Retail Store Data Map Dashboard Ppt PowerPoint Presentation Gallery Display PDF. This layout presents information on Inventory Turn, Over Ratio, Gross Margin ROI. It is also available for immediate download and adjustment. So, changes can be made in the color, design, graphics or any other component to create a unique layout.

Managing Cyber Security Incident Response KPI Dashboard Ppt Layouts Shapes PDF
This slide covers cyber security incident response KPI dashboard. It involves details such as intent alarm, event trend sources, event trend, sensor activity, major operating systems and asset information. Pitch your topic with ease and precision using this Managing Cyber Security Incident Response KPI Dashboard Ppt Layouts Shapes PDF. This layout presents information on Top Alarms Method, Alarms Intent, Timely Event Trend. It is also available for immediate download and adjustment. So, changes can be made in the color, design, graphics or any other component to create a unique layout.

Statistics Depicting Risk Magnitude In Business Threats Landscape Ppt File Example Introduction PDF
This slide illustrates statistics which highlight magnitude of threats faced by various business units in a risk landscape. It entails information about cybersecurity, data privacy, digital innovation, cloud computing, transformational projects, mergers and acquisition and regulatory environment. Pitch your topic with ease and precision using this Statistics Depicting Risk Magnitude In Business Threats Landscape Ppt File Example Introduction PDF. This layout presents information on Business Units, Risk Magnitude, Business Landscape. It is also available for immediate download and adjustment. So, changes can be made in the color, design, graphics or any other component to create a unique layout.

Change Order Administration Dashboard With Priority Assessment Ppt Portfolio Inspiration PDF
This slide showcases change order management dashboard with priority assessment. It provides information about order stats, summary, latest change orders and priority according to rank. Pitch your topic with ease and precision using this Change Order Administration Dashboard With Priority Assessment Ppt Portfolio Inspiration PDF. This layout presents information on Change Orders Priority, Change Order Stats, Change Orders Summary. It is also available for immediate download and adjustment. So, changes can be made in the color, design, graphics or any other component to create a unique layout.
Revenue Chart Of Abc Bank Across Global Market Ppt Icon Images PDF
This slide illustrates information about revenue generated by ABC bank in last eight years across global market. Continuous digitalization is the main contributing factor for the same. Pitch your topic with ease and precision using this Revenue Chart Of Abc Bank Across Global Market Ppt Icon Images PDF. This layout presents information on Continuous Digitalization, 2016 To 2023, Revenue. It is also available for immediate download and adjustment. So, changes can be made in the color, design, graphics or any other component to create a unique layout.

E Commerce Business Sales Monthly Forecast Graph Ppt Infographics Show PDF
This slide shows the table and graph representing monthly sales forecast of an e-commerce business. It shows details related to the expected growth rate, historical data, projected data and actual growth of sales. Pitch your topic with ease and precision using this E Commerce Business Sales Monthly Forecast Graph Ppt Infographics Show PDF. This layout presents information on Expected Growth Rate, Historical, Actual Growth Rate. It is also available for immediate download and adjustment. So, changes can be made in the color, design, graphics or any other component to create a unique layout.

Program Management Report With Activity And Tasks Dashboard Ppt File Objects PDF
This slide covers the programme status of the project with the activities and completion percentage of the same. It also shows the outstanding tasks and the monthly status with various graphs. Pitch your topic with ease and precision using this Program Management Report With Activity And Tasks Dashboard Ppt File Objects PDF. This layout presents information on Activity, Team Management, Time Tracking. It is also available for immediate download and adjustment. So, changes can be made in the color, design, graphics or any other component to create a unique layout.

Attain Production Goals And Objectives KPI Metrices Ppt Summary Format Ideas PDF
This slide covers dashboard for comparing targets with actual units produced. It includes metrics such as production volume, quality, performance, production time, scheduled time, operating time, revenue, etc. Pitch your topic with ease and precision using this Attain Production Goals And Objectives KPI Metrices Ppt Summary Format Ideas PDF. This layout presents information on Production, Cost, Revenue, Performance. It is also available for immediate download and adjustment. So, changes can be made in the color, design, graphics or any other component to create a unique layout.

Customer NPS Metric Dashboard For Call Centers Ppt Inspiration Smartart PDF
This slide shows net promoter score dashboard for call centers which contains occupancy rate, tickets unassigned, opened tickets, completed tickets and raised tickets. It also has details on resolution rate on first call, enquiries, etc. Pitch your topic with ease and precision using this Customer NPS Metric Dashboard For Call Centers Ppt Inspiration Smartart PDF. This layout presents information on Occupancy Rate, Resolution Rate, Net Promoter Score. It is also available for immediate download and adjustment. So, changes can be made in the color, design, graphics or any other component to create a unique layout.

Customer NPS Metric Statistics Of Banking Industry Ppt Styles Microsoft PDF
This slide illustrates statistics of net promoter score NPS in banking industry. It provides information about summary, personal banking, business banking and wealth management. Pitch your topic with ease and precision using this Customer NPS Metric Statistics Of Banking Industry Ppt Styles Microsoft PDF. This layout presents information on Summary, Personal Banking, Business Banking, Wealth Management. It is also available for immediate download and adjustment. So, changes can be made in the color, design, graphics or any other component to create a unique layout.
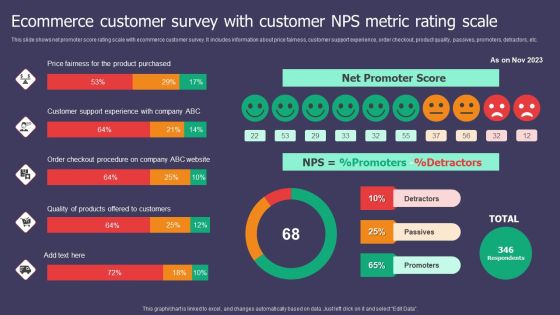
Ecommerce Customer Survey With Customer NPS Metric Rating Scale Ppt Inspiration Visual Aids PDF
This slide shows net promoter score rating scale with ecommerce customer survey. It includes information about price fairness, customer support experience, order checkout, product quality, passives, promoters, detractors, etc. Pitch your topic with ease and precision using this Ecommerce Customer Survey With Customer NPS Metric Rating Scale Ppt Inspiration Visual Aids PDF. This layout presents information on Net Promoter Score, Price Fairness, Product Purchased. It is also available for immediate download and adjustment. So, changes can be made in the color, design, graphics or any other component to create a unique layout.

Budget And Time Forecast Dashboard For Project Management Ppt Pictures Format Ideas PDF
This slide represents the dashboard for cost and time estimation of the organizational product which gives a clear view of the health, time, tasks, cost, progress rate and completion of project status to help the management to effectively estimate its success or failure and make changes accordingly. Pitch your topic with ease and precision using this Budget And Time Forecast Dashboard For Project Management Ppt Pictures Format Ideas PDF. This layout presents information on Health, Progress, Cost, Workload. It is also available for immediate download and adjustment. So, changes can be made in the color, design, graphics or any other component to create a unique layout.

Sales Performance Monitoring Dashboard With Customer Details Ppt Infographics Themes PDF
This slide illustrates sales performance tracking dashboard with critical information. It provides information about customer details, invoice, earnings, leads, pending delivery, revenue, etc. Pitch your topic with ease and precision using this Sales Performance Monitoring Dashboard With Customer Details Ppt Infographics Themes PDF. This layout presents information on Todays Revenue, Today Delivered, Pending Delivery, Total Leads. It is also available for immediate download and adjustment. So, changes can be made in the color, design, graphics or any other component to create a unique layout.
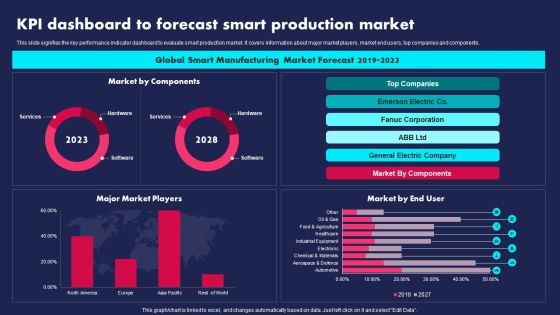
KPI Dashboard To Forecast Smart Production Market Ppt PowerPoint Presentation Gallery Visual Aids PDF
This slide signifies the key performance indicator dashboard to evaluate smart production market. It covers information about major market players, market end users, top companies and components. Pitch your topic with ease and precision using this KPI Dashboard To Forecast Smart Production Market Ppt PowerPoint Presentation Gallery Visual Aids PDF. This layout presents information on Global Smart Manufacturing, Market Forecast, 2019 To 2023. It is also available for immediate download and adjustment. So, changes can be made in the color, design, graphics or any other component to create a unique layout.

VR Technology In Banking And Financial Sector Ppt Ideas Gallery PDF
The following slide demonstrates VR technology in banking and financial sector to develop immersive virtual payment experience and create visually appealing user interface for virtual banks. It includes components such as payments, virtual trading, bank branches and benefits of virtual reality. Pitch your topic with ease and precision using this VR Technology In Banking And Financial Sector Ppt Ideas Gallery PDF. This layout presents information on Payments, Virtual Trading, Bank Branches. It is also available for immediate download and adjustment. So, changes can be made in the color, design, graphics or any other component to create a unique layout.

Business Unit Valuation And Development Dashboard Ppt Professional Graphic Tips PDF
This slide shows key performance indicators dashboard which represents number of assets along with their stages of development. It also includes estimated development cost and production index comparison. Pitch your topic with ease and precision using this Business Unit Valuation And Development Dashboard Ppt Professional Graphic Tips PDF. This layout presents information on Estimated Development Cost, Production Index, Development Stage. It is also available for immediate download and adjustment. So, changes can be made in the color, design, graphics or any other component to create a unique layout.

Brand Equity Valuation Of Top 10 IT Companies Ppt Portfolio Rules PDF
This slide showcase top 10 information technology companies brand value comparison chart understanding their position in market. It includes elements such as companies name, brand value, and key insights. Pitch your topic with ease and precision using this Brand Equity Valuation Of Top 10 IT Companies Ppt Portfolio Rules PDF. This layout presents information on Highest Market Value, Total Value, Brand Valuation. It is also available for immediate download and adjustment. So, changes can be made in the color, design, graphics or any other component to create a unique layout.
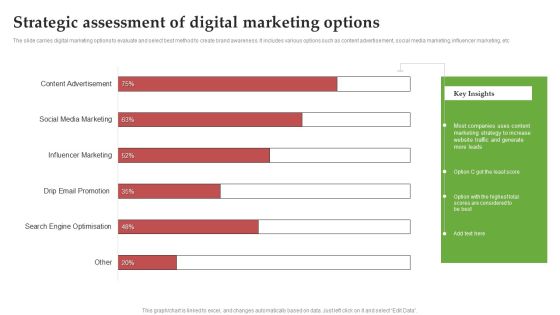
Strategic Assessment Of Digital Marketing Options Ppt PowerPoint Presentation File Show PDF
The slide carries digital marketing options to evaluate and select best method to create brand awareness. It includes various options such as content advertisement, social media marketing, influencer marketing, etc. Pitch your topic with ease and precision using this Strategic Assessment Of Digital Marketing Options Ppt PowerPoint Presentation File Show PDF. This layout presents information on Influencer Marketing, Social Media Marketing, Content Advertisement. It is also available for immediate download and adjustment. So, changes can be made in the color, design, graphics or any other component to create a unique layout.

ESO System Incident Management KPI Dashboard Ppt PowerPoint Presentation File Graphic Images PDF
This slide covers enterprise security operation incident management kpi dashboard. It involves details such as average resolution time, new incidents, incident status and new incidents by category. Pitch your topic with ease and precision using this ESO System Incident Management KPI Dashboard Ppt PowerPoint Presentation File Graphic Images PDF. This layout presents information on Average Resolution Time, Incident Status, New Incidents. It is also available for immediate download and adjustment. So, changes can be made in the color, design, graphics or any other component to create a unique layout.
Issues Tracking Dashboard For Organizational Building Management Ppt Infographics Topics PDF
This slide showcases dashboard which can help organization to keep track of issues plus faults during facility management and rectify them within stipulated time. Its key elements are issues reported, fault tracking, etc. Pitch your topic with ease and precision using this Issues Tracking Dashboard For Organizational Building Management Ppt Infographics Topics PDF. This layout presents information on Fault Tracking, Issues Reported, Location. It is also available for immediate download and adjustment. So, changes can be made in the color, design, graphics or any other component to create a unique layout.
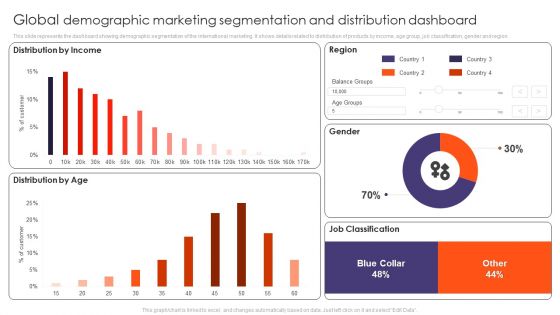
Global Demographic Marketing Segmentation And Distribution Dashboard Ppt Gallery Tips PDF
This slide represents the dashboard showing demographic segmentation of the international marketing. It shows details related to distribution of products by income, age group, job classification, gender and region. Pitch your topic with ease and precision using this Global Demographic Marketing Segmentation And Distribution Dashboard Ppt Gallery Tips PDF. This layout presents information on Distribution Income, Distribution Age, Region, Gender, Job Classification. It is also available for immediate download and adjustment. So, changes can be made in the color, design, graphics or any other component to create a unique layout.
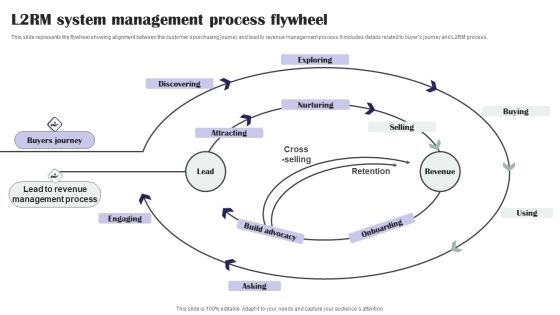
L2RM System Management Process Flywheel Ppt PowerPoint Presentation File Guidelines PDF
This slide represents the flywheel showing alignment between the customers purchasing journey and lead to revenue management process. It includes details related to buyers journey and L2RM process. Pitch your topic with ease and precision using this L2RM System Management Process Flywheel Ppt PowerPoint Presentation File Guidelines PDF. This layout presents information on Discovering, Exploring, Nurturing, Buying. It is also available for immediate download and adjustment. So, changes can be made in the color, design, graphics or any other component to create a unique layout.

Customer Lifetime Value Based Success KPIS Dashboard Ppt PowerPoint Presentation Layouts Gridlines PDF
This slide covers dashboard for estimation of customer lifetime value as success metrics. It includes KPIs such as customer lifetime value, customer lifetime period, customer risk, customer contact rate, customer retention costs, average lifetime value, customer churn rate, average revenue per account, etc. Pitch your topic with ease and precision using this Customer Lifetime Value Based Success KPIS Dashboard Ppt PowerPoint Presentation Layouts Gridlines PDF. This layout presents information on Average Revenue, Customer Lifetime, Customer Risk. It is also available for immediate download and adjustment. So, changes can be made in the color, design, graphics or any other component to create a unique layout.

Cyber Security Incident Analytics Dashboard With Level Of Security Ppt Ideas Graphics Tutorials PDF
The given slide depicts the cyber threat analytics to track the attacks. It includes the no. of incidents, open and solved tickets, category wise no. of incidents along with malware type etc. Pitch your topic with ease and precision using this Cyber Security Incident Analytics Dashboard With Level Of Security Ppt Ideas Graphics Tutorials PDF. This layout presents information on Power Security Team, Open Incidents, Incidents Solved, Open Tickets. It is also available for immediate download and adjustment. So, changes can be made in the color, design, graphics or any other component to create a unique layout.

Social Media Influence On Fashion Purchases Survey Ppt PowerPoint Presentation File Portfolio PDF
This slide represents the survey insights of impact of social media in influencing the fashion purchasing decisions of the consumers. It shows information related to social media fashion purchases influence on all online fashion shoppers, gen Z, millennials and baby boomersPitch your topic with ease and precision using this Social Media Influence On Fashion Purchases Survey Ppt PowerPoint Presentation File Portfolio PDF. This layout presents information on Social Media, Influence Fashion, Purchases Survey. It is also available for immediate download and adjustment. So, changes can be made in the color, design, graphics or any other component to create a unique layout.
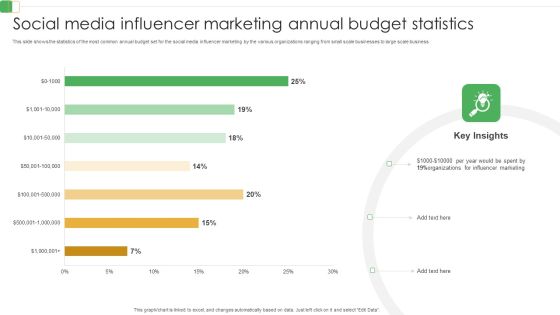
Social Media Influencer Marketing Annual Budget Statistics Ppt PowerPoint Presentation File Professional PDF
This slide shows the statistics of the most common annual budget set for the social media influencer marketing by the various organizations ranging from small scale businesses to large scale business. Pitch your topic with ease and precision using this Social Media Influencer Marketing Annual Budget Statistics Ppt PowerPoint Presentation File Professional PDF. This layout presents information on Social Media, Influencer Marketing, Annual Budget Statistics. It is also available for immediate download and adjustment. So, changes can be made in the color, design, graphics or any other component to create a unique layout.
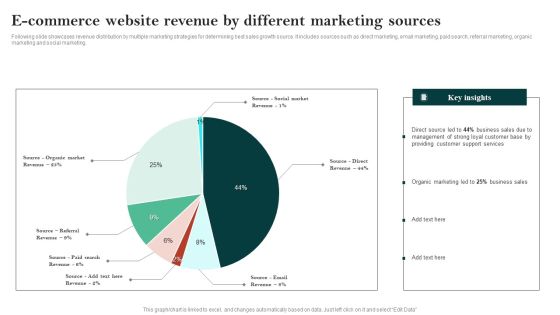
E Commerce Website Revenue By Different Marketing Sources Ppt Ideas PDF
Following slide showcases revenue distribution by multiple marketing strategies for determining best sales growth source. It includes sources such as direct marketing, email marketing, paid search, referral marketing, organic marketing and social marketing. Pitch your topic with ease and precision using this E Commerce Website Pre Launch Checklist Ppt Summary Backgrounds PDF. This layout presents information on Direct Source Led, Business Sales, Customer Base. It is also available for immediate download and adjustment. So, changes can be made in the color, design, graphics or any other component to create a unique layout.

 Home
Home