AI PPT Maker
Templates
PPT Bundles
Design Services
Business PPTs
Business Plan
Management
Strategy
Introduction PPT
Roadmap
Self Introduction
Timelines
Process
Marketing
Agenda
Technology
Medical
Startup Business Plan
Cyber Security
Dashboards
SWOT
Proposals
Education
Pitch Deck
Digital Marketing
KPIs
Project Management
Product Management
Artificial Intelligence
Target Market
Communication
Supply Chain
Google Slides
Research Services
 One Pagers
All Categories
-
Home
- Customer Favorites
- Forecast
Forecast

Circular Diagram Of Agile Software Development Powerpoint Templates
This PowerPoint template has been designed with circular diagram This diagram is a data visualization tool that gives you a simple way to present statistical information. This slide helps your audience examine and interpret the data you present.
Three Numeric Tags For Text Representation Powerpoint Template
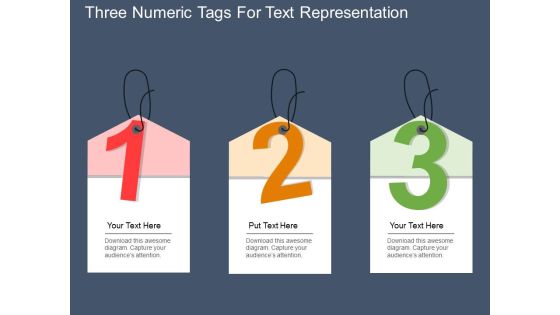
This PPT slide has been designed with graphics of three numeric tags. Download this PowerPoint template to exhibit entrepreneurship statistics. Accelerate the impact of your ideas using this PowerPoint diagram slide.

Tablet With Bar Graph And Pie Chart Powerpoint Templates
This business slide has been designed with business graphs on computer tablet. You may download this PPT slide to display statistical analysis. This slide will help you to sequence your thoughts.
Six Unidirectional Arrows With Business Icons Process Flow Powerpoint Templates
This business slide displays spiral road map design with icons. This diagram is a data visualization tool that gives you a simple way to present statistical information. This slide helps your audience examine and interpret the data you present.

Business Reports On Laptop Powerpoint Template
This PPT slide has been designed with graphics of laptop on office table presenting statistical graph. This business diagram maybe used to exhibit management strategy. Use this diagram to build an exclusive presentation.

Money Growth Chart On Laptop With Mouse Powerpoint Template
This business slide displays money growth chart on laptop with mouse. This diagram is a data visualization tool that gives you a simple way to present statistical information. This slide helps your audience examine and interpret the data you present.
Three Tags For Ecommerce Business And Corporate Concepts Powerpoint Slides
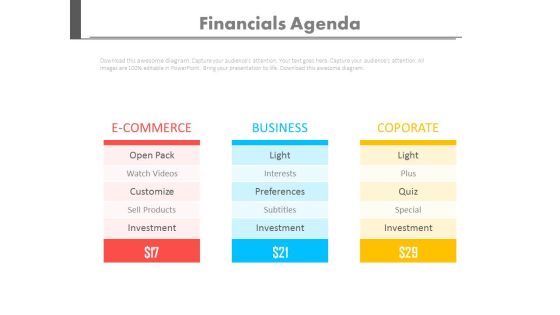
This PowerPoint template contains three tags with numeric data. You may download this slide to display business, corporate and ecommerce statistics. You can easily customize this template to make it more unique as per your need.

Two Table Charts For Business Data Powerpoint Slides
This PowerPoint template contains two tables chart. You may download this PPT slide to display statistical analysis. You can easily customize this template to make it more unique as per your need.

Bar Graph For Year Based Analysis Powerpoint Slides
This PowerPoint template has been designed with year based bar graph. This diagram may be used to display yearly statistical analysis. Use this PPT slide design to make impressive presentations.
Year Based Chart With Percentage Data Analysis Powerpoint Slides
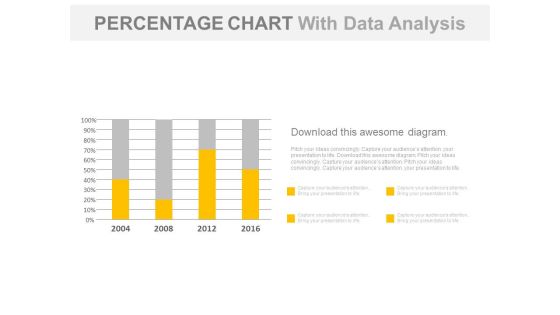
Our above business slide contains year based statistical chart. This PowerPoint template can be used to display percentage data analysis. Capture the attention of your audience with this slide.

Business Charts About Us Slide Powerpoint Slides
This PowerPoint template has been designed with graphics of business charts. Download this PPT slide to display industry growth statistics. You can easily customize this template to make it more unique as per your need.

Data Driven Comparison Charts For Analysis Powerpoint Slides
You can download this PowerPoint template to display statistical data and analysis. This PPT slide contains data driven comparison charts. Draw an innovative business idea using this professional diagram.

Board With Bar Graph For Financial Analysis Powerpoint Slides
You can download this PowerPoint template to display statistical data and analysis. This PPT slide contains display board with bar graph. Draw an innovative business idea using this professional diagram.

Five Years Planning Timeline Chart Powerpoint Slides
This timeline diagram displays five sequential year steps. This PowerPoint template may be used to display when statistical analysis. This timeline design is most useful for showing important milestones and deadlines.

Goal Achievement Success Trophy Diagram Powerpoint Slides
This PPT slide contains circular graphics around trophy. You may download this PowerPoint template to display goal achievement facts, figures and achievement statistics. Impress your audiences by using this PPT slide.
Pie Chart On Clipboard For Analysis Powerpoint Template
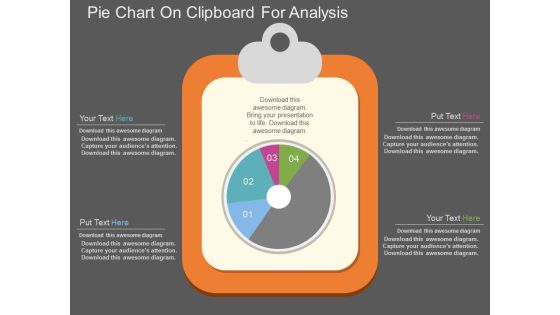
This PowerPoint template has been designed with graphics of pie chart on clipboard. Download this PPT slide for business and financial analysis. You may also use this professional template to depict statistical analysis.

Lego Blocks Design For Data Representation Powerpoint Slides
This PowerPoint template has been designed with Lego blocks diagram. You can use this ppt slide for statistical analysis or for data representation. Download this PPT slide to build impressive presentations.
Eight Staged Infographics Arrow And Icons Powerpoint Template
This PowerPoint slide has been designed with eight staged infographic diagram. This PowerPoint template is suitable to display concept of probabilities statistics. This professional slide helps in making an instant impact on viewers.
Seven Staged Business Cubes And Icons Powerpoint Template
This PowerPoint template has been designed with graphics of seven cubes and business icons. Download this PPT slide for business and financial analysis. You may also use this professional template to depict statistical analysis.
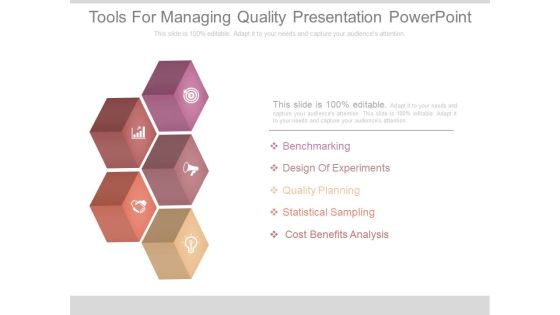
Tools For Managing Quality Presentation Powerpoint
This is a tools for managing quality presentation powerpoint. This is a five stage process. The stages in this process are benchmarking, design of experiments, quality planning, statistical sampling, cost benefits analysis.

Control Quality Management Template Powerpoint Guide
This is a control quality management template powerpoint guide. This is a four stage process. The stages in this process are methods for managing quality control, statistical sampling, quality tools flowcharts scatter diagram histograms, inspection, approved change requests review.
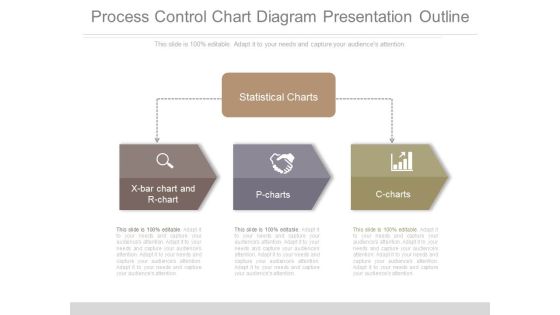
Process Control Chart Diagram Presentation Outline
This is a process control chart diagram presentation outline. This is a three stage process. The stages in this process are statistical charts, x bar chart and r chart, p charts, c charts.
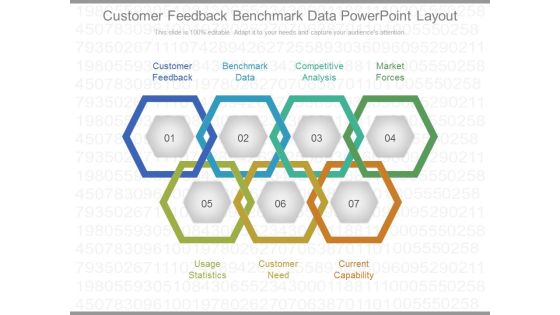
Customer Feedback Benchmark Data Powerpoint Layout
This is a customer feedback benchmark data powerpoint layout. This is a seven stage process. The stages in this process are customer feedback, benchmark data, competitive analysis, market forces, usage statistics, customer need, current capability.
Small Business Economics Indicators Powerpoint Templates
This is a small business economics indicators powerpoint templates. This is a five stage process. The stages in this process are essential economic indicators, gross domestic product, current employment statistics, consumer confidence, producer price index, consumer price index.
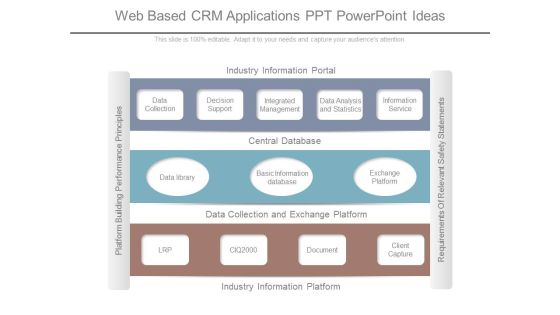
Web Based Crm Applications Ppt Powerpoint Ideas
This is a web based crm applications ppt powerpoint ideas. This is a three stage process. The stages in this process are industry information portal, data collection, decision support, integrated management, data analysis and statistics, information service, central database.
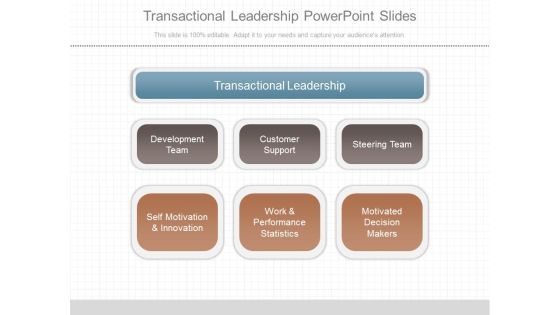
Transactional Leadership Powerpoint Slides
This is a transactional leadership powerpoint slides. This is a three stage process. The stages in this process are transactional leadership, development team, customer support, steering team, self motivation and innovation, work and performance statistics, motivated decision makers.
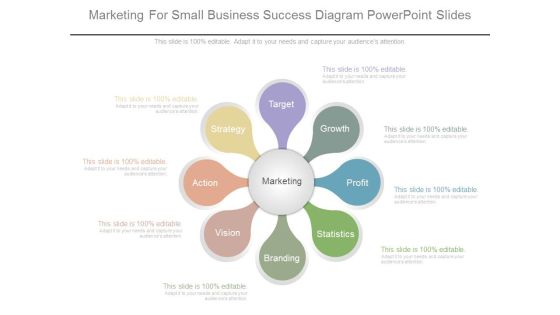
Marketing For Small Business Success Diagram Powerpoint Slides
This is a marketing for small business success diagram powerpoint slides. This is a eight stage process. The stages in this process are target, growth, profit, statistics, branding, vision, action, strategy, marketing.

Closed Loop Process Optimization Diagram Powerpoint Slides Deck Samples
This is a closed loop process optimization diagram powerpoint slides deck samples. This is a eight stage process. The stages in this process are performance management, feedback analytics, organizational alignment, generate statistics, strategy development, process optimization.

Customer Contact Risk Profiling Sample Diagram Powerpoint Slides
This is a customer contact risk profiling sample diagram powerpoint slides. This is a six stage process. The stages in this process are risk profiling, contact management, usage statistics profiling, industry penetration analysis, non compliance, customer value assessment.

Professional Services Support Diagram Presentation Visual Aids
This is a professional services support diagram presentation visual aids. This is a five stage process. The stages in this process are statistical models, gather data, enrollment, capacity, boundaries.

Data Driven Control Chat Powerpoint Slide Themes
This is a data driven control chat powerpoint slide themes. This is a one stage process. The stages in this process are process output, upper control limit, statistical process control, lower control limit.

Integrated Business Analysis Powerpoint Slides Design
This is a integrated business analysis powerpoint slides design. This is a five stage process. The stages in this process are approach data, investigation, statistics, practice methods, solution optimization.

Trend Line Technical Analysis Powerpoint Themes
This is a trend line technical analysis powerpoint themes. This is a five stage process. The stages in this process are complex systems, statistical modeling, uncertainty, lateral thinking, mathematical analysis.
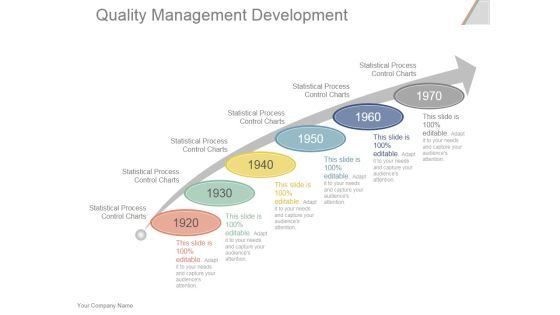
Quality Management Development Ppt PowerPoint Presentation Deck
This is a quality management development ppt powerpoint presentation deck. This is a six stage process. The stages in this process are statistical process control charts, business, strategy, time planning.
Thesis Defense Presentation Outline Ppt PowerPoint Presentation Icon Infographics
This is a thesis defense presentation outline ppt powerpoint presentation icon infographics. This is a nine stage process. The stages in this process are title slide, introduction, purpose, methods, statistical analysis, results, discussion.

Thesis Presentation Outline Ppt PowerPoint Presentation Infographic Template Graphics Tutorials
This is a thesis presentation outline ppt powerpoint presentation infographic template graphics tutorials. This is a nine stage process. The stages in this process are introduction, purpose, methods, statistical analysis, results, discussion, conclusions.

Evolution Of Quality Management Ppt PowerPoint Presentation Inspiration Demonstration
This is a evolution of quality management ppt powerpoint presentation inspiration demonstration. This is a six stage process. The stages in this process are statistical process control charts, arrows, business, marketing, management.

Business Process Improvement Ppt PowerPoint Presentation Model Elements
This is a business process improvement ppt powerpoint presentation model elements. This is a six stage process. The stages in this process are total participation, customer focus, systematic problem solving focus, statistical quality control, quality improvement team.

Business Process Improvement Ppt PowerPoint Presentation Summary Graphics Pictures
This is a business process improvement ppt powerpoint presentation summary graphics pictures. This is a five stage process. The stages in this process are quality improvement team, total participation, customer focus, systematic problem solving focus, statistical quality control.
Thesis Defense Presentation Outline Ppt PowerPoint Presentation Infographic Template Icons
This is a thesis defense presentation outline ppt powerpoint presentation infographic template icons. This is a nine stage process. The stages in this process are title slide, introduction, purpose, methods, statistical analysis.

Business Process Improvement Ppt PowerPoint Presentation Gallery Good
This is a business process improvement ppt powerpoint presentation gallery good. This is a five stage process. The stages in this process are quality improvement team, total participation, customer focus, systematic problem solving focus, statistical quality control.
Thesis Presentation Outline Ppt PowerPoint Presentation Icon Microsoft
This is a thesis presentation outline ppt powerpoint presentation icon microsoft. This is a one stage process. The stages in this process are title slide, introduction, purpose, methods, statistical analysis, results, discussion.
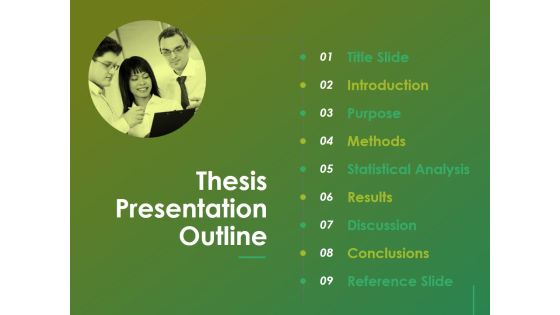
Thesis Presentation Outline Ppt Powerpoint Presentation File Format Ideas
This is a thesis presentation outline ppt powerpoint presentation file format ideas. This is a nine stage process. The stages in this process are introduction, purpose, methods, statistical analysis, results, discussion.

Market Feasibility Ppt PowerPoint Presentation Infographics Brochure
This is a market feasibility ppt powerpoint presentation infographics brochure. This is a six stage process. The stages in this process are demand statistics, competitive analysis, swot analysis, key trends in the industry.

Market Feasibility Ppt PowerPoint Presentation Ideas Vector
This is a market feasibility ppt powerpoint presentation ideas vector. This is a five stage process. The stages in this process are key trends in the industry, demand statistics, competitive analysis, swot analysis, marketing and promotional arrangements.

Business Process Improvement Ppt PowerPoint Presentation Portfolio Clipart Images
This is a Business Process Improvement Ppt PowerPoint Presentation Portfolio Clipart Images. This is a two stage process. The stages in this process are quality improvement team, total participation, customer focus, systematic problem solving focus, statistical quality control.
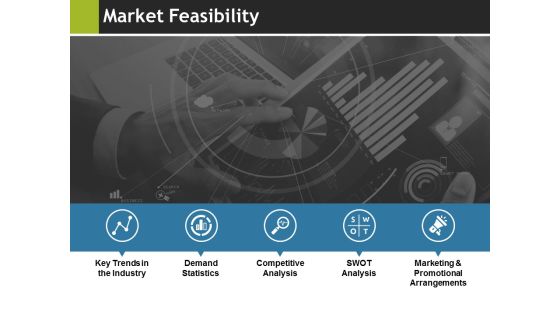
Market Feasibility Ppt PowerPoint Presentation Outline Example
This is a market feasibility ppt powerpoint presentation outline example. This is a five stage process. The stages in this process are key trends in the industry, demand statistics, competitive analysis, swot analysis, marketing and promotional arrangements.

Consumer Insights Outline Ppt PowerPoint Presentation Icon Example File
This is a consumer insights outline ppt powerpoint presentation icon example file. This is a six stage process. The stages in this process are research methodology, key statistics, data collection, need for consumer insights.

Bar Chart For Business Performance Evaluation Ppt PowerPoint Presentation Infographics Professional
This is a bar chart for business performance evaluation ppt powerpoint presentation infographics professional. This is a five stage process. The stages in this process are metrics icon, kpis icon, statistics icon.

Chart With Magnifying Glass For Business Research Ppt PowerPoint Presentation Inspiration Shapes
This is a chart with magnifying glass for business research ppt powerpoint presentation inspiration shapes. This is a two stage process. The stages in this process are metrics icon, kpis icon, statistics icon.

Data Research And Analytics Ppt PowerPoint Presentation Infographics Examples
This is a data research and analytics ppt powerpoint presentation infographics examples. This is a one stage process. The stages in this process are metrics icon, kpis icon, statistics icon.
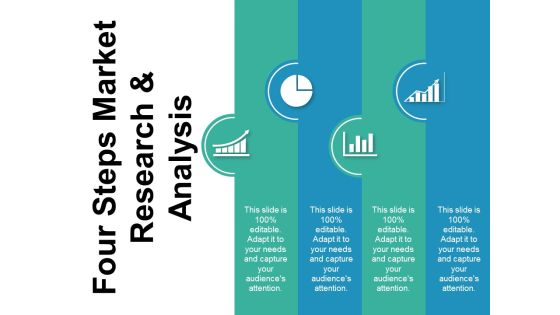
Four Steps Market Reasrch And Analysis Ppt PowerPoint Presentation Infographic Template Maker
This is a four steps market reasrch and analysis ppt powerpoint presentation infographic template maker. This is a four stage process. The stages in this process are metrics icon, kpis icon, statistics icon.
Laptop And Magnifying Glass Icon Ppt PowerPoint Presentation Outline Clipart Images
This is a laptop and magnifying glass icon ppt powerpoint presentation outline clipart images. This is a two stage process. The stages in this process are metrics icon, kpis icon, statistics icon.
Laptop With Gears Software Testing Ppt PowerPoint Presentation Infographic Template Sample
This is a laptop with gears software testing ppt powerpoint presentation infographic template sample. This is a two stage process. The stages in this process are metrics icon, kpis icon, statistics icon.
Seven Steps Of Business Workflow With Icons Ppt PowerPoint Presentation Infographic Template Diagrams
This is a seven steps of business workflow with icons ppt powerpoint presentation infographic template diagrams. This is a seven stage process. The stages in this process are metrics icon, kpis icon, statistics icon.

Website Maintenance And Support Design And Development Ppt PowerPoint Presentation Inspiration Outfit
This is a website maintenance and support design and development ppt powerpoint presentation inspiration outfit. This is a five stage process. The stages in this process are metrics icon, kpis icon, statistics icon.

Professional Development Debt Management Online Marketing Employee Assessment Ppt PowerPoint Presentation Layouts Graphics Download
This is a professional development debt management online marketing employee assessment ppt powerpoint presentation layouts graphics download. This is a five stage process. The stages in this process are professional development plans, statistics data mining, performance rewards.

Area Graph Showing Sales Trends Over Time Ppt PowerPoint Presentation Model Background Designs
This is a area graph showing sales trends over time ppt powerpoint presentation model background designs. This is a three stage process. The stages in this process are financial analysis, quantitative, statistical modelling.

Bar Graph Icon For Data Analysis Ppt PowerPoint Presentation Pictures Ideas
This is a bar graph icon for data analysis ppt powerpoint presentation pictures ideas. This is a four stage process. The stages in this process are financial analysis, quantitative, statistical modelling.

Data Analysis Chart For Funds Management Ppt PowerPoint Presentation Infographic Template Files
This is a data analysis chart for funds management ppt powerpoint presentation infographic template files. This is a five stage process. The stages in this process are financial analysis, quantitative, statistical modelling.
