Forecast Dashboard

Creating Employee Value Proposition Survey Questionnaire Result Analysis Slides PDF
This slide presents statistical data analyzing responses of survey to measure employee experience after building employee value proposition. It includes elements such as rewards and recognition, opportunities, management and supervision, leadership, communication, teamwork, engagement, personal experience, etc. Get a simple yet stunning designed Creating Employee Value Proposition Survey Questionnaire Result Analysis Slides PDF. It is the best one to establish the tone in your meetings. It is an excellent way to make your presentations highly effective. So, download this PPT today from Slidegeeks and see the positive impacts. Our easy-to-edit Creating Employee Value Proposition Survey Questionnaire Result Analysis Slides PDF can be your go-to option for all upcoming conferences and meetings. So, what are you waiting for Grab this template today.
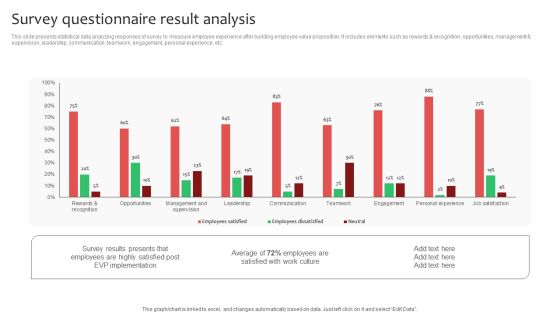
Survey Questionnaire Result Analysis Ppt Ideas Show PDF
This slide presents statistical data analyzing responses of survey to measure employee experience after building employee value proposition. It includes elements such as rewards and recognition, opportunities, management and supervision, leadership, communication, teamwork, engagement, personal experience, etc. Do you have an important presentation coming up Are you looking for something that will make your presentation stand out from the rest Look no further than Survey Questionnaire Result Analysis Ppt Ideas Show PDF. With our professional designs, you can trust that your presentation will pop and make delivering it a smooth process. And with Slidegeeks, you can trust that your presentation will be unique and memorable. So why wait Grab Survey Questionnaire Result Analysis Ppt Ideas Show PDF today and make your presentation stand out from the rest.
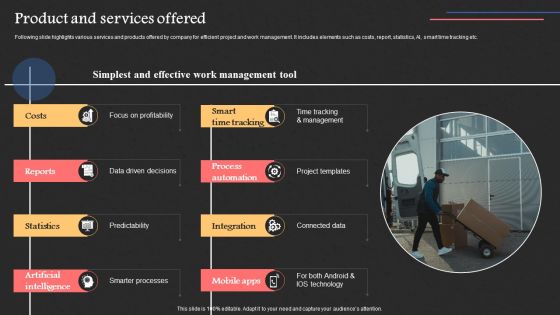
Project Management Software Capital Raising Deck Product And Services Offered Formats PDF
Following slide highlights various services and products offered by company for efficient project and work management. It includes elements such as costs, report, statistics, AI, smart time tracking etc. The Project Management Software Capital Raising Deck Product And Services Offered Formats PDF is a compilation of the most recent design trends as a series of slides. It is suitable for any subject or industry presentation, containing attractive visuals and photo spots for businesses to clearly express their messages. This template contains a variety of slides for the user to input data, such as structures to contrast two elements, bullet points, and slides for written information. Slidegeeks is prepared to create an impression.
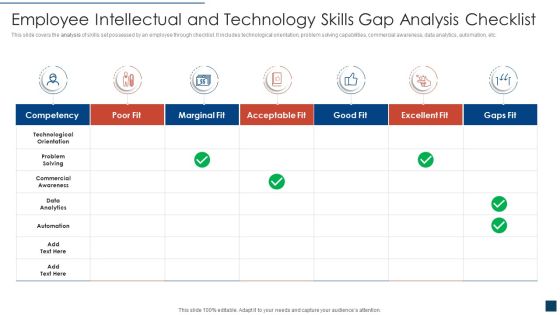
Employee Intellectual And Technology Skills Gap Analysis Checklist Professional PDF
This slide covers the analysis of skills set possessed by an employee through checklist. It includes technological orientation, problem solving capabilities, commercial awareness, data analytics, automation, etc. Pitch your topic with ease and precision using this employee intellectual and technology skills gap analysis checklist professional pdf. This layout presents information on employee intellectual and technology skills gap analysis checklist. It is also available for immediate download and adjustment. So, changes can be made in the color, design, graphics or any other component to create a unique layout.

Strategies To Make Better And Informed Data Driven Decisions Introduction PDF
This slide represents the tactics to be adopted by marketers while using gathered customer and corporate data to make right business decisions. It includes techniques to make data driven decisions such as find the story, consult data and learn data visualization. Are you searching for a Strategies To Make Better And Informed Data Driven Decisions Introduction PDF that is uncluttered, straightforward, and original Its easy to edit, and you can change the colors to suit your personal or business branding. For a presentation that expresses how much effort you have put in, this template is ideal With all of its features, including tables, diagrams, statistics, and lists, its perfect for a business plan presentation. Make your ideas more appealing with these professional slides. Download Strategies To Make Better And Informed Data Driven Decisions Introduction PDF from Slidegeeks today.

Toolkit For Data Science And Analytics Transition Key Requirements For Data Analytics Project Ideas PDF
The slide gives an overview of key business elements that are required for data analytics project. It includes information such as business value drivers, data strategy, and decision model etc. Make sure to capture your audiences attention in your business displays with our gratis customizable Toolkit For Data Science And Analytics Transition Key Requirements For Data Analytics Project Ideas PDF. These are great for business strategies, office conferences, capital raising or task suggestions. If you desire to acquire more customers for your tech business and ensure they stay satisfied, create your own sales presentation with these plain slides.
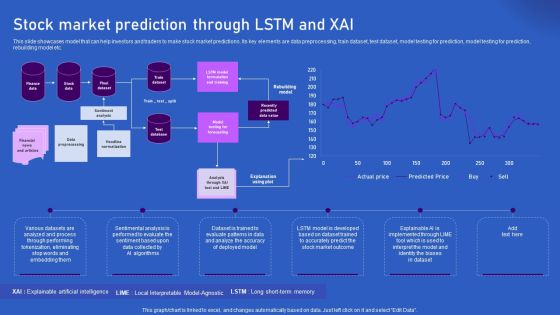
Ways Artificial Intelligence Is Transforming Finance Sector Stock Market Prediction Through Professional PDF
This slide showcases model that can help investors and traders to make stock market predictions. Its key elements are data preprocessing, train dataset, test dataset, model testing for prediction, model testing for prediction, rebuilding model etc. There are so many reasons you need a Ways Artificial Intelligence Is Transforming Finance Sector Stock Market Prediction Through Professional PDF. The first reason is you cannot spend time making everything from scratch, Thus, Slidegeeks has made presentation templates for you too. You can easily download these templates from our website easily.

Big Data Architect Big Data Management With Machine Learning Diagrams PDF
This slide depicts a comparison between big data and machine learning based on its working, algorithms, data sources, and way of data analysis.Deliver an awe inspiring pitch with this creative Big Data Architect Big Data Management With Machine Learning Diagrams PDF bundle. Topics like Different Forms, Organized Unstructured, Found Collections can be discussed with this completely editable template. It is available for immediate download depending on the needs and requirements of the user.

Toolkit For Data Science And Analytics Transition Reasons Towards Failure Of Data Analytics Project Background PDF
This slide shows the graph highlighting key reasons for the failure of data management project. If you are looking for a format to display your unique thoughts, then the professionally designed Toolkit For Data Science And Analytics Transition Reasons Towards Failure Of Data Analytics Project Background PDF is the one for you. You can use it as a Google Slides template or a PowerPoint template. Incorporate impressive visuals, symbols, images, and other charts. Modify or reorganize the text boxes as you desire. Experiment with shade schemes and font pairings. Alter, share or cooperate with other people on your work. Download Toolkit For Data Science And Analytics Transition Reasons Towards Failure Of Data Analytics Project Background PDF and find out how to give a successful presentation. Present a perfect display to your team and make your presentation unforgettable.
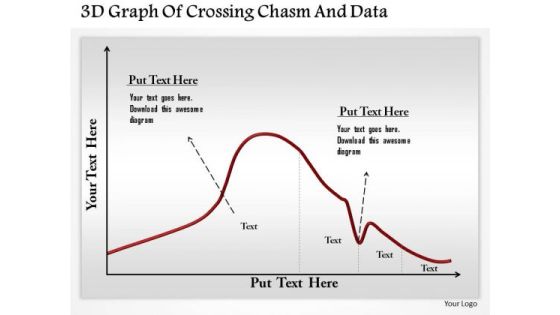
Business Diagram 3d Graph Of Crossing Chasm And Data Presentation Template
This business diagram has been designed with graphic of 3d graph. This slide contains the concept of chasm and data calculation. Use this slide to display chasm crossing condition. This business diagram adds value to your ideas.
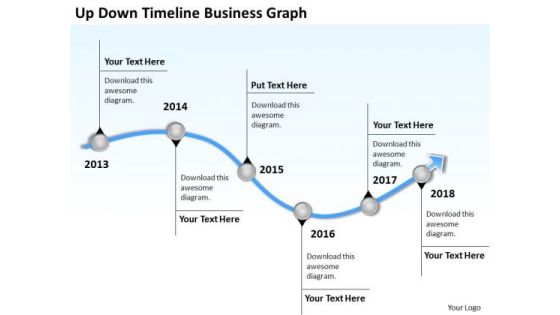
Business Analysis Diagrams PowerPoint Presentations Graph Templates
We present our business analysis diagrams powerpoint presentations graph templates.Download and present our Curves and Lines PowerPoint Templates because Your audience will believe you are the cats whiskers. Present our Business PowerPoint Templates because Our PowerPoint Templates and Slides will effectively help you save your valuable time. They are readymade to fit into any presentation structure. Present our Business PowerPoint Templates because Our PowerPoint Templates and Slides will give good value for money. They also have respect for the value of your time. Use our Arrows PowerPoint Templates because It will get your audience in sync. Present our Process and Flows PowerPoint Templates because It can Conjure up grand ideas with our magical PowerPoint Templates and Slides. Leave everyone awestruck by the end of your presentation.Use these PowerPoint slides for presentations relating to 3d, account, accounting, annual, balance, business, chart, commerce, crisis, data,earnings, economics, economy, exchange, figures, finance, financial, graph,graphic, growth, illustration, index, information, investment, list, line,management,market, marketing, money, monitoring, numbers, office, paperwork, plan, price,printout, report, research, sale, statistical, statistics, stock, success, tax, trade,work. The prominent colors used in the PowerPoint template are Blue light, Gray, White.
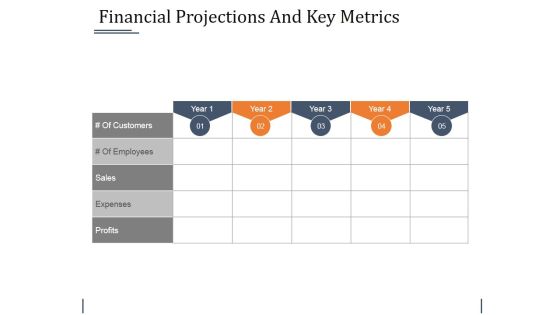
Financial Projections And Key Metrics Ppt PowerPoint Presentation Layouts Objects
This is a financial projections and key metrics ppt powerpoint presentation layouts objects. This is a five stage process. The stages in this process are sales, expenses, profits.

Strategic Marketing For Hair And Beauty Salon To Increase Trending Salon Services Checklist Microsoft PDF
This slide presents a checklist for convenient services in the salon Industry. It includes services such as mobile payments, in salon Wi Fi, mobile rewards and additional conveniences. Find highly impressive Strategic Marketing For Hair And Beauty Salon To Increase Trending Salon Services Checklist Microsoft PDF on Slidegeeks to deliver a meaningful presentation. You can save an ample amount of time using these presentation templates. No need to worry to prepare everything from scratch because Slidegeeks experts have already done a huge research and work for you. You need to download Strategic Marketing For Hair And Beauty Salon To Increase Trending Salon Services Checklist Microsoft PDF for your upcoming presentation. All the presentation templates are 100 percent editable and you can change the color and personalize the content accordingly. Download now.
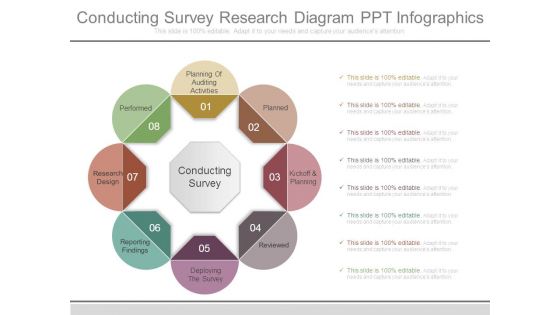
Conducting Survey Research Diagram Ppt Infographics
This is a conducting survey research diagram ppt infographics. This is a eight stage process. The stages in this process are planned, kickoff and planning, reviewed, deploying the survey, reporting findings, research design, performed, planning of auditing activities, conducting survey.

Financial Projections And Key Metrics Ppt PowerPoint Presentation Styles Skills
This is a financial projections and key metrics ppt powerpoint presentation styles skills. This is a five stage process. The stages in this process are expenses, profits, sales, employees, years.

Checklist For Conducting Target Market Assessment Graphics PDF
This slide covers the checklist for executing the process of target market research. It includes tasks such as creating a buyer persona, asking the audience about their interests, collecting data about the audience, leveraging social media analytics, etc. Persuade your audience using this Checklist For Conducting Target Market Assessment Graphics PDF. This PPT design covers eleven stages, thus making it a great tool to use. It also caters to a variety of topics including Social Media, Google Analytics, Purchase Behaviours. Download this PPT design now to present a convincing pitch that not only emphasizes the topic but also showcases your presentation skills.

Set Performance Standards Evaluation Criteria And Indicators Employee Performance Management Designs PDF
The following slide covers the current and the desired performance goals to reduce shortcomings and attain better results. It mainly includes elements such as actions, evaluation method, key performance indicators KPIs etc. Take your projects to the next level with our ultimate collection of Set Performance Standards Evaluation Criteria And Indicators Employee Performance Management Designs PDF. Slidegeeks has designed a range of layouts that are perfect for representing task or activity duration, keeping track of all your deadlines at a glance. Tailor these designs to your exact needs and give them a truly corporate look with your own brand colors they all make your projects stand out from the rest.

Checklist For Management Of Healthcare Employees Demonstration PDF
The following slide outlines multipoint checklist which can be used by Healthcare companies to protect the workforce from covid-19. It covers key points such as covid-19 exposure control panel, measures to maintain social distancing, work practices and medical health staff.Showcasing this set of slides titled Checklist For Management Of Healthcare Employees Demonstration PDF. The topics addressed in these templates are Maintain Social Distancing, Regarding Precautionary, Jobs Remotely. All the content presented in this PPT design is completely editable. Download it and make adjustments in color, background, font etc. as per your unique business setting.

Balance Sheet Kpis Tabular Form Ppt PowerPoint Presentation Deck
This is a balance sheet kpis tabular form ppt powerpoint presentation deck. This is a four stage process. The stages in this process are shareholders equity, non current liabilities, short term borrowings, trade payables, other current liabilities, short term provisions, current liabilities.

Cash Flow Statement Kpis Tabular Form Ppt PowerPoint Presentation Inspiration
This is a cash flow statement kpis tabular form ppt powerpoint presentation inspiration. This is a four stage process. The stages in this process are cash flow from operations, cash flow from investing activities, cash flow from financing activities, change in cash and cash equivalents.

Kpis Tabular Form Ppt PowerPoint Presentation Outline Background Image
This is a kpis tabular form ppt powerpoint presentation outline background image. This is a four stage process. The stages in this process are non current investments, long term loans and advances, other non current assets, current investments, inventories, trade receivables.

Pandl Kpis Tabular Form Ppt PowerPoint Presentation File Format
Presenting this set of slides with name pandl kpis tabular form ppt powerpoint presentation file format. The topics discussed in these slides are business, management, planning, strategy, marketing. This is a completely editable PowerPoint presentation and is available for immediate download. Download now and impress your audience.

Balance Sheet Kpis Tabular Form Investments Ppt Slides Display PDF
Deliver an awe-inspiring pitch with this creative balance sheet kpis tabular form investments ppt slides display pdf. bundle. Topics like long term loans and advances, short term loans and advances can be discussed with this completely editable template. It is available for immediate download depending on the needs and requirements of the user.

Balance Sheet Kpis Tabular Form Provisions Ppt Layouts Display
Deliver and pitch your topic in the best possible manner with this balance sheet kpis tabular form provisions ppt layouts display. Use them to share invaluable insights on shareholders equity, short term provisions and impress your audience. This template can be altered and modified as per your expectations. So, grab it now.

Amalgamation Acquisitions Balance Sheet KPIs Tabular Form Assets Sample PDF
Deliver an awe-inspiring pitch with this creative amalgamation acquisitions balance sheet kpis tabular form assets sample pdf bundle. Topics like current assets, trade receivables, current investments, inventories can be discussed with this completely editable template. It is available for immediate download depending on the needs and requirements of the user.

Amalgamation Acquisitions Balance Sheet KPIs Tabular Form Formats PDF
Deliver and pitch your topic in the best possible manner with this amalgamation acquisitions balance sheet kpis tabular form formats pdf. Use them to share invaluable insights on shareholders equity, current liabilities, trade payables and impress your audience. This template can be altered and modified as per your expectations. So, grab it now.

Amalgamation Acquisitions Cash Flow Statement KPIs Tabular Form Professional PDF
Deliver and pitch your topic in the best possible manner with this amalgamation acquisitions cash flow statement kpis tabular form professional pdf. Use them to share invaluable insights on cash equivalents, financing activities, investing activities, cash flow, operations and impress your audience. This template can be altered and modified as per your expectations. So, grab it now.

Monthly Company Performance Analysisbalance Sheet Kpis Tabular Form Background PDF
Deliver and pitch your topic in the best possible manner with this monthly company performance analysisbalance sheet kpis tabular form background pdf. Use them to share invaluable insights on current investments, total assets and impress your audience. This template can be altered and modified as per your expectations. So, grab it now.

Toolkit For Data Science And Analytics Transition Mini Charter For Data Analytics Project Introduction PDF
In this slide, we are highlighting the scope of work for data analytics project. It describes the process, roles and key tasks required to interpret and present the data for a wide range of business applications. Slidegeeks is here to make your presentations a breeze with Toolkit For Data Science And Analytics Transition Mini Charter For Data Analytics Project Introduction PDF With our easy to use and customizable templates, you can focus on delivering your ideas rather than worrying about formatting. With a variety of designs to choose from, you are sure to find one that suits your needs. And with animations and unique photos, illustrations, and fonts, you can make your presentation pop. So whether you are giving a sales pitch or presenting to the board, make sure to check out Slidegeeks first.

Chart With Magnifying Glass For Business Research Ppt PowerPoint Presentation Inspiration Shapes
This is a chart with magnifying glass for business research ppt powerpoint presentation inspiration shapes. This is a two stage process. The stages in this process are metrics icon, kpis icon, statistics icon.

Data Lineage Methods Overview Of Self Contained Data Lineage Technique Topics PDF
This slide depicts the overview of the self-contained data lineage technique that records the information flow and changes in an inclusive environment. This technique falls short as it doesnot meet the expectations of new requirements and data handling tools. Are you searching for a Data Lineage Methods Overview Of Self Contained Data Lineage Technique Topics PDF that is uncluttered, straightforward, and original Its easy to edit, and you can change the colors to suit your personal or business branding. For a presentation that expresses how much effort you have put in, this template is ideal With all of its features, including tables, diagrams, statistics, and lists, its perfect for a business plan presentation. Make your ideas more appealing with these professional slides. Download Data Lineage Methods Overview Of Self Contained Data Lineage Technique Topics PDF from Slidegeeks today.

Agile Scrum Team Kpis With Heat Map Ppt Layouts Clipart Images PDF
This slide illustrates checklist of agile scrum metrics. It includes core and recommended agile key performance indicators and reviews indicated by heatmap. Pitch your topic with ease and precision using this Agile Scrum Team Kpis With Heat Map Ppt Layouts Clipart Images PDF. This layout presents information on Core, Distinct Product Owner, Scrum Demonstration. It is also available for immediate download and adjustment. So, changes can be made in the color, design, graphics or any other component to create a unique layout.
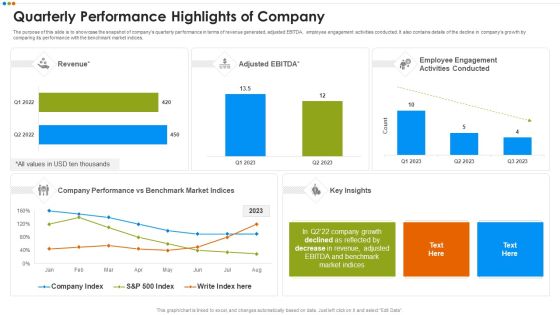
Quarterly Budget Analysis Of Business Organization Quarterly Performance Highlights Of Company Graphics PDF
The purpose of this slide is to showcase the snapshot of companys quarterly performance in terms of revenue generated, adjusted EBITDA, employee engagement activities conducted. It also contains details of the decline in companys growth by comparing its performance with the benchmark market indices.This is a Quarterly Budget Analysis Of Business Organization Quarterly Performance Highlights Of Company Graphics PDF template with various stages. Focus and dispense information on two stages using this creative set, that comes with editable features. It contains large content boxes to add your information on topics like Quarterly Performance Highlights Of Company You can also showcase facts, figures, and other relevant content using this PPT layout. Grab it now.

Concept Of Ontology In The Semantic Web Whats The Motivation Behind Semantic Web Ideas PDF
This slide talks about the motivation behind the semantic web to enable machines to understand data, and it includes automation, data reuse, knowledge discovery, personalization, and information retrieval. Are you searching for a Concept Of Ontology In The Semantic Web Whats The Motivation Behind Semantic Web Ideas PDF that is uncluttered, straightforward, and original Its easy to edit, and you can change the colors to suit your personal or business branding. For a presentation that expresses how much effort you have put in, this template is ideal With all of its features, including tables, diagrams, statistics, and lists, its perfect for a business plan presentation. Make your ideas more appealing with these professional slides. Download Concept Of Ontology In The Semantic Web Whats The Motivation Behind Semantic Web Ideas PDF from Slidegeeks today.

Comparative Analysis Of Types Of Project Assessing Infographics PDF
This slide depicts the comparison of various types of project monitoring. It includes monitoring management, financial and program those compared based on areas, data collected, source, and usage. Presenting Comparative Analysis Of Types Of Project Assessing Infographics PDF to dispense important information. This template comprises three stages. It also presents valuable insights into the topics including Management, Finance, Program. This is a completely customizable PowerPoint theme that can be put to use immediately. So, download it and address the topic impactfully.
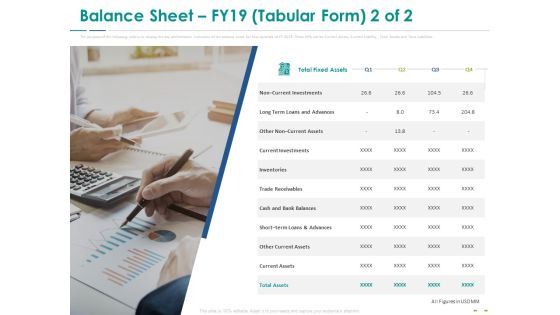
Stock Market Research Report Balance Sheet FY19 Tabular Form Investments Designs PDF
The purpose of the following slide is to display a tabular representation of the key performance indicators of the balance sheet for four quarters of FY 2019. These KPIs can be Current assets, Current Liability , Total Assets and Total Liabilities. This is a stock market research report balance sheet fy19 tabular form investments designs pdf template with various stages. Focus and dispense information on one stages using this creative set, that comes with editable features. It contains large content boxes to add your information on topics like non current investments, long term loans and advances, current investments, inventories, trade receivables. You can also showcase facts, figures, and other relevant content using this PPT layout. Grab it now.

Comprehensive Analysis Of Different Data Lineage Classification Steps To Implement Data Lineage Designs PDF
This slide represents the steps to implement data lineage in business, and it includes finding key business drivers, onboarding the senior management on the project, scoping the project, and defining the scope. Find highly impressive Comprehensive Analysis Of Different Data Lineage Classification Steps To Implement Data Lineage Designs PDF on Slidegeeks to deliver a meaningful presentation. You can save an ample amount of time using these presentation templates. No need to worry to prepare everything from scratch because Slidegeeks experts have already done a huge research and work for you. You need to download Comprehensive Analysis Of Different Data Lineage Classification Steps To Implement Data Lineage Designs PDF for your upcoming presentation. All the presentation templates are 100 percent editable and you can change the color and personalize the content accordingly. Download now

Financial Projections And Key Metrics Ppt PowerPoint Presentation Samples
This is a financial projections and key metrics ppt powerpoint presentation samples. This is a five stage process. The stages in this process are of customers, year, of employees, sales, expenses.
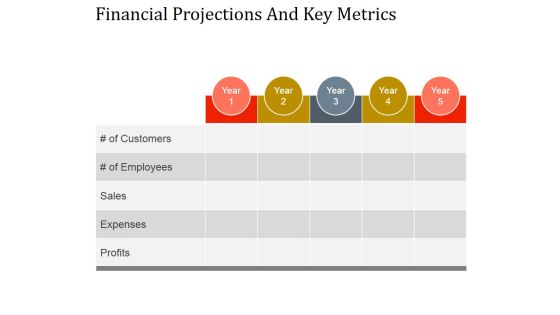
Financial Projections And Key Metrics Ppt PowerPoint Presentation Designs
This is a financial projections and key metrics ppt powerpoint presentation designs. This is a five stage process. The stages in this process are profits, expenses, sales, of employees, of customers.
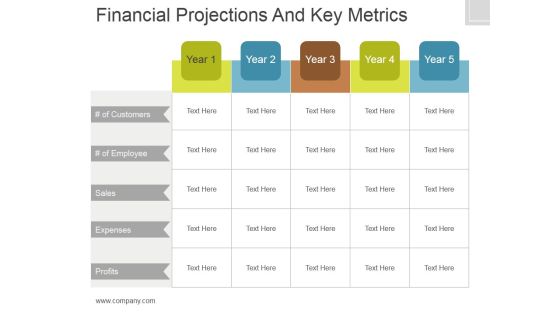
Financial Projections And Key Metrics Ppt PowerPoint Presentation Show
This is a financial projections and key metrics ppt powerpoint presentation show. This is a five stage process. The stages in this process are of customers, sales, expenses, profits.

Toolkit For Data Science And Analytics Transition Communication Best Practices For Data Analytics Project Summary PDF
This slide highlights the communication plan for translating the data analytics activities to team members with formal channel and frequency. Do you know about Slidesgeeks Toolkit For Data Science And Analytics Transition Communication Best Practices For Data Analytics Project Summary PDF These are perfect for delivering any kind od presentation. Using it, create PowerPoint presentations that communicate your ideas and engage audiences. Save time and effort by using our pre designed presentation templates that are perfect for a wide range of topic. Our vast selection of designs covers a range of styles, from creative to business, and are all highly customizable and easy to edit. Download as a PowerPoint template or use them as Google Slides themes.

Comprehensive Analysis Of Different Data Lineage Classification Key Areas Where Data Lineage Download PDF
This slide talks about the key areas where data lineage can have a significant impact and help businesses to fix errors. It includes strategic decision making, data governance, data migration and optimal use of new and old data sets. Take your projects to the next level with our ultimate collection of Comprehensive Analysis Of Different Data Lineage Classification Key Areas Where Data Lineage Download PDF. Slidegeeks has designed a range of layouts that are perfect for representing task or activity duration, keeping track of all your deadlines at a glance. Tailor these designs to your exact needs and give them a truly corporate look with your own brand colors they will make your projects stand out from the rest

Information Transformation Process Toolkit Business Case And Data Analytical Roadmap Microsoft PDF
This slide illustrates a detailed roadmap covering the key stages, priority tasks and action plan for the data analytics project. Presenting Information Transformation Process Toolkit Business Case And Data Analytical Roadmap Microsoft PDF to provide visual cues and insights. Share and navigate important information on four stages that need your due attention. This template can be used to pitch topics like Capability Stage, Analytical Stage, Business Stage, Technological Stage. In addtion, this PPT design contains high resolution images, graphics, etc, that are easily editable and available for immediate download.

7 Stages Analysis And Implementation Process Business Plan Template PowerPoint Slides
We present our 7 stages analysis and implementation process business plan template PowerPoint Slides.Download our Gear Wheels PowerPoint Templates because Watching this your Audience will Grab their eyeballs, they wont even blink. Download our Circle Charts PowerPoint Templates because They will Put the wind in your sails. Skim smoothly over the choppy waters of the market. Use our Business PowerPoint Templates because Our PowerPoint Templates and Slides will help you be quick off the draw. Just enter your specific text and see your points hit home. Download and present our Process and Flows PowerPoint Templates because You can Inspire your team with our PowerPoint Templates and Slides. Let the force of your ideas flow into their minds. Download our Shapes PowerPoint Templates because Your ideas provide food for thought. Our PowerPoint Templates and Slides will help you create a dish to tickle the most discerning palate.Use these PowerPoint slides for presentations relating to Chart, gear, pie, icon, profit, business, vector, wheel, isolated, white, concept, success, presentation, symbol, diagram, graphic, finance, data, calculate, cog, report, marketing, shape, management, piece, progress, part, investment,statistic, financial, editable, portion, performance. The prominent colors used in the PowerPoint template are Orange, Yellow, Green.

Financial Projections And Key Metrics Ppt PowerPoint Presentation Professional
This is a financial projections and key metrics ppt powerpoint presentation professional. This is a five stage process. The stages in this process are customers, employees, sales, expenses, profits.

Project Administration Kpis End Of Project Metrics Worksheet Slides PDF
Deliver an awe inspiring pitch with this creative Project Administration Kpis End Of Project Metrics Worksheet Slides PDF bundle. Topics like Product Launch, Cost, Resources Planning can be discussed with this completely editable template. It is available for immediate download depending on the needs and requirements of the user.

Project Administration Kpis Project Metrics Management Plan Template PDF
Deliver and pitch your topic in the best possible manner with this Project Administration Kpis Project Metrics Management Plan Template PDF. Use them to share invaluable insights on Cost Variance, Customer Satisfaction Index, Error Removal Capability and impress your audience. This template can be altered and modified as per your expectations. So, grab it now.

Data Driven Marketing Solutions Firm Company Profile Our Clients Themes PDF
The slide highlights the business clients for company marketing and research insights services. The clients includes the london school of economics and political science, TTF australia, news corp, survey healthcare globus and fun and IDG consulting Retrieve professionally designed Data Driven Marketing Solutions Firm Company Profile Our Clients Themes PDF to effectively convey your message and captivate your listeners. Save time by selecting pre made slideshows that are appropriate for various topics, from business to educational purposes. These themes come in many different styles, from creative to corporate, and all of them are easily adjustable and can be edited quickly. Access them as PowerPoint templates or as Google Slides themes. You do not have to go on a hunt for the perfect presentation because Slidegeeks got you covered from everywhere.

Monthly Employee Performance Review Report Form Sample PDF
The following slide outlines a comprehensive report form which can be used by the manager to review the employee performance on a monthly basis. It covers information about key performance indicators KPIs, description, total and actual score, and action plan. Pitch your topic with ease and precision using this Monthly Employee Performance Review Report Form Sample PDF. This layout presents information on Teamwork, Work Ethics, Work Efficiency. It is also available for immediate download and adjustment. So, changes can be made in the color, design, graphics or any other component to create a unique layout.

Real Estate Business Sales Pipeline With Performance Indicators Background PDF
This slide showcases a sales funnel for real estate company to generate and acquire leads and maximize business profitability. It includes key components such as lead enters funnel, lead qualification, newsletter signup, schedule showing, negotiation, close, real estate deal won, etc. Presenting Real Estate Business Sales Pipeline With Performance Indicators Background PDF to dispense important information. This template comprises eight stages. It also presents valuable insights into the topics including Budget Preference, Newsletter Signup, Real Estate Deal Won. This is a completely customizable PowerPoint theme that can be put to use immediately. So, download it and address the topic impactfully.
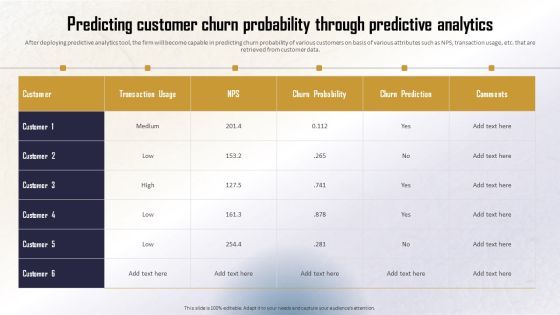
Identifying Direct And Indirect Predicting Customer Churn Probability Through Infographics PDF
After deploying predictive analytics tool, the firm will become capable in predicting churn probability of various customers on basis of various attributes such as NPS, transaction usage, etc. that are retrieved from customer data. The best PPT templates are a great way to save time, energy, and resources. Slidegeeks have 100 percent editable powerpoint slides making them incredibly versatile. With these quality presentation templates, you can create a captivating and memorable presentation by combining visually appealing slides and effectively communicating your message. Download Identifying Direct And Indirect Predicting Customer Churn Probability Through Infographics PDF from Slidegeeks and deliver a wonderful presentation.

Quarterly Funding Sources Statistical Trends Analysis For Tech Start Up Download PDF
This slide represents the statistical report showing the trend analysis related to quarterly funding sources for tech start-up. It represents data related to funding in last year, YOY funding growth, deals in last year, YOY deal growth, average deals and funding per quarter etc. Deliver an awe inspiring pitch with this creative Quarterly Funding Sources Statistical Trends Analysis For Tech Start Up Download PDF bundle. Topics like Funding Growth, Biggest Quarter, Avg Funding Per Quarter can be discussed with this completely editable template. It is available for immediate download depending on the needs and requirements of the user.
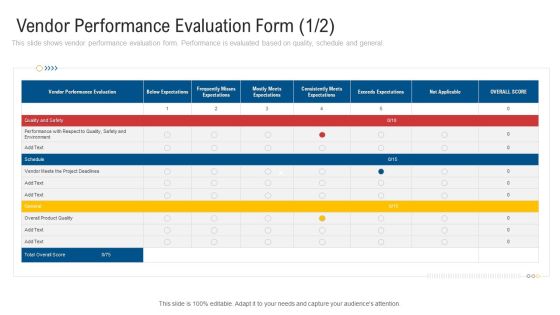
Inculcating Supplier Operation Improvement Plan Vendor Performance Evaluation Form Project Infographics PDF
This slide shows vendor performance evaluation form. Performance is evaluated based on quality, schedule and general. Deliver an awe inspiring pitch with this creative inculcating supplier operation improvement plan vendor performance evaluation form project infographics pdf bundle. Topics like below expectations, frequently misses expectations, vendor performance evaluation, exceeds expectations, overall score can be discussed with this completely editable template. It is available for immediate download depending on the needs and requirements of the user.

IT Project Development Planning Data Migration Approach Structure PDF
This slide covers data migration analysis and discovery, extract, cleanse, validate, load and reconcile, analyze source system and many more.Presenting IT Project Development Planning Data Migration Approach Structure PDF to provide visual cues and insights. Share and navigate important information on six stages that need your due attention. This template can be used to pitch topics like Analysis Discovery, Extract Profile, Transactional Data. In addtion, this PPT design contains high resolution images, graphics, etc, that are easily editable and available for immediate download.

Summary Report For Determine Best Digital Advertising Software Survey SS
Following slides demonstrates summarized survey report on online marketing tools conducted by marketing executives to improve lead generation rate. It includes elements such as SEO tools, pay per click tools and social media tools. Pitch your topic with ease and precision using this Summary Report For Determine Best Digital Advertising Software Survey SS. This layout presents information on SEO Tools, Budget Allocation, Satisfaction Level, Budget Allocation, PPC Tools, Social Media Tools. It is also available for immediate download and adjustment. So, changes can be made in the color, design, graphics or any other component to create a unique layout.

Strategic Planning Team Responsibilities Checklist Ppt PowerPoint Presentation Diagram Lists PDF
This slide provides glimpse about assigning roles and responsibilities to strategic planning and research team members for better reporting structure. It includes team members such as strategic planning manager, financial analyst, market research analyst, business analyst, etc. The Strategic Planning Team Responsibilities Checklist Ppt PowerPoint Presentation Diagram Lists PDF is a compilation of the most recent design trends as a series of slides. It is suitable for any subject or industry presentation, containing attractive visuals and photo spots for businesses to clearly express their messages. This template contains a variety of slides for the user to input data, such as structures to contrast two elements, bullet points, and slides for written information. Slidegeeks is prepared to create an impression.

IT Checklist Of Merger And Acquisition Integration Designs PDF
This slide highlights the it checklist for merger and acquisition integration illustrating functions, objective and status. The key functions includes transition, department assignment, security access, network infrastructure, technology implementation, process and data transfer, financial integration, operations integration and human resource Presenting IT Checklist Of Merger And Acquisition Integration Designs PDF to dispense important information. This template comprises one stage. It also presents valuable insights into the topics including Department Assignment, Financial Integration, Operation Integration This is a completely customizable PowerPoint theme that can be put to use immediately. So, download it and address the topic impactfully.

Step 4 Checklist For Delivering Product Information Effectively Elements PDF
This slide represents checklist containing key techniques and tactics for building and delivering effective product description. It covers target potential customer, address pain points etc. The Step 4 Checklist For Delivering Product Information Effectively Elements PDF is a compilation of the most recent design trends as a series of slides. It is suitable for any subject or industry presentation, containing attractive visuals and photo spots for businesses to clearly express their messages. This template contains a variety of slides for the user to input data, such as structures to contrast two elements, bullet points, and slides for written information. Slidegeeks is prepared to create an impression.

Toolkit For Data Science And Analytics Transition Key Training Skills For Data Analytics Program Template PDF
This slide highlights multiple skills required for conducting the data analytics project. It includes skills such as python, data mining skills, predictive modeling skills and many more. Coming up with a presentation necessitates that the majority of the effort goes into the content and the message you intend to convey. The visuals of a PowerPoint presentation can only be effective if it supplements and supports the story that is being told. Keeping this in mind our experts created Toolkit For Data Science And Analytics Transition Key Training Skills For Data Analytics Program Template PDF to reduce the time that goes into designing the presentation. This way, you can concentrate on the message while our designers take care of providing you with the right template for the situation.
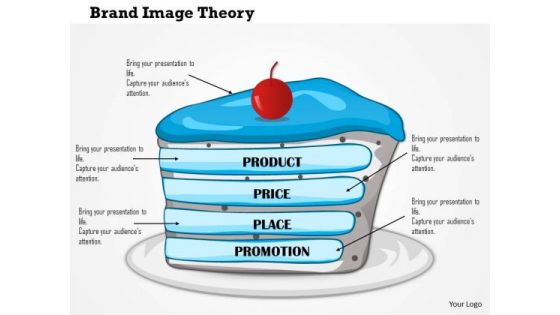
Business Framework Brand Image Theory PowerPoint Presentation
Colored chart graphic with multiple milestones has been used to decorate this Power Point template slide. This PPT slide contains the concept of data prediction. This slide shows big data from descriptive to predictive way. Use this PPT slide for business data analysis related presentation.

 Home
Home