AI PPT Maker
Templates
PPT Bundles
Design Services
Business PPTs
Business Plan
Management
Strategy
Introduction PPT
Roadmap
Self Introduction
Timelines
Process
Marketing
Agenda
Technology
Medical
Startup Business Plan
Cyber Security
Dashboards
SWOT
Proposals
Education
Pitch Deck
Digital Marketing
KPIs
Project Management
Product Management
Artificial Intelligence
Target Market
Communication
Supply Chain
Google Slides
Research Services
 One Pagers
All Categories
-
Home
- Customer Favorites
- Forecast Dashboard
Forecast Dashboard

Data Evaluation And Processing Toolkit Value Stream Data Analytics Process Demonstration PDF
This slide shows the step by step approach of data analytics project focusing on data gathering, consolidation and data analysis to build business insights for effective decision making. Coming up with a presentation necessitates that the majority of the effort goes into the content and the message you intend to convey. The visuals of a PowerPoint presentation can only be effective if it supplements and supports the story that is being told. Keeping this in mind our experts created Data Evaluation And Processing Toolkit Value Stream Data Analytics Process Demonstration PDF to reduce the time that goes into designing the presentation. This way, you can concentrate on the message while our designers take care of providing you with the right template for the situation.
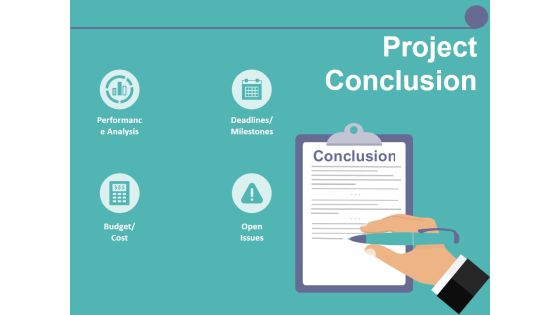
Project Conclusion Ppt PowerPoint Presentation Outline Templates
This is a project conclusion ppt powerpoint presentation outline templates. This is a three stage process. The stages in this process are project name, date, author, project members, actual project assignment, objectives and goals.

Quantitative Survey Data Analysis To Identify Best Channels For Targeting Customers Formats PDF
This slide depicts a bar chart, analyzing survey results of the type of content and channels that best attracts peoples time and attention to help businesses come up with better marketing strategies. It includes key insights, bar graph and different content channels such as videos, emails, social images. Pitch your topic with ease and precision using this Quantitative Survey Data Analysis To Identify Best Channels For Targeting Customers Formats PDF. This layout presents information on Survey Question, Young Customers, Consistent Preference. It is also available for immediate download and adjustment. So, changes can be made in the color, design, graphics or any other component to create a unique layout.
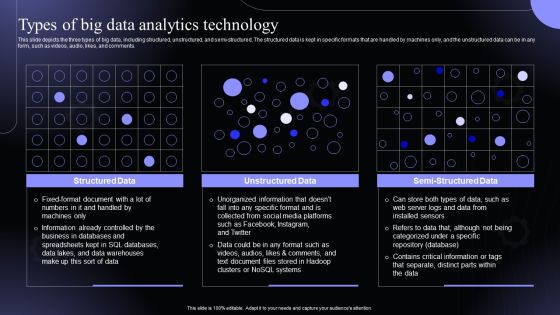
Types Of Big Data Analytics Technology Hyperautomation Software Solutions IT Background PDF
This slide depicts the three types of big data, including structured, unstructured, and semi-structured. The structured data is kept in specific formats that are handled by machines only, and the unstructured data can be in any form, such as videos, audio, likes, and comments.Find highly impressive Types Of Big Data Analytics Technology Hyperautomation Software Solutions IT Background PDF on Slidegeeks to deliver a meaningful presentation. You can save an ample amount of time using these presentation templates. No need to worry to prepare everything from scratch because Slidegeeks experts have already done a huge research and work for you. You need to download Types Of Big Data Analytics Technology Hyperautomation Software Solutions IT Background PDF for your upcoming presentation. All the presentation templates are 100precent editable and you can change the color and personalize the content accordingly. Download now,
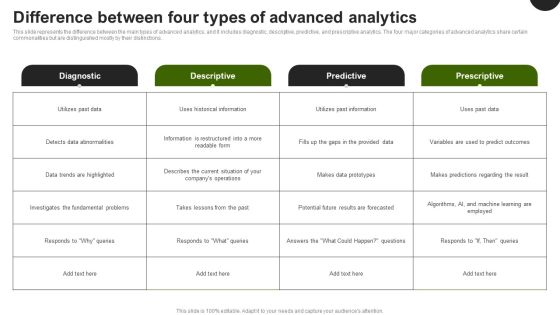
Predictive Analytics In The Age Of Big Data Difference Between Four Types Of Advanced Analytics Summary PDF
This slide represents the difference between the main types of advanced analytics, and it includes diagnostic, descriptive, predictive, and prescriptive analytics. The four major categories of advanced analytics share certain commonalities but are distinguished mostly by their distinctions. There are so many reasons you need a Predictive Analytics In The Age Of Big Data Difference Between Four Types Of Advanced Analytics Summary PDF. The first reason is you cannot spend time making everything from scratch, Thus, Slidegeeks has made presentation templates for you too. You can easily download these templates from our website easily.
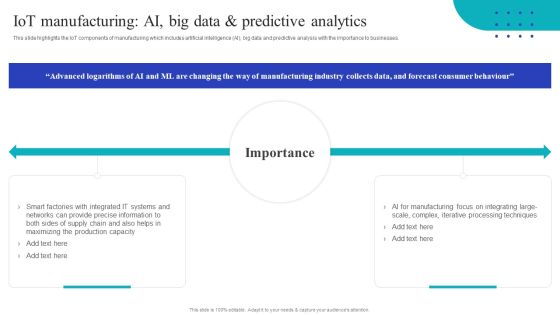
Global Internet Of Things In Manufacturing Iot Manufacturing Ai Big Data And Predictive Guidelines PDF
This slide highlights the IoT components of manufacturing which includes artificial intelligence AI, big data and predictive analysis with the importance to businesses. This modern and well-arranged Global Internet Of Things In Manufacturing Iot Manufacturing Ai Big Data And Predictive Guidelines PDF provides lots of creative possibilities. It is very simple to customize and edit with the Powerpoint Software. Just drag and drop your pictures into the shapes. All facets of this template can be edited with Powerpoint, no extra software is necessary. Add your own material, put your images in the places assigned for them, adjust the colors, and then you can show your slides to the world, with an animated slide included.

Project Updates Ppt PowerPoint Presentation Gallery Templates
This is a project updates ppt powerpoint presentation gallery templates. This is a four stage process. The stages in this process are Major projects bagged, major orders in hand, major projects lost, pipeline orders.

Business Intelligence And Big Key Considerations In Implementing Data Analytics Project Icons PDF
This slide represents the key challenges of identifying and implementing data analytics for the purpose of decision making. It contains considerations like lack of data analysis tools, resource availability etc. Deliver and pitch your topic in the best possible manner with this business intelligence and big key considerations in implementing data analytics project icons pdf. Use them to share invaluable insights on data analytics accessibility, challenges for data analytics implementation, data analytics, application of data analytics and impress your audience. This template can be altered and modified as per your expectations. So, grab it now.
Manager Doing Customer Data Statistical Analysis Icon Ppt PowerPoint Presentation Gallery Format Ideas PDF
Presenting this set of slides with name manager doing customer data statistical analysis icon ppt powerpoint presentation gallery format ideas pdf. This is a three stage process. The stages in this process are manager doing customer data statistical analysis icon. This is a completely editable PowerPoint presentation and is available for immediate download. Download now and impress your audience.

Big Data Statistical Analysis Shown On Laptop Screen Ppt PowerPoint Presentation Inspiration Topics PDF
Presenting this set of slides with name big data statistical analysis shown on laptop screen ppt powerpoint presentation inspiration topics pdf. This is a three stage process. The stages in this process are big data statistical analysis shown on laptop screen. This is a completely editable PowerPoint presentation and is available for immediate download. Download now and impress your audience.

Using Data Science Technologies For Business Transformation Data Science In Healthcare Department Ideas PDF
This slide depicts the role of data science in healthcare departments and its benefits in different ways, such as image analysis, drug discovery, genetics and Genomics, predictive diagnosis, and NLP. Present like a pro with Using Data Science Technologies For Business Transformation Data Science In Healthcare Department Ideas PDF Create beautiful presentations together with your team, using our easy to use presentation slides. Share your ideas in real time and make changes on the fly by downloading our templates. So whether you are in the office, on the go, or in a remote location, you can stay in sync with your team and present your ideas with confidence. With Slidegeeks presentation got a whole lot easier. Grab these presentations today.

Data Collection Form Requirements With Financial Details Ppt PowerPoint Presentation Pictures
This is a data collection form requirements with financial details ppt powerpoint presentation pictures. This is a stage seven process. The stages in this process are form, financial form, data collection, financial details, data analysis.

Key Performance Indicators Highlighting Yearly Business Performance Portrait PDF
This slide includes key components such as website visit, blog traffic, conversion rate, social share, click through rate, etc. which help businesses to measure website performance, number of customer converted and retained to estimate current situation of business. Create an editable Key Performance Indicators Highlighting Yearly Business Performance Portrait PDF that communicates your idea and engages your audience. Whether you are presenting a business or an educational presentation, pre designed presentation templates help save time. Key Performance Indicators Highlighting Yearly Business Performance Portrait PDF is highly customizable and very easy to edit, covering many different styles from creative to business presentations. Slidegeeks has creative team members who have crafted amazing templates. So, go and get them without any delay.

Project Closure Ppt PowerPoint Presentation Pictures Deck
This is a project closure ppt powerpoint presentation pictures deck. This is a three stage process. The stages in this process are project number, objective achievements, results achievements, brief description, prepared by.

AI And ML Driving Monetary Value For Organization AI Based IT Operations Workflow Prediction Inspiration PDF
Following slide covers artificial intelligence-based IT operations workflow. It includes information about data sources, build phase, operational phase and outcomes. Deliver and pitch your topic in the best possible manner with this ai and ml driving monetary value for organization ai based it operations workflow prediction inspiration pdf. Use them to share invaluable insights on data source, infrastructure sensors, outcomes, capacity planning, resource optimization and impress your audience. This template can be altered and modified as per your expectations. So, grab it now.

Information Transformation Process Toolkit Key Considerations In Implementing Data Analytics Project Pictures PDF
This slide represents the key challenges of identifying and implementing data analytics for the purpose of decision making. It contains considerations like lack of data analysis tools, resource availability etc. This is a Information Transformation Process Toolkit Key Considerations In Implementing Data Analytics Project Pictures PDF template with various stages. Focus and dispense information on three stages using this creative set, that comes with editable features. It contains large content boxes to add your information on topics like Data Analytics Implementation, Data Analytics, Application Of Data Analytics. You can also showcase facts, figures, and other relevant content using this PPT layout. Grab it now.

Guidebook For Executing Business Market Intelligence Brief Of Gap Analysis For Data Evaluation Professional PDF
The following slide highlights overview of gap analysis method for data evaluation and identify variance between actual and estimated performance. It also presents various advantages which are profit percentage analysis, process improvement, market opportunities and understand KPIs. Crafting an eye catching presentation has never been more straightforward. Let your presentation shine with this tasteful yet straightforward Guidebook For Executing Business Market Intelligence Brief Of Gap Analysis For Data Evaluation Professional PDF template. It offers a minimalistic and classy look that is great for making a statement. The colors have been employed intelligently to add a bit of playfulness while still remaining professional. Construct the ideal Guidebook For Executing Business Market Intelligence Brief Of Gap Analysis For Data Evaluation Professional PDF that effortlessly grabs the attention of your audience Begin now and be certain to wow your customers.
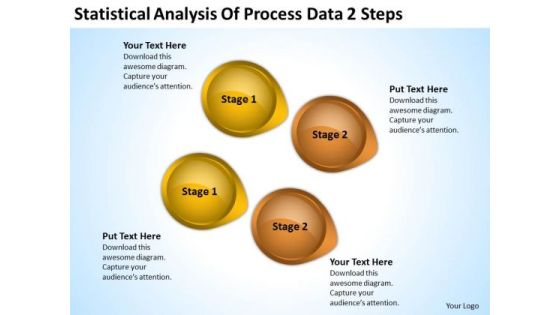
Power Point Arrows Statistical Analysis Of Process Data 2 Steps PowerPoint Templates
We present our power point arrows statistical analysis of process data 2 steps PowerPoint templates.Download and present our Business PowerPoint Templates because It is Aesthetically crafted by artistic young minds. Our PowerPoint Templates and Slides are designed to display your dexterity. Present our Arrows PowerPoint Templates because You can Rise to the occasion with our PowerPoint Templates and Slides. You will bring your audience on their feet in no time. Download and present our Circle Charts PowerPoint Templates because Our PowerPoint Templates and Slides help you pinpoint your timelines. Highlight the reasons for your deadlines with their use. Present our Shapes PowerPoint Templates because You aspire to touch the sky with glory. Let our PowerPoint Templates and Slides provide the fuel for your ascent. Present our Symbol PowerPoint Templates because You have gained great respect for your brilliant ideas. Use our PowerPoint Templates and Slides to strengthen and enhance your reputation.Use these PowerPoint slides for presentations relating to abstract, arrow, art, background, banner, blue, bright, business, circle, color, colorful, concept, conceptual, connection, creative, cycle, design, different, element, empty, flower, form, frame, graphic, green, group, idea, illustration, match, message, order, part, petal, piece, place, red, ring, shape, solution, special, speech, strategy, symbol, template, text, usable, vector, web, website. The prominent colors used in the PowerPoint template are Yellow, Brown, Black. People tell us our power point arrows statistical analysis of process data 2 steps PowerPoint templates will impress their bosses and teams. People tell us our circle PowerPoint templates and PPT Slides are designed by professionals Presenters tell us our power point arrows statistical analysis of process data 2 steps PowerPoint templates are second to none. We assure you our banner PowerPoint templates and PPT Slides will make the presenter successul in his career/life. Presenters tell us our power point arrows statistical analysis of process data 2 steps PowerPoint templates will help you be quick off the draw. Just enter your specific text and see your points hit home. Professionals tell us our background PowerPoint templates and PPT Slides will make the presenter look like a pro even if they are not computer savvy.

Construct Project Feasibility Analysis Report Ppt PowerPoint Presentation Complete Deck With Slides
This Construct Project Feasibility Analysis Report Ppt PowerPoint Presentation Complete Deck With Slides is designed to help you retain your audiences attention. This content ready PowerPoint Template enables you to take your audience on a journey and share information in a way that is easier to recall. It helps you highlight the crucial parts of your work so that the audience does not get saddled with information download. This forty nine slide PPT Deck comes prepared with the graphs and charts you could need to showcase your information through visuals. You only need to enter your own data in them. Download this editable PowerPoint Theme and walk into that meeting with confidence.

Data Analytics Work Streams With Its Roles And Responsibilities Rules PDF
This slide highlights the key responsibilities, data work streams and. and data head roles for constructing data analytics project. Here you can discover an assortment of the finest PowerPoint and Google Slides templates. With these templates, you can create presentations for a variety of purposes while simultaneously providing your audience with an eye catching visual experience. Download Data Analytics Work Streams With Its Roles And Responsibilities Rules PDF to deliver an impeccable presentation. These templates will make your job of preparing presentations much quicker, yet still, maintain a high level of quality. Slidegeeks has experienced researchers who prepare these templates and write high quality content for you. Later on, you can personalize the content by editing the Data Analytics Work Streams With Its Roles And Responsibilities Rules PDF.
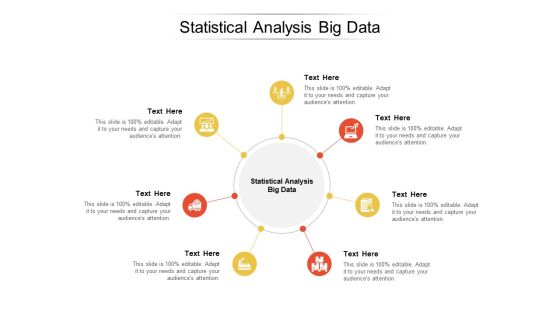
Statistical Analysis Big Data Ppt PowerPoint Presentation Summary Master Slide Cpb
Presenting this set of slides with name statistical analysis big data ppt powerpoint presentation summary master slide cpb. This is an editable Powerpoint seven stages graphic that deals with topics like statistical analysis big data to help convey your message better graphically. This product is a premium product available for immediate download and is 100 percent editable in Powerpoint. Download this now and use it in your presentations to impress your audience.
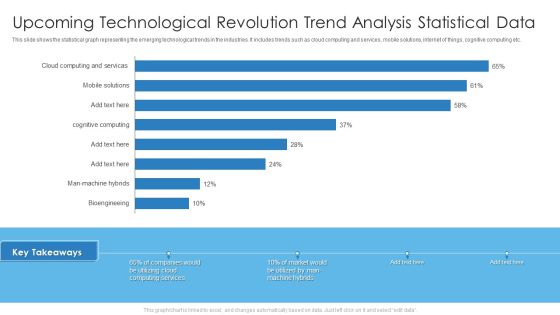
Upcoming Technological Revolution Trend Analysis Statistical Data Professional PDF
This slide shows the statistical graph representing the emerging technological trends in the industries. It includes trends such as cloud computing and services, mobile solutions, internet of things, cognitive computing etc. Deliver an awe inspiring pitch with this creative Upcoming Technological Revolution Trend Analysis Statistical Data Professional PDF bundle. Topics like Upcoming Technological Revolution, Trend Analysis Statistical Data can be discussed with this completely editable template. It is available for immediate download depending on the needs and requirements of the user.

System Analysis And Design Audit Checklist Ppt Layouts Pictures PDF
This slide shows system analysis and designing timeline with key phases. It provides information about gathering requirements, data preparation, analysis, modeling and finalizing project. Presenting System Analysis And Design Audit Checklist Ppt Layouts Pictures PDF to dispense important information. This template comprises one stages. It also presents valuable insights into the topics including JAD And Prototype, Does Database Design, Supports Requirements. This is a completely customizable PowerPoint theme that can be put to use immediately. So, download it and address the topic impactfully.
Problem Assessment Checklist Vector Icon Ppt Powerpoint Presentation Portfolio Example
This is a problem assessment checklist vector icon ppt powerpoint presentation portfolio example. This is a one stage process. The stages in this process are feedback loop icon, evaluation icon, assessment icon.

Business Diagram 3d Venn Diagram For Global Business Project Presentation Template
This business diagram displays 3d Venn diagram. This editable slide is suitable to present business reports. Use this diagram for business and finance related topics and display complete data analysis in your presentation.

Cost Estimate For Execution Of The Strategies Portrait PDF
The slide shows the key Performance Indicator KPI s which will help the company to track the success rate of implemented strategies. Major KPIs include Number of construction projects, Number of construction defect, Total project cost, customer satisfaction level etc.Deliver and pitch your topic in the best possible manner with this cost estimate for execution of the strategies portrait pdf. Use them to share invaluable insights on quality assurance strategy, evaluations of the site strategy, establish quality and impress your audience. This template can be altered and modified as per your expectations. So, grab it now.
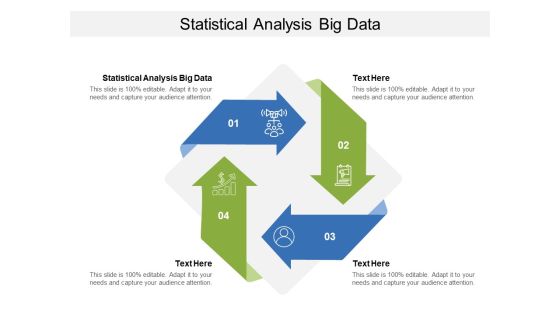
Statistical Analysis Big Data Ppt PowerPoint Presentation Ideas Diagrams Cpb
Presenting this set of slides with name statistical analysis big data ppt powerpoint presentation ideas diagrams cpb. This is an editable Powerpoint four stages graphic that deals with topics like statistical analysis big data to help convey your message better graphically. This product is a premium product available for immediate download and is 100 percent editable in Powerpoint. Download this now and use it in your presentations to impress your audience.

Data Driven Organizational Culture Icon Depicting Statistical Analysis Sample PDF
Persuade your audience using this data driven organizational culture icon depicting statistical analysis sample pdf. This PPT design covers three stages, thus making it a great tool to use. It also caters to a variety of topics including data driven organizational culture icon depicting statistical analysis. Download this PPT design now to present a convincing pitch that not only emphasizes the topic but also showcases your presentation skills.

Three Emerging Workplace Trend Analysis Statistical Data Guidelines PDF
This slide represents the statistical data related to the emerging trends in the workplace environment for organizational employees. It shows the effects of positive workplace environment, reasons for increased interest in remote work and factors attracting the employees. Deliver an awe inspiring pitch with this creative Three Emerging Workplace Trend Analysis Statistical Data Guidelines PDF bundle. Topics like Three Emerging Workplace, Trend Analysis Statistical Data can be discussed with this completely editable template. It is available for immediate download depending on the needs and requirements of the user.
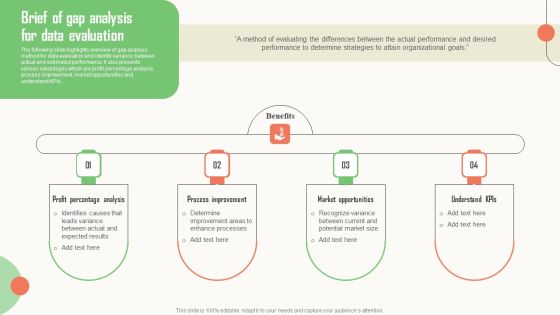
Strategic Market Insight Implementation Guide Brief Of Gap Analysis For Data Evaluation Sample PDF
The following slide highlights overview of gap analysis method for data evaluation and identify variance between actual and estimated performance. It also presents various advantages which are profit percentage analysis, process improvement, market opportunities and understand KPIs. Want to ace your presentation in front of a live audience Our Strategic Market Insight Implementation Guide Brief Of Gap Analysis For Data Evaluation Sample PDF can help you do that by engaging all the users towards you. Slidegeeks experts have put their efforts and expertise into creating these impeccable powerpoint presentations so that you can communicate your ideas clearly. Moreover, all the templates are customizable, and easy to edit and downloadable. Use these for both personal and commercial use.

Information Transformation Process Toolkit Data Analytics Project Plan Lifecycle Designs PDF
This slide shows the data analytics lifecycle covering multiple stages starting from presenting the business case to data identification, data validation, analysis and ending at data visualization and utilization of results. Deliver and pitch your topic in the best possible manner with this Information Transformation Process Toolkit Data Analytics Project Plan Lifecycle Designs PDF. Use them to share invaluable insights on Analyze, Sources, Project Requirement and impress your audience. This template can be altered and modified as per your expectations. So, grab it now.

Bar Graph Icon For Data Analysis Ppt PowerPoint Presentation Pictures Ideas
This is a bar graph icon for data analysis ppt powerpoint presentation pictures ideas. This is a four stage process. The stages in this process are financial analysis, quantitative, statistical modelling.

Key Program Kpis For Project Management Ppt Slides Graphic Images PDF
The following slide highlights the key program metrics for program management illustrating key headings which includes active program, total budget, budget utilized, budget utilization, total program, completed program, overdue program and completion status. Pitch your topic with ease and precision using this Key Program Kpis For Project Management Ppt Slides Graphic Images PDF. This layout presents information on Program Budget, Active Program, Total Budget. It is also available for immediate download and adjustment. So, changes can be made in the color, design, graphics or any other component to create a unique layout.

Force Field Analysis Template 2 Ppt PowerPoint Presentation Themes
This is a force field analysis template 2 ppt powerpoint presentation themes. This is a two stage process. The stages in this process are restraining forces, driving forces, estimated strength, equilibrium.

Sales Kpi Performance Summary Ppt PowerPoint Presentation Infographic Template Elements
This is a sales kpi performance summary ppt powerpoint presentation infographic template elements. This is a seven stage process. The stages in this process are revenue comparison, quantity comparison, product sales mix, regional sales mix, budget.
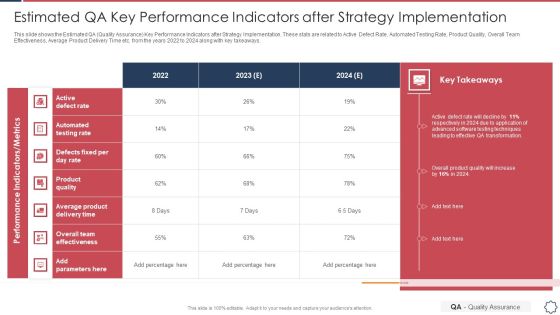
Quality Assurance Transformation Strategies To Improve Business Performance Efficiency Estimated QA Key Performance Topics PDF
This slide shows the Estimated QA Quality Assurance Key Performance Indicators after Strategy Implementation. These stats are related to Active Defect Rate, Automated Testing Rate, Product Quality, Overall Team Effectiveness, Average Product Delivery Time etc. from the years 2022 to 2024 along with key takeaways. Deliver and pitch your topic in the best possible manner with this quality assurance transformation strategies to improve business performance efficiency estimated qa key performance topics pdf. Use them to share invaluable insights on automated testing rate, average product delivery time, active defect rate and impress your audience. This template can be altered and modified as per your expectations. So, grab it now.

Business Case Project Administration Metrics Template PDF
This slide shows value key performance indicators of business case project management . There metrics are productivity . Return on investment , customer satisfaction etc. Showcasing this set of slides titled Business Case Project Administration Metrics Template PDF. The topics addressed in these templates are Productivity, Metrics, Return On Investment. All the content presented in this PPT design is completely editable. Download it and make adjustments in color, background, font etc. as per your unique business setting.
Marketing Budget Gap Report Icon Summary PDF
Presenting Marketing Budget Gap Report Icon Summary PDF to dispense important information. This template comprises Three stages. It also presents valuable insights into the topics including Budget Gap, Report Icon. This is a completely customizable PowerPoint theme that can be put to use immediately. So, download it and address the topic impactfully.
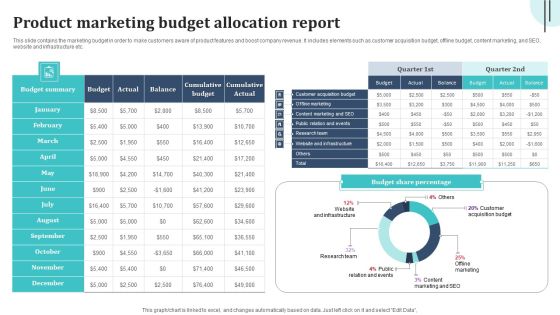
Product Marketing Budget Allocation Report Graphics PDF
This slide contains the marketing budget in order to make customers aware of product features and boost company revenue. It includes elements such as customer acquisition budget, offline budget, content marketing, and SEO, website and infrastructure etc. Pitch your topic with ease and precision using this Product Marketing Budget Allocation Report Graphics PDF. This layout presents information on Cumulative Budget, Offline Marketing, Research Team. It is also available for immediate download and adjustment. So, changes can be made in the color, design, graphics or any other component to create a unique layout.

The Management Scope Diagram Powerpoint Slides
This is a the management scope diagram powerpoint slides. This is a five stage process. The stages in this process are the management scope diagram, project management, program management, process management, portfolio management.

Project Administration Kpis Customer Satisfaction Survey Brochure PDF
Presenting Project Administration Kpis Customer Satisfaction Survey Brochure PDF to provide visual cues and insights. Share and navigate important information on nine stages that need your due attention. This template can be used to pitch topics like Product, Service, Price. In addtion, this PPT design contains high resolution images, graphics, etc, that are easily editable and available for immediate download.

Quantitative Data Analysis Collection Methods To Identify Customer Preferences Topics PDF
This slide depicts multiple methods used for quantitative data analysis collection presented in the form of numbers to be analyzed mathematically and statistically to produce some certain results. It covers major types such as probability sampling, interviews, surveys, document review and observations. Presenting Quantitative Data Analysis Collection Methods To Identify Customer Preferences Topics PDF to dispense important information. This template comprises five stages. It also presents valuable insights into the topics including Document Review, Observations, Probability Sampling, Interviews. This is a completely customizable PowerPoint theme that can be put to use immediately. So, download it and address the topic impactfully.

Key Performance Indicators Construction Company Ppt Model Background Designs PDF
The slide shows the key Performance Indicator KPI s which will help the company to track the success rate of implemented strategies. Major KPIs include Number of construction projects, Number of construction defect, Total project cost, customer satisfaction level etc. Deliver and pitch your topic in the best possible manner with this key performance indicators construction company ppt model background designs pdf. Use them to share invaluable insights on project cost, performance, target and impress your audience. This template can be altered and modified as per your expectations. So, grab it now.

Major Statistics Associated With Ongoing Strategic IT Trends Infographics PDF
This slide provides information regarding statistics associated with ongoing IT trends in terms of market size of digital transformation segment, project contribution of AI, amount of global crime damage, etc. The Major Statistics Associated With Ongoing Strategic IT Trends Infographics PDF is a compilation of the most recent design trends as a series of slides. It is suitable for any subject or industry presentation, containing attractive visuals and photo spots for businesses to clearly express their messages. This template contains a variety of slides for the user to input data, such as structures to contrast two elements, bullet points, and slides for written information. Slidegeeks is prepared to create an impression.
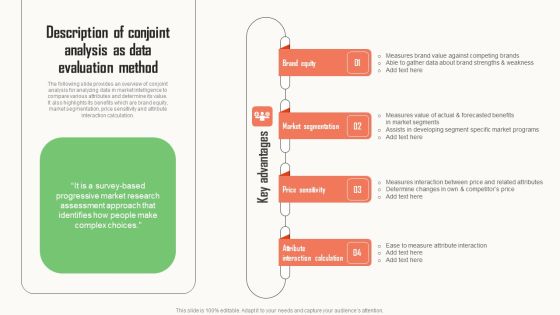
Strategic Market Insight Implementation Guide Description Of Conjoint Analysis As Data Evaluation Method Graphics PDF
The following slide provides an overview of conjoint analysis for analyzing data in market intelligence to compare various attributes and determine its value. It also highlights its benefits which are brand equity, market segmentation, price sensitivity and attribute interaction calculation. Whether you have daily or monthly meetings, a brilliant presentation is necessary. Strategic Market Insight Implementation Guide Description Of Conjoint Analysis As Data Evaluation Method Graphics PDF can be your best option for delivering a presentation. Represent everything in detail using Strategic Market Insight Implementation Guide Description Of Conjoint Analysis As Data Evaluation Method Graphics PDF and make yourself stand out in meetings. The template is versatile and follows a structure that will cater to your requirements. All the templates prepared by Slidegeeks are easy to download and edit. Our research experts have taken care of the corporate themes as well. So, give it a try and see the results.

Media Marketing Data Management Steps Ppt PowerPoint Presentation Guide
This is a media marketing data management steps ppt powerpoint presentation guide. This is a eight stage process. The stages in this process are images and media, database, locations, email, click stream, social network, html, sensors.
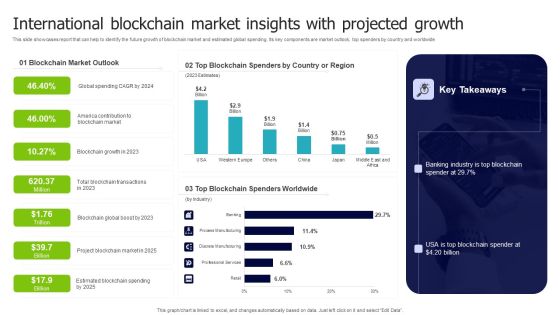
International Blockchain Market Insights With Projected Growth Microsoft PDF
This slide showcases report that can help to identify the future growth of blockchain market and estimated global spending. Its key components are market outlook, top spenders by country and worldwide. Showcasing this set of slides titled International Blockchain Market Insights With Projected Growth Microsoft PDF. The topics addressed in these templates are Blockchain Market Outlook, Blockchain Spenders, Country Region. All the content presented in this PPT design is completely editable. Download it and make adjustments in color, background, font etc. as per your unique business setting.
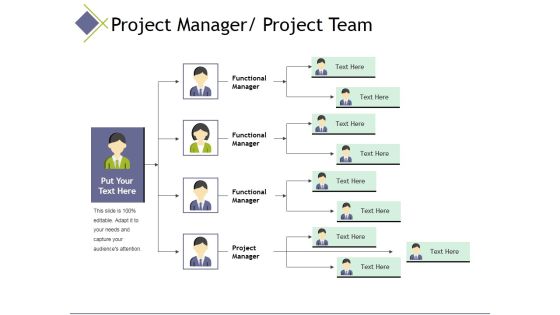
Project Manager Project Team Template 2 Ppt PowerPoint Presentation Styles Graphic Tips
This is a project manager project team template 2 ppt powerpoint presentation styles graphic tips. This is a four stage process. The stages in this process are function, leave of absence, phone, email, name, function.

Customer Behavioral Data And Analytics Customer Lifecycle Statistics Elements PDF
Measure the engagement of a segment of a customers with your brand their last time of purchase and session. Each segment should be targeted differently by the marketing department. Deliver an awe inspiring pitch with this creative customer behavioral data and analytics customer lifecycle statistics elements pdf bundle. Topics like days since last session, days since last purchase, sessions per person, average session length can be discussed with this completely editable template. It is available for immediate download depending on the needs and requirements of the user.
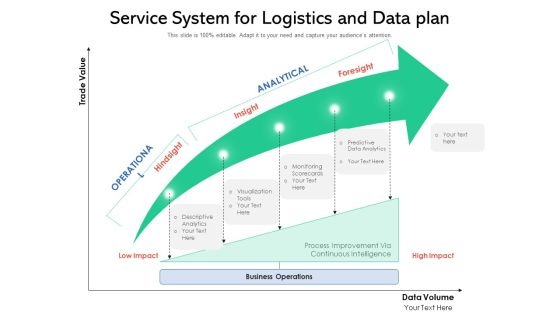
Service System For Logistics And Data Plan Ppt Pictures Graphic Images PDF
Presenting service system for logistics and data plan ppt pictures graphic images pdf to dispense important information. This template comprises one stage. It also presents valuable insights into the topics including business operations, monitoring, predictive data analytics. This is a completely customizable PowerPoint theme that can be put to use immediately. So, download it and address the topic impactfully.

Statistical Analysis Of Parallel Data 7 Stages Fashion Business Plan PowerPoint Slides
We present our statistical analysis of parallel data 7 stages fashion business plan PowerPoint Slides.Download our Communication PowerPoint Templates because there is a key aspect to be emphasised. Present our Business PowerPoint Templates because watch the excitement levels rise as they realise their worth. Download our Arrows PowerPoint Templates because our PowerPoint templates designed for your ideas to sell. Download our Success PowerPoint Templates because your quest has taken you well onto the path of success. Download our Symbol PowerPoint Templates because they will Amplify your basic corporate concept and forefront the benefits of overlapping processes to arrive at common goals.Use these PowerPoint slides for presentations relating to 3d, Achievement, Action, Aim, Arrows, Black, Business, Color, Communication, Competition, Concept, Connection, Creative, Design, Different, Direction, Element, First, Forward, Graph, Graphic, Group, Growth, Higher, Icon, Illustration, Image, Isolated, Leader, Leadership, Line, Menu, Motion, Orange, Progress, Series, Seven, Sign, Slew, Solution, Success, Swerve, Symbol, Team, Teamwork, Turn, Up. The prominent colors used in the PowerPoint template are Blue, Gray, Black. Customers tell us our statistical analysis of parallel data 7 stages fashion business plan PowerPoint Slides are Awesome. Use our Business PowerPoint templates and PPT Slides will get their audience's attention. PowerPoint presentation experts tell us our statistical analysis of parallel data 7 stages fashion business plan PowerPoint Slides are Awesome. People tell us our Aim PowerPoint templates and PPT Slides are Sparkling. We assure you our statistical analysis of parallel data 7 stages fashion business plan PowerPoint Slides are Royal. People tell us our Black PowerPoint templates and PPT Slides are Detailed.
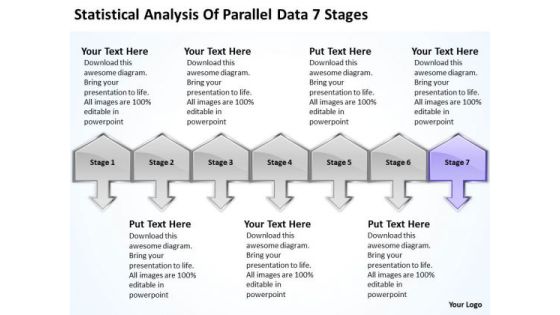
Statistical Analysis Of Parallel Data 7 Stages Ppt Help With Business Plan PowerPoint Slides
We present our statistical analysis of parallel data 7 stages ppt help with business plan PowerPoint Slides.Download and present our Communication PowerPoint Templates because You have gained great respect for your brilliant ideas. Use our PowerPoint Templates and Slides to strengthen and enhance your reputation. Present our Business PowerPoint Templates because you have developed a vision of where you want to be a few years from now. Use our Arrows PowerPoint Templates because this business powerpoint template helps expound on the logic of your detailed thought process to take your company forward. Download our Success PowerPoint Templates because iT outlines the entire thought process for the benefit of others. Tell it to the world with your characteristic aplomb. Use our Symbol PowerPoint Templates because this template helps you to bring your audiences to the table.Use these PowerPoint slides for presentations relating to 3d, Achievement, Action, Aim, Arrows, Black, Business, Color, Communication, Competition, Concept, Connection, Creative, Design, Different, Direction, Element, First, Forward, Graph, Graphic, Group, Growth, Higher, Icon, Illustration, Image, Isolated, Leader, Leadership, Line, Menu, Motion, Orange, Progress, Series, Seven, Sign, Slew, Solution, Success, Swerve, Symbol, Team, Teamwork, Turn, Up. The prominent colors used in the PowerPoint template are Purple, Gray, Black. Customers tell us our statistical analysis of parallel data 7 stages ppt help with business plan PowerPoint Slides will generate and maintain the level of interest you desire. They will create the impression you want to imprint on your audience. Use our Arrows PowerPoint templates and PPT Slides are Magnificent. PowerPoint presentation experts tell us our statistical analysis of parallel data 7 stages ppt help with business plan PowerPoint Slides will help them to explain complicated concepts. People tell us our Action PowerPoint templates and PPT Slides will make the presenter successul in his career/life. We assure you our statistical analysis of parallel data 7 stages ppt help with business plan PowerPoint Slides are Precious. People tell us our Aim PowerPoint templates and PPT Slides are Pleasant.
Magnifying Glass Strategies For Acquiring Consumers With Customer Acquisition Budget Slides PDF
Do you have to make sure that everyone on your team knows about any specific topic I yes, then you should give Magnifying Glass Strategies For Acquiring Consumers With Customer Acquisition Budget Slides PDF a try. Our experts have put a lot of knowledge and effort into creating this impeccable Magnifying Glass Strategies For Acquiring Consumers With Customer Acquisition Budget Slides PDF. You can use this template for your upcoming presentations, as the slides are perfect to represent even the tiniest detail. You can download these templates from the Slidegeeks website and these are easy to edit. So grab these today.

Training Project Handover Procedure Report Designs PDF
The following slide showcases handover report to transfer project details and files to new manager. The report covers project name, handed and taken over by place, date and time. Pitch your topic with ease and precision using this Training Project Handover Procedure Report Designs PDF. This layout presents information on Data Handover, Handover Method, Communication. It is also available for immediate download and adjustment. So, changes can be made in the color, design, graphics or any other component to create a unique layout.
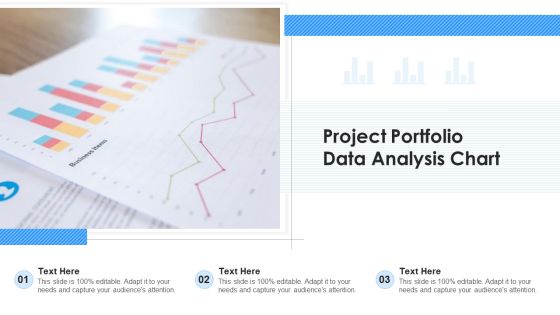
Project Portfolio Data Analysis Chart Ppt Ideas Gallery PDF
Presenting project portfolio data analysis chart ppt ideas gallery pdf to dispense important information. This template comprises three stages. It also presents valuable insights into the topics including project portfolio data analysis chart. This is a completely customizable PowerPoint theme that can be put to use immediately. So, download it and address the topic impactfully.

Project Program Portfolio Management Maturity Model Assessment Checklist Formats PDF
The following slide highlights the project program portfolio management maturity model assessment checklist illustrating facilitated self assessment and diagnostic assessment for activities which are interviews, data analysis, evidence gathering workshops, multiple models, document review, etc. Showcasing this set of slides titled Project Program Portfolio Management Maturity Model Assessment Checklist Formats PDF. The topics addressed in these templates are Document Review, Data Analysis. All the content presented in this PPT design is completely editable. Download it and make adjustments in color, background, font etc. as per your unique business setting.

Statistical Analysis Of Parallel Data 7 Stages Business Planning Guide PowerPoint Slides
We present our statistical analysis of parallel data 7 stages business planning guide PowerPoint Slides.Download our Communication PowerPoint Templates because the mind is always whirring with new ideas. Use our Business PowerPoint Templates because watch the excitement levels rise as they realise their worth. Download our Arrows PowerPoint Templates because you know Coincidentally it will always point to the top. Use our Success PowerPoint Templates because they represent the proress in our lives. Use our Symbol PowerPoint Templates because with the help of our Slides you can Illustrate how each element flows seamlessly onto the next stage.Use these PowerPoint slides for presentations relating to 3d, Achievement, Action, Aim, Arrows, Black, Business, Color, Communication, Competition, Concept, Connection, Creative, Design, Different, Direction, Element, First, Forward, Graph, Graphic, Group, Growth, Higher, Icon, Illustration, Image, Isolated, Leader, Leadership, Line, Menu, Motion, Orange, Progress, Series, Seven, Sign, Slew, Solution, Success, Swerve, Symbol, Team, Teamwork, Turn, Up. The prominent colors used in the PowerPoint template are Pink, Gray, Black. Customers tell us our statistical analysis of parallel data 7 stages business planning guide PowerPoint Slides are Graceful. Use our Black PowerPoint templates and PPT Slides are Attractive. PowerPoint presentation experts tell us our statistical analysis of parallel data 7 stages business planning guide PowerPoint Slides are Nice. People tell us our Business PowerPoint templates and PPT Slides are Glamorous. We assure you our statistical analysis of parallel data 7 stages business planning guide PowerPoint Slides are Flirty. People tell us our Color PowerPoint templates and PPT Slides are Great.
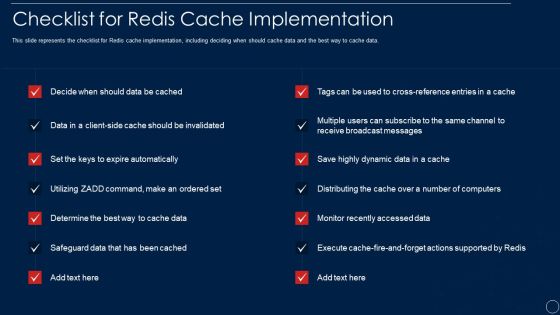
Redis Cache Data Structure IT Checklist For Redis Cache Implementation Pictures PDF
This slide represents the checklist for Redis cache implementation, including deciding when should cache data and the best way to cache data. Deliver an awe inspiring pitch with this creative redis cache data structure it checklist for redis cache implementation pictures pdf bundle. Topics like checklist for redis cache implementation can be discussed with this completely editable template. It is available for immediate download depending on the needs and requirements of the user.

Executive Information Database System Checklist To Implement Data Warehouse In Company Formats PDF
This slide describes the checklist to implement a data warehouse in the company, including strategies to assess data, organization of data, tools to manage data, and so on.Deliver an awe inspiring pitch with this creative Executive Information Database System Checklist To Implement Data Warehouse In Company Formats PDF bundle. Topics like Strategy To Assess, Correctness Integrity, Possible Extracting can be discussed with this completely editable template. It is available for immediate download depending on the needs and requirements of the user.

Toolkit For Data Science And Analytics Transition Priority Checklist For Data Analytics Program Sample PDF
The slide displays the to do list that allows to set the high priority task at first and Least priority at last to ensure consistency and completeness while performing the process. This Toolkit For Data Science And Analytics Transition Priority Checklist For Data Analytics Program Sample PDF is perfect for any presentation, be it in front of clients or colleagues. It is a versatile and stylish solution for organizing your meetings. The Toolkit For Data Science And Analytics Transition Priority Checklist For Data Analytics Program Sample PDF features a modern design for your presentation meetings. The adjustable and customizable slides provide unlimited possibilities for acing up your presentation. Slidegeeks has done all the homework before launching the product for you. So, do not wait, grab the presentation templates today.

Income Assessment Report Interpretation Of Survey Contd Portrait PDF
This slide translates the interpretation of conducting salary survey. It represents the data showing salary raise in previous year, percentage increase in salary, and bonus receive in past year.Deliver and pitch your topic in the best possible manner with this Income Assessment Report Interpretation Of Survey Contd Portrait PDF. Use them to share invaluable insights on Increment Criteria, Projected Increment, Middle Management and impress your audience. This template can be altered and modified as per your expectations. So, grab it now.

Transformation Toolkit Competitive Intelligence Information Analysis RACI Matrix For Analyzing Data In Project Demonstration PDF
The slide explains the RACI matrix with the roles on vertical axis and tasks on horizontal axis for executing data analytics project. This Transformation Toolkit Competitive Intelligence Information Analysis RACI Matrix For Analyzing Data In Project Demonstration PDF from Slidegeeks makes it easy to present information on your topic with precision. It provides customization options, so you can make changes to the colors, design, graphics, or any other component to create a unique layout. It is also available for immediate download, so you can begin using it right away. Slidegeeks has done good research to ensure that you have everything you need to make your presentation stand out. Make a name out there for a brilliant performance.

Problem Related To Inefficiency Of Consultancy Company Ppt Professional Layouts PDF
This slide shows various problems related to inefficiency of consultancy company services which includes cybersecurity, changing client behavior, new competition, project complexity etc. Presenting problem related to inefficiency of consultancy company ppt professional layouts pdf to provide visual cues and insights. Share and navigate important information on five stages that need your due attention. This template can be used to pitch topics like changing client behavior, cybersecurity, project complexity, new competition. In addition, this PPT design contains high-resolution images, graphics, etc, that are easily editable and available for immediate download.

Project Management Integration Icon Depicting Data Analysis Ppt Inspiration Elements PDF
Presenting Project Management Integration Icon Depicting Data Analysis Ppt Inspiration Elements PDF to dispense important information. This template comprises three stages. It also presents valuable insights into the topics including Project Management, Integration Icon, Depicting Data Analysis. This is a completely customizable PowerPoint theme that can be put to use immediately. So, download it and address the topic impactfully.

Strategic Market Insight Implementation Guide Data Evaluation With Maxdiff Analysis Method Professional PDF
This slide outlines data collection and evaluation with MaxDiff analysis technique to gauge survey respondents preference score for different attributes. It highlights a survey form to analysis smartphone features preference, responses received and survey analysis. Do you have an important presentation coming up Are you looking for something that will make your presentation stand out from the rest Look no further than Strategic Market Insight Implementation Guide Data Evaluation With Maxdiff Analysis Method Professional PDF. With our professional designs, you can trust that your presentation will pop and make delivering it a smooth process. And with Slidegeeks, you can trust that your presentation will be unique and memorable. So why wait Grab Strategic Market Insight Implementation Guide Data Evaluation With Maxdiff Analysis Method Professional PDF today and make your presentation stand out from the rest.
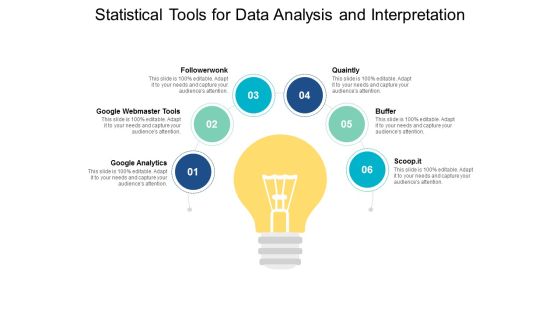
Statistical Tools For Data Analysis And Interpretation Ppt PowerPoint Presentation Portfolio Visuals
Presenting this set of slides with name Statistical Tools For Data Analysis And Interpretation Ppt PowerPoint Presentation Portfolio Visuals. This is a six process. The stages in this process are marketing, management, measuring results. This is a completely editable PowerPoint presentation and is available for immediate download. Download now and impress your audience.

Internal And External Data Sources Framework Sample PDF
This slide shows the framework represented the sources and format of data sources. It includes details related to data formats such as structured and unstructured data and sources of data such as internal and external data. Persuade your audience using this Internal And External Data Sources Framework Sample PDF. This PPT design covers Four stages, thus making it a great tool to use. It also caters to a variety of topics including Survey Ratings, Audio Transcripts, Reviews Of Employees. Download this PPT design now to present a convincing pitch that not only emphasizes the topic but also showcases your presentation skills.

Operation Of Artificial Intelligence And Internet Of Things In Fintech Business Ppt PowerPoint Presentation Infographic Template Example File
Pitch your topic with ease and precision using this operation of artificial intelligence and internet of things in fintech business ppt powerpoint presentation infographic template example file. This layout presents information on ai based reporting and analysis, transaction data enrichment, predictive analytics. It is also available for immediate download and adjustment. So, changes can be made in the color, design, graphics or any other component to create a unique layout.

Batch Processing System With Various Data Sources Icons PDF
Mentioned slide highlights batch processing system used for automating various transactions as a single group. It provides information about data sources such as magazines, surveys, interviews, observations, etc. Showcasing this set of slides titled Batch Processing System With Various Data Sources Icons PDF. The topics addressed in these templates are Surveys, Data Sources, Magazines. All the content presented in this PPT design is completely editable. Download it and make adjustments in color, background, font etc. as per your unique business setting.
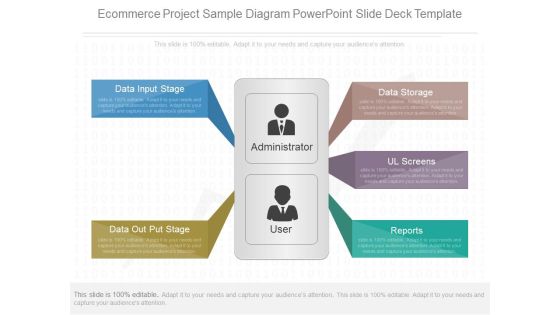
Ecommerce Project Sample Diagram Powerpoint Slide Deck Template
This is a ecommerce project sample diagram powerpoint slide deck template. This is a five stage process. The stages in this process are data input stage, data out put stage, data storage, ul screens, reports.
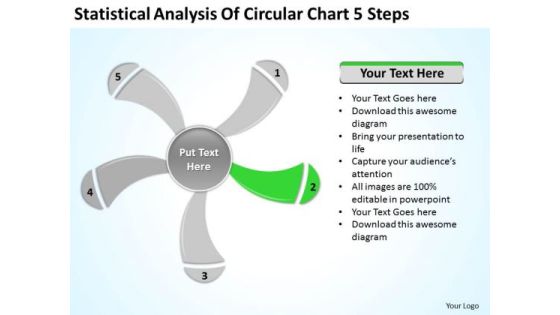
Statistical Analysis Of Circular Chart 5 Steps Ppt Business Plan PowerPoint Slide
We present our statistical analysis of circular chart 5 steps ppt business plan PowerPoint Slide.Download and present our Business PowerPoint Templates because Our PowerPoint Templates and Slides will definately Enhance the stature of your presentation. Adorn the beauty of your thoughts with their colourful backgrounds. Use our Signs PowerPoint Templates because Our PowerPoint Templates and Slides will give good value for money. They also have respect for the value of your time. Download our Shapes PowerPoint Templates because Our PowerPoint Templates and Slides team portray an attitude of elegance. Personify this quality by using them regularly. Use our Metaphors-Visual Concepts PowerPoint Templates because Our PowerPoint Templates and Slides will effectively help you save your valuable time. They are readymade to fit into any presentation structure. Use our Process and Flows PowerPoint Templates because our PowerPoint Templates and Slides are the string of your bow. Fire of your ideas and conquer the podium.Use these PowerPoint slides for presentations relating to graphically, graphic, vector, layout, business, computation, sign, infochart, visual, symbol, template, diagram, calculations, sector, data, revenue, schedule, element, analysis, drawing, report, technology, contour, classification, graph, modern, illustration, icon, comparison, object, chart, collection, science, color, growth, composition, professional, set, education, math, profits, information, symmetry, statistic, structure, infographics, button. The prominent colors used in the PowerPoint template are Green, Gray, White.

Statistical Analysis Of Circular Chart 5 Steps Ppt Business Plan PowerPoint Slides
We present our statistical analysis of circular chart 5 steps ppt business plan PowerPoint Slides.Download and present our Business PowerPoint Templates because Timeline crunches are a fact of life. Meet all deadlines using our PowerPoint Templates and Slides. Present our Signs PowerPoint Templates because You can Zap them with our PowerPoint Templates and Slides. See them reel under the impact. Use our Shapes PowerPoint Templates because It can Bubble and burst with your ideas. Download our Metaphors-Visual Concepts PowerPoint Templates because You can Create a matrix with our PowerPoint Templates and Slides. Feel the strength of your ideas click into place. Present our Process and Flows PowerPoint Templates because Our PowerPoint Templates and Slides has conjured up a web of all you need with the help of our great team. Use them to string together your glistening ideas.Use these PowerPoint slides for presentations relating to graphically, graphic, vector, layout, business, computation, sign, infochart, visual, symbol, template, diagram, calculations, sector, data, revenue, schedule, element, analysis, drawing, report, technology, contour, classification, graph, modern, illustration, icon, comparison, object, chart, collection, science, color, growth, composition, professional, set, education, math, profits, information, symmetry, statistic, structure, infographics, button. The prominent colors used in the PowerPoint template are Yellow, Gray, White.

Guidebook For Executing Business Market Intelligence Description Of Conjoint Analysis As Data Professional PDF
The following slide provides an overview of conjoint analysis for analyzing data in market intelligence to compare various attributes and determine its value. It also highlights its benefits which are brand equity, market segmentation, price sensitivity and attribute interaction calculation. Create an editable Guidebook For Executing Business Market Intelligence Description Of Conjoint Analysis As Data Professional PDF that communicates your idea and engages your audience. Whether you are presenting a business or an educational presentation, pre designed presentation templates help save time. Guidebook For Executing Business Market Intelligence Description Of Conjoint Analysis As Data Professional PDF is highly customizable and very easy to edit, covering many different styles from creative to business presentations. Slidegeeks has creative team members who have crafted amazing templates. So, go and get them without any delay.

Big Data Architect Workflow Of Big Data Management Guidelines PDF
This slide defines the workflow of big data, including data sources, data management, modeling, result analysis, visualization, and user interaction.Deliver an awe inspiring pitch with this creative Big Data Architect Workflow Of Big Data Management Guidelines PDF bundle. Topics like Data Management, Preprocessing, Model Estimation can be discussed with this completely editable template. It is available for immediate download depending on the needs and requirements of the user.

Multi Stage Quantitative Data Analysis Collection And Analysis Process Rules PDF
This slide provides a multi stage process outlining techniques and tools needed for executing an successful quantitative analysis. It covers stages such as data collection methods, research questions or hypothesis created, software, statistical tools, output and interpretations. Persuade your audience using this Multi Stage Quantitative Data Analysis Collection And Analysis Process Rules PDF. This PPT design covers five stages, thus making it a great tool to use. It also caters to a variety of topics including Data Collection Methods, Software, Statistical Tools, Output And Interpretations. Download this PPT design now to present a convincing pitch that not only emphasizes the topic but also showcases your presentation skills.

Data Analytics In Business Sector Ppt Show Smartart PDF
This slide represents the data science application in business and its benefits, such as gaining customer insights, increased security, streamlining manufacturing, and predicting future market trends. This is a data analytics in business sector ppt show smartart pdf template with various stages. Focus and dispense information on five stages using this creative set, that comes with editable features. It contains large content boxes to add your information on topics like demographic, target, business services, management, financial. You can also showcase facts, figures, and other relevant content using this PPT layout. Grab it now.

Profit Report Image With Pen And Calculator Ppt PowerPoint Presentation Gallery Styles PDF
Presenting profit report image with pen and calculator ppt powerpoint presentation gallery styles pdf to dispense important information. This template comprises three stages. It also presents valuable insights into the topics including profit report image with pen and calculator. This is a completely customizable PowerPoint theme that can be put to use immediately. So, download it and address the topic impactfully.

Work Breakdown Structure Ppt PowerPoint Presentation Slides
This is a work breakdown structure ppt powerpoint presentation slides. This is a five stage process. The stages in this process are project management, scope narrative, deliverable structure, flow diagram, schedule, budget.
Statistical Assessment Business Graph With Magnifying Glass Vector Icon Ppt Powerpoint Presentation Styles
This is a statistical assessment business graph with magnifying glass vector icon ppt powerpoint presentation styles. This is a one stage process. The stages in this process are feedback loop icon, evaluation icon, assessment icon.

Data Project Analysis Lifecycle To Streamline Operations Diagrams PDF
This slide covers data project analysis lifecycle to streamline operations. It involves six steps such as business understanding, data understanding, data preparation, data analysis, validation and visualization.Persuade your audience using this Data Project Analysis Lifecycle To Streamline Operations Diagrams PDF. This PPT design covers six stages, thus making it a great tool to use. It also caters to a variety of topics including Business Understanding, Data Understanding, Data Preparation. Download this PPT design now to present a convincing pitch that not only emphasizes the topic but also showcases your presentation skills.

Email Survey Service Diagram Ppt Slide Design
This is a email survey service diagram ppt slide design. This is a four stage process. The stages in this process are design, administration, data collection, report and analysis.

Market Data Integration Project Ppt Slides Styles
This is a market data integration project ppt slides styles. This is a four stage process. The stages in this process are market data integration project, technical proof of concept, hardware installed, contract negotiation.
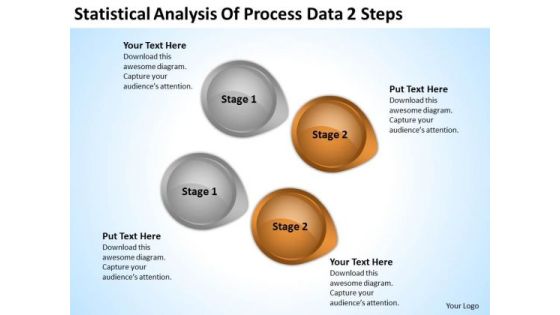
Arrow In PowerPoint Statistical Analysis Of Process Data 2 Steps Ppt Slide
We present our arrow in powerpoint statistical analysis of process data 2 steps ppt Slide.Download our Business PowerPoint Templates because Our PowerPoint Templates and Slides will weave a web of your great ideas. They are gauranteed to attract even the most critical of your colleagues. Use our Circle Charts PowerPoint Templates because Our PowerPoint Templates and Slides will let your words and thoughts hit bullseye everytime. Download our Arrows PowerPoint Templates because Our PowerPoint Templates and Slides will let you Hit the right notes. Watch your audience start singing to your tune. Download and present our Shapes PowerPoint Templates because You have the co-ordinates for your destination of success. Let our PowerPoint Templates and Slides map out your journey. Download and present our Signs PowerPoint Templates because It will let you Set new benchmarks with our PowerPoint Templates and Slides. They will keep your prospects well above par.Use these PowerPoint slides for presentations relating to 3d, abstract, analysis, arrow, background, business, button, chart, circle, circular, color, concept, conservation, cycle, development, diagram, direction, eco, ecology, energy, environment, flow, flowchart, globe, graphic, growing, growth, icon, internet, isolated, object, power, process, protection, recyclable, recycle, recycling, render, resource, saving, sign, solution, sphere, statistic, sustainable, symbol, technology, white. The prominent colors used in the PowerPoint template are Brown, Gray, Black. You can be sure our arrow in powerpoint statistical analysis of process data 2 steps ppt Slide are designed by professionals People tell us our button PowerPoint templates and PPT Slides will make the presenter look like a pro even if they are not computer savvy. You can be sure our arrow in powerpoint statistical analysis of process data 2 steps ppt Slide are designed by professionals Use our arrow PowerPoint templates and PPT Slides have awesome images to get your point across. Presenters tell us our arrow in powerpoint statistical analysis of process data 2 steps ppt Slide will make the presenter successul in his career/life. We assure you our arrow PowerPoint templates and PPT Slides are visually appealing.

Overview Of BI For Enhanced Decision Making Business Intelligence Statistical Data Analysis Guidelines PDF
This slide covers the key insights related to statistical analysis of business intelligence market. It includes details related to best BI vendors in the worlds, top IAAS platforms preferred by BI vendors etc. There are so many reasons you need a Overview Of BI For Enhanced Decision Making Business Intelligence Statistical Data Analysis Guidelines PDF. The first reason is you cannot spend time making everything from scratch, Thus, Slidegeeks has made presentation templates for you too. You can easily download these templates from our website easily.

Key Metrics To Measure Success Of Website Marketing Elements PDF
The following slide outlines major metrics through which real estate companies can evaluate website performance. The key performance indicators KPIs highlighted in slide are total visitors, bounce rate, session duration, page views, customer conversion rate, etc. If your project calls for a presentation, then Slidegeeks is your go-to partner because we have professionally designed, easy-to-edit templates that are perfect for any presentation. After downloading, you can easily edit Key Metrics To Measure Success Of Website Marketing Elements PDF and make the changes accordingly. You can rearrange slides or fill them with different images. Check out all the handy templates

Business Intelligence And Mini Charter For Data Analytics Project With Metrics Professional PDF
This slide shows the formal document that describes the scope of business analytics project covering its goals, key metrics, resources, teams and milestones etc. Deliver an awe inspiring pitch with this creative business intelligence and mini charter for data analytics project with metrics professional pdf bundle. Topics like project overview, project team, project information, goal statement can be discussed with this completely editable template. It is available for immediate download depending on the needs and requirements of the user.

Brand Launch Checklist Marketing Channels With Kpis To Be Tracked Slides PDF
This template covers brand launch success tracking key performance indicators such as Engagement Likes, Comments, and Share, Followers growth, Story metrices Story Replies, Story Tap back and Forward, Story Impression etc. Welcome to our selection of the Brand Launch Checklist Marketing Channels With Kpis To Be Tracked Slides PDF. These are designed to help you showcase your creativity and bring your sphere to life. Planning and Innovation are essential for any business that is just starting out. This collection contains the designs that you need for your everyday presentations. All of our PowerPoints are 100 percent editable, so you can customize them to suit your needs. This multi-purpose template can be used in various situations. Grab these presentation templates today.

Data Evaluation And Processing Toolkit Mini Charter For Data Analytics Project With Metrics Brochure PDF
This slide shows the formal document that describes the scope of business analytics project covering its goals, key metrics, resources, teams and milestones etc. Get a simple yet stunning designed Data Evaluation And Processing Toolkit Mini Charter For Data Analytics Project With Metrics Brochure PDF. It is the best one to establish the tone in your meetings. It is an excellent way to make your presentations highly effective. So, download this PPT today from Slidegeeks and see the positive impacts. Our easy-to-edit Data Evaluation And Processing Toolkit Mini Charter For Data Analytics Project With Metrics Brochure PDF can be your go-to option for all upcoming conferences and meetings. So, what are you waiting for Grab this template today.
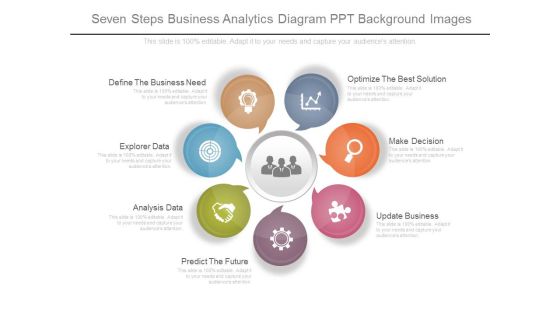
Seven Steps Business Analytics Diagram Ppt Background Images
This is a seven steps business analytics diagram ppt background images. This is a seven stage process. The stages in this process are optimize the best solution, make decision, update business, predict the future, analysis data, explorer data, define the business need.

Person Making Calculations On Financial Report Ppt PowerPoint Presentation Model Introduction PDF
Persuade your audience using this person making calculations on financial report ppt powerpoint presentation model introduction pdf. This PPT design covers three stages, thus making it a great tool to use. It also caters to a variety of topics including person making calculations on financial report. Download this PPT design now to present a convincing pitch that not only emphasizes the topic but also showcases your presentation skills.

Expenses Report Analysis With Calculator And Pen Ppt PowerPoint Presentation Show Designs Download PDF
Persuade your audience using this expenses report analysis with calculator and pen ppt powerpoint presentation show designs download pdf. This PPT design covers three stages, thus making it a great tool to use. It also caters to a variety of topics including expenses report analysis with calculator and pen. Download this PPT design now to present a convincing pitch that not only emphasizes the topic but also showcases your presentation skills.

Project Context For Financial Services Data Analysis Ppt PowerPoint Presentation Professional Guidelines
Presenting this set of slides with name project context for financial services data analysis ppt powerpoint presentation professional guidelines. This is a two stage process. The stages in this process are agenda, target audiences, preferred by many, values client, strategy. This is a completely editable PowerPoint presentation and is available for immediate download. Download now and impress your audience.
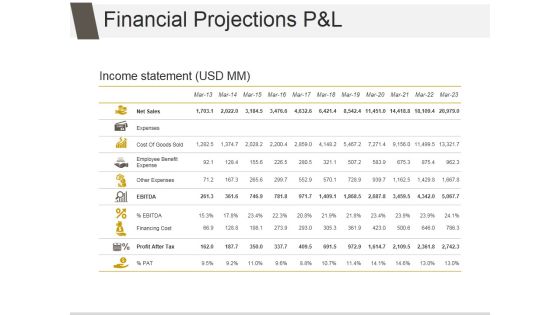
Financial Projections P And L Ppt PowerPoint Presentation Design Ideas
This is a financial projections p and l ppt powerpoint presentation design ideas. This is a eleven stage process. The stages in this process are net sales, expenses, cost of goods sold, employee benefit expense, other expenses, financing cost.

Data Service Analytics Diagram Ppt Inspiration
This is a data service analytics diagram ppt inspiration. This is a eight stage process. The stages in this process are traffic demand estimation, policy control analytics, data processing, device analytics, service quality analytics, charging verification, productivity, statistical research.

Data Analytics In Portfolio Management Powerpoint Templates
This is a data analytics in portfolio management powerpoint templates. This is a five stage process. The stages in this process are decision management, valuation, risk management, project finance, investment portfolio.

Material Contract Checklist Ppt PowerPoint Presentation Outline Format Ideas
This is a material contract checklist ppt powerpoint presentation outline format ideas. This is a three stage process. The stages in this process are checklist, table, planning, cost, management.

Comprehensive Analysis Of Different Data Lineage Classification Future Of Data Lineage Technology Ideas PDF
This slide represents the future of data lineage technology, including the data engineering transformation from DevOps to DataOps, case-driven data lineage tools to help data engineers meet data governance challenges, and so on. Are you searching for a Comprehensive Analysis Of Different Data Lineage Classification Future Of Data Lineage Technology Ideas PDF that is uncluttered, straightforward, and original Its easy to edit, and you can change the colors to suit your personal or business branding. For a presentation that expresses how much effort you have put in, this template is ideal With all of its features, including tables, diagrams, statistics, and lists, its perfect for a business plan presentation. Make your ideas more appealing with these professional slides. Download Comprehensive Analysis Of Different Data Lineage Classification Future Of Data Lineage Technology Ideas PDF from Slidegeeks today.

Comprehensive Analysis Of Different Data Lineage Classification Roadmap Implementing Data Lineage Designs PDF
This slide depicts the roadmap for implementing data lineage in the company, including the steps to be followed, such as obtaining approval from senior management, determining primary business goals, making a list of data lineage project needs, choosing a data lineage documentation method, and so on. Slidegeeks is here to make your presentations a breeze with Comprehensive Analysis Of Different Data Lineage Classification Roadmap Implementing Data Lineage Designs PDF With our easy to use and customizable templates, you can focus on delivering your ideas rather than worrying about formatting. With a variety of designs to choose from, you are sure to find one that suits your needs. And with animations and unique photos, illustrations, and fonts, you can make your presentation pop. So whether you are giving a sales pitch or presenting to the board, make sure to check out Slidegeeks first
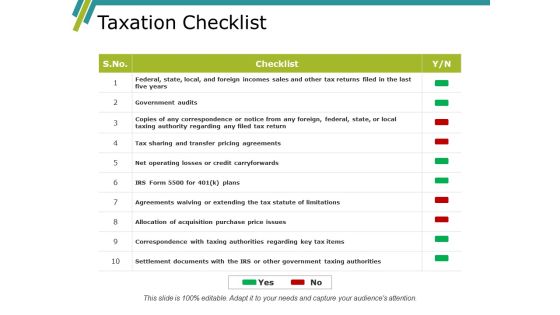
Taxation Checklist Ppt PowerPoint Presentation Inspiration Graphics Example
This is a taxation checklist ppt powerpoint presentation inspiration graphics example. This is a ten stage process. The stages in this process are tax, table, revenue, management, planning.

Collecting Identity Data For Personalized Marketing Ppt Professional Elements PDF
This slide showcases identity data that can be collected to formulate personalized marketing campaign. It also shows ways to collect data from different sources. Are you searching for a Collecting Identity Data For Personalized Marketing Ppt Professional Elements PDF that is uncluttered, straightforward, and original Its easy to edit, and you can change the colors to suit your personal or business branding. For a presentation that expresses how much effort you have put in, this template is ideal With all of its features, including tables, diagrams, statistics, and lists, its perfect for a business plan presentation. Make your ideas more appealing with these professional slides. Download Collecting Identity Data For Personalized Marketing Ppt Professional Elements PDF from Slidegeeks today.

Current Key Account Management Performance Indicators Pictures PDF
The following slide provides information about the current key account management KPIs of the company which are shown in the form of graphs and for the past 5 years. The KPIs are key account satisfaction rate, key account interaction rate, key account churn rate and key account upsell rate. Are you in need of a template that can accommodate all of your creative concepts This one is crafted professionally and can be altered to fit any style. Use it with Google Slides or PowerPoint. Include striking photographs, symbols, depictions, and other visuals. Fill, move around, or remove text boxes as desired. Test out color palettes and font mixtures. Edit and save your work, or work with colleagues. Download Current Key Account Management Performance Indicators Pictures PDF and observe how to make your presentation outstanding. Give an impeccable presentation to your group and make your presentation unforgettable.
IT Robotic Process Automation Software Analysis Checklist Icon Themes PDF
This slide outlines robotic process automation business cases aimed at making supply chain processes more efficient by utilizing technological elements. It covers three cases integrated data transmission, order management with returns and after sales handling Presenting IT Robotic Process Automation Software Analysis Checklist Icon Themes PDF to dispense important information. This template comprises three stages. It also presents valuable insights into the topics including Integrated Data Transmission, Order Management, Returns After Sales Handling . This is a completely customizable PowerPoint theme that can be put to use immediately. So, download it and address the topic impactfully.
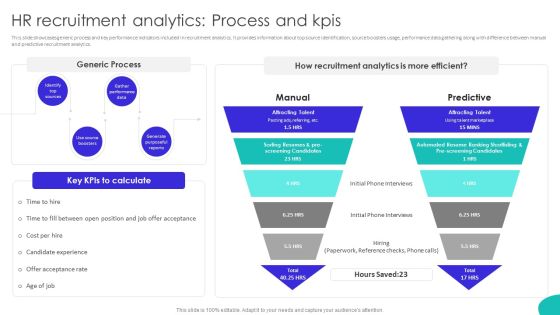
Improving Technology Based HR Recruitment Analytics Process And Kpis Designs PDF
This slide showcases generic process and key performance indicators included in recruitment analytics. It provides information about top source identification, source boosters usage, performance data gathering along with difference between manual and predictive recruitment analytics. Are you in need of a template that can accommodate all of your creative concepts This one is crafted professionally and can be altered to fit any style. Use it with Google Slides or PowerPoint. Include striking photographs, symbols, depictions, and other visuals. Fill, move around, or remove text boxes as desired. Test out color palettes and font mixtures. Edit and save your work, or work with colleagues. Download Improving Technology Based HR Recruitment Analytics Process And Kpis Designs PDF and observe how to make your presentation outstanding. Give an impeccable presentation to your group and make your presentation unforgettable.

Data Lake Architecture Future Of Data Analysis How To Avoid Data Swamp In A Data Lake Sample PDF
This slide depicts how to avoid a data swamp in a data lake by defining the checklist of questions to consider while establishing a data lake in the organization. Deliver and pitch your topic in the best possible manner with this Data Lake Architecture Future Of Data Analysis How To Avoid Data Swamp In A Data Lake Sample PDF. Use them to share invaluable insights on Person Established, Private Information, Privacy Governance and impress your audience. This template can be altered and modified as per your expectations. So, grab it now.

Data Driven Marketing Campaign Budget Plan Demonstration PDF
This slide represents the budget prepared to predict cash flows and allocate required resources for deploying data driven marketing strategy in enterprise. It includes parameters such as data driven marketing tool, license fees etc. Want to ace your presentation in front of a live audience Our Data Driven Marketing Campaign Budget Plan Demonstration PDF can help you do that by engaging all the users towards you. Slidegeeks experts have put their efforts and expertise into creating these impeccable powerpoint presentations so that you can communicate your ideas clearly. Moreover, all the templates are customizable, and easy-to-edit and downloadable. Use these for both personal and commercial use.

CRM Administration To Reduce Churn Rate Different Ways To Collect Customer Data Demonstration PDF
This slide shows the different ways to collect customer data which covers web tracking, transactional data, surveys and marketing analytics to understand customer behavior, activities, etc. Want to ace your presentation in front of a live audience Our CRM Administration To Reduce Churn Rate Different Ways To Collect Customer Data Demonstration PDF can help you do that by engaging all the users towards you. Slidegeeks experts have put their efforts and expertise into creating these impeccable powerpoint presentations so that you can communicate your ideas clearly. Moreover, all the templates are customizable, and easy to edit and downloadable. Use these for both personal and commercial use.
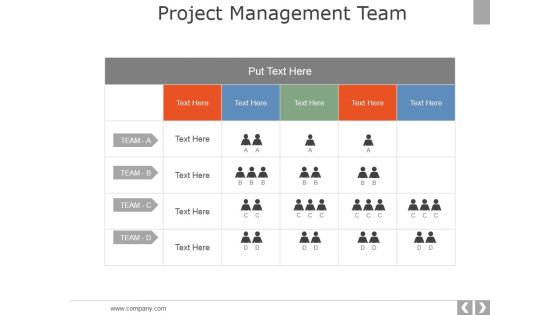
Project Management Team Template 2 Ppt PowerPoint Presentation Layouts Good
This is a project management team template 2 ppt powerpoint presentation layouts good. This is a four stage process. The stages in this process are table, compare, team, project, work.
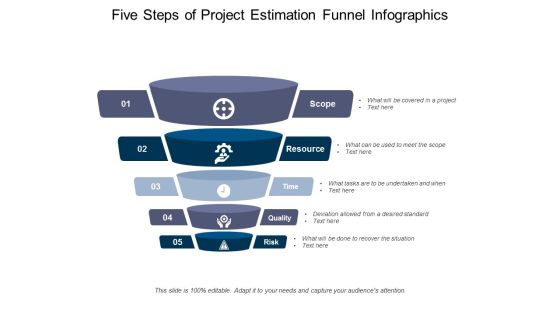
Five Steps Of Project Estimation Funnel Infographics Ppt PowerPoint Presentation Infographics Example Introduction
Presenting this set of slides with name five steps of project estimation funnel infographics ppt powerpoint presentation infographics example introduction. This is a five stage process. The stages in this process are project funnel, performance management, planning. This is a completely editable PowerPoint presentation and is available for immediate download. Download now and impress your audience.

Project Security Administration IT Information Security Process To Manage Firms Sensitive Data Contd Graphics PDF
This slide provides information about information security process in order to manage firms sensitive data in terms of firewall audit checklist, VPN configuration, penetrating testing. Deliver and pitch your topic in the best possible manner with this project security administration it information security process to manage firms sensitive data contd graphics pdf. Use them to share invaluable insights on firewall audit checklist, vpn configuration, penetrating testing and impress your audience. This template can be altered and modified as per your expectations. So, grab it now.
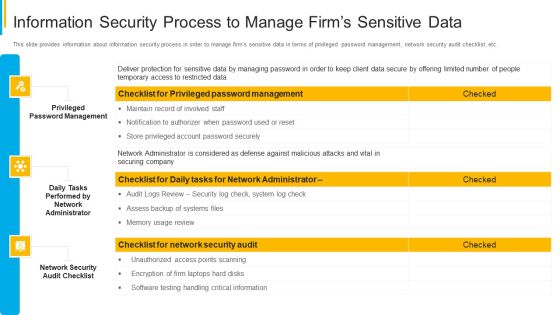
Project Security Administration IT Information Security Process To Manage Firms Sensitive Data Summary PDF
This slide provides information about information security process in order to manage firms sensitive data in terms of privileged password management, network security audit checklist, etc. Deliver an awe inspiring pitch with this creative project security administration it information security process to manage firms sensitive data summary pdf bundle. Topics like privileged password management, daily tasks performed by network administrator, network security audit checklist can be discussed with this completely editable template. It is available for immediate download depending on the needs and requirements of the user.

Different Categories Of Data Centers Types Of Data Centers Micro Data Centers Inspiration PDF
This slide represents the micro data center, its benefits, its size, and its architecture for enterprise IT using the hybrid cloud with micro data center MDC options and headquarter HQ micro data center MDC options. Are you searching for a Different Categories Of Data Centers Types Of Data Centers Micro Data Centers Inspiration PDF that is uncluttered, straightforward, and original Its easy to edit, and you can change the colors to suit your personal or business branding. For a presentation that expresses how much effort youve put in, this template is ideal With all of its features, including tables, diagrams, statistics, and lists, its perfect for a business plan presentation. Make your ideas more appealing with these professional slides. Download Different Categories Of Data Centers Types Of Data Centers Micro Data Centers Inspiration PDF from Slidegeeks today.

Company Budget Analysis Strategies To Control Marketing Department Overspending Mockup PDF
The following slide provides information regarding strategies to control marketing department overspending which are outsourcing work to digital marketing agency and hiring a marketing specialist. The also provides details of the business advantage offered by each strategy. The Company Budget Analysis Strategies To Control Marketing Department Overspending Mockup PDF is a compilation of the most recent design trends as a series of slides. It is suitable for any subject or industry presentation, containing attractive visuals and photo spots for businesses to clearly express their messages. This template contains a variety of slides for the user to input data, such as structures to contrast two elements, bullet points, and slides for written information. Slidegeeks is prepared to create an impression.
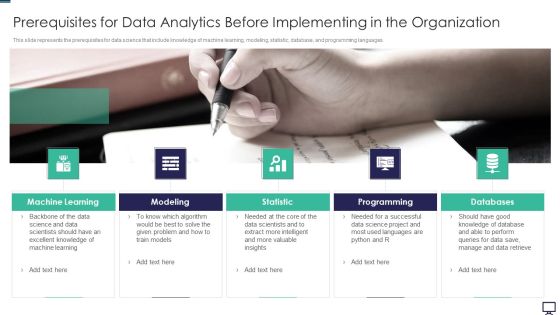
Prerequisites For Data Analytics Before Implementing In The Organization Ppt Professional Design Templates PDF
This slide represents the prerequisites for data science that include knowledge of machine learning, modeling, statistic, database, and programming languages. This is a prerequisites for data analytics before implementing in the organization ppt professional design templates pdf template with various stages. Focus and dispense information on five stages using this creative set, that comes with editable features. It contains large content boxes to add your information on topics like programming, databases, statistic, modeling, machine learning. You can also showcase facts, figures, and other relevant content using this PPT layout. Grab it now.
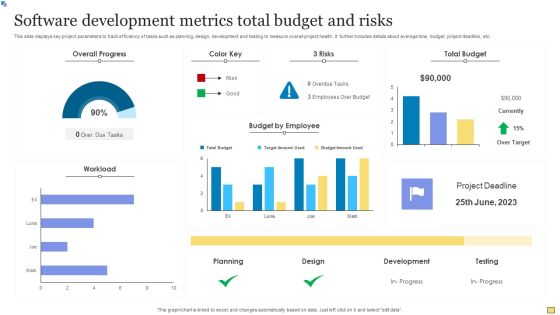
Software Development Metrics Total Budget And Risks Summary PDF
This slide displays key project parameters to track efficiency of tasks such as planning, design, development and testing to measure overall project health. It further includes details about average time, budget, project deadline, etc. Showcasing this set of slides titled Software Development Metrics Total Budget And Risks Summary PDF. The topics addressed in these templates are Overall Progress, Workload Employee, Total Budget. All the content presented in this PPT design is completely editable. Download it and make adjustments in color, background, font etc. as per your unique business setting.

Data Mining Future Trends In Medical Industry Ppt PowerPoint Presentation Inspiration Objects PDF
This slide mentions future trends of data mining applicable in medical industry. It includes electronic health records, patient engagement and predictive analysis. Persuade your audience using this Data Mining Future Trends In Medical Industry Ppt PowerPoint Presentation Inspiration Objects PDF. This PPT design covers four stages, thus making it a great tool to use. It also caters to a variety of topics including Electronic Health, Patient Engagement, Predictive Analytics. Download this PPT design now to present a convincing pitch that not only emphasizes the topic but also showcases your presentation skills.
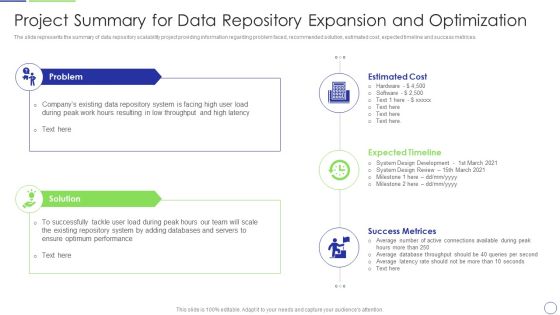
Developing Organization Primary Data Storage Action Plan Project Summary For Data Repository Expansion Rules PDF
The slide represents the summary of data repository scalability project providing information regarding problem faced, recommended solution, estimated cost, expected timeline and success metrices. This is a developing organization primary data storage action plan project summary for data repository expansion rules pdf template with various stages. Focus and dispense information on two stages using this creative set, that comes with editable features. It contains large content boxes to add your information on topics like repository, resulting, latency, solution, timeline. You can also showcase facts, figures, and other relevant content using this PPT layout. Grab it now.
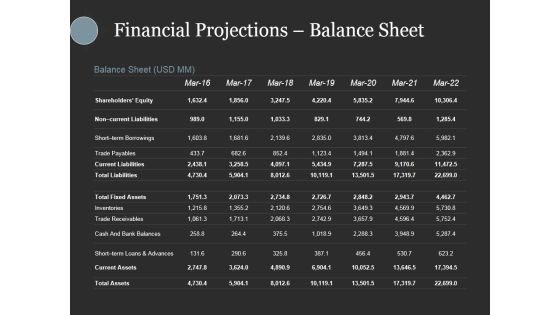
Financial Projections Balance Sheet Ppt PowerPoint Presentation Gallery Design Inspiration
This is a financial projections balance sheet ppt powerpoint presentation gallery design inspiration. This is a seven stage process. The stages in this process are shareholders equity, non current liabilities, short term borrowings, trade payables, current liabilities.
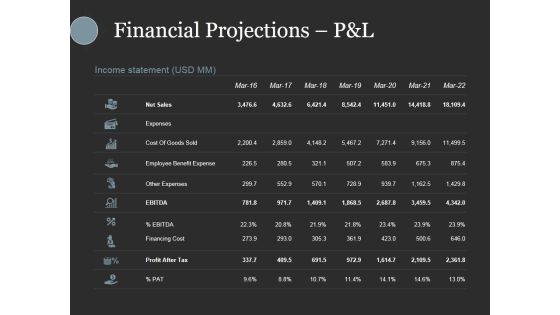
Financial Projections Pandl Ppt PowerPoint Presentation Slides Show
This is a financial projections pandl ppt powerpoint presentation slides show. This is a seven stage process. The stages in this process are net sales, expenses, cost of goods sold, employee benefit expense, other expenses.
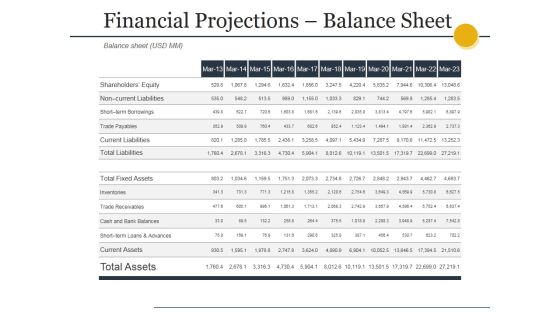
Financial Projections Balance Sheet Ppt PowerPoint Presentation Model Template
This is a financial projections balance sheet ppt powerpoint presentation model template. This is a eleven stage process. The stages in this process are current assets, cash and bank balances, trade receivables, inventories, total fixed assets.
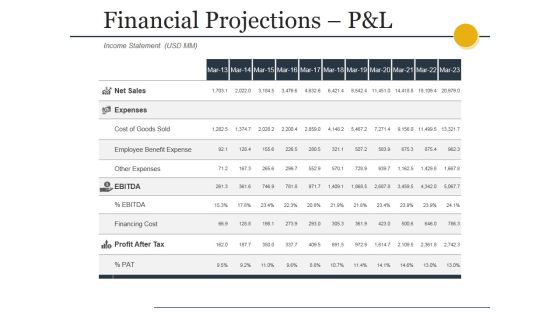
Financial Projections Pandl Ppt PowerPoint Presentation Styles Gallery
This is a financial projections pandl ppt powerpoint presentation styles gallery. This is a eleven stage process. The stages in this process are net sales, expenses, cost of goods sold, employee benefit expense, other expenses.
