Forecast Dashboard

Checklist To Cultivate Data Driven Marketing Team Mockup PDF
This slide represents the checklist to guide CMO to effectively build data driven culture in the enterprise and make excellent data driven marketing team. It includes parameters such as select right analytics tool, develop data benchmarks etc. Do you know about Slidesgeeks Checklist To Cultivate Data Driven Marketing Team Mockup PDF These are perfect for delivering any kind od presentation. Using it, create PowerPoint presentations that communicate your ideas and engage audiences. Save time and effort by using our pre-designed presentation templates that are perfect for a wide range of topic. Our vast selection of designs covers a range of styles, from creative to business, and are all highly customizable and easy to edit. Download as a PowerPoint template or use them as Google Slides themes.

Project Management Key Performance Indicators Balanced Scorecard Introduction PDF
This slide shows key performance indicators scorecard for the project management of the organization. It includes financial status, consumer satisfaction, business growth and internal objectives. Pitch your topic with ease and precision using this Project Management Key Performance Indicators Balanced Scorecard Introduction PDF. This layout presents information on Financial Status, Business Growth, Consumer Satisfaction. It is also available for immediate download and adjustment. So, changes can be made in the color, design, graphics or any other component to create a unique layout.
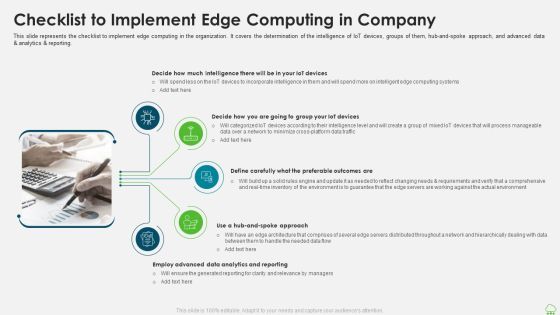
Distributed Computing IT Checklist To Implement Edge Computing In Company Portrait PDF
This slide represents the checklist to implement edge computing in the organization. It covers the determination of the intelligence of IoT devices, groups of them, hub and spoke approach, and advanced data and analytics and reporting. This is a distributed computing it checklist to implement edge computing in company portrait pdf template with various stages. Focus and dispense information on five stages using this creative set, that comes with editable features. It contains large content boxes to add your information on topics like data analytics and reporting, architecture, intelligence. You can also showcase facts, figures, and other relevant content using this PPT layout. Grab it now.
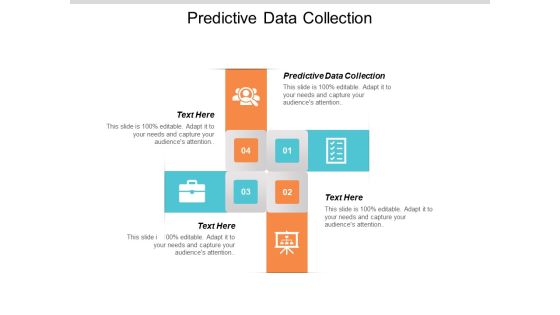
Predictive Data Collection Ppt PowerPoint Presentation Model Slide Portrait Cpb
This is a predictive data collection ppt powerpoint presentation model slide portrait cpb. This is a four stage process. The stages in this process are predictive data collection.

One Page Summary Annual Committee Report Template Department Of Entomology One Pager Documents
This one page shows the information regarding annual committee report template department of entomology which includes executive summary, role of department, goals, vision, overview, other projects, data management, etc. Presenting you a fantastic One Page Summary Annual Committee Report Template Department Of Entomology One Pager Documents. This piece is crafted on hours of research and professional design efforts to ensure you have the best resource. It is completely editable and its design allow you to rehash its elements to suit your needs. Get this One Page Summary Annual Committee Report Template Department Of Entomology One Pager Documents A4 One-pager now.

Social Platforms Data Analysis Usage By Digital Marketing Companies Data Clipart PDF
This slide represents statistical data related to use of various social media platforms by digital marketing company for customer engagement. It includes use of various social media platforms such as Instagram, facebook, twitter, you tube etc. for customer engagement. Pitch your topic with ease and precision using this Social Platforms Data Analysis Usage By Digital Marketing Companies Data Clipart PDF. This layout presents information on Social Platforms Data Analysis, Digital Marketing Companies Data. It is also available for immediate download and adjustment. So, changes can be made in the color, design, graphics or any other component to create a unique layout.
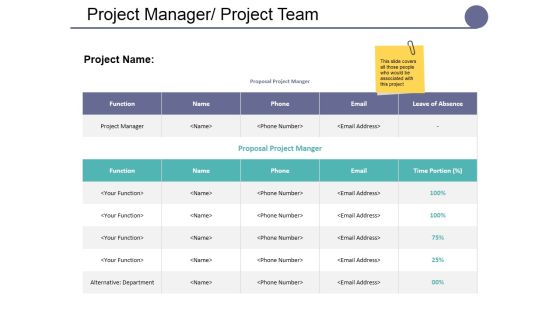
Project Manager Project Team Ppt PowerPoint Presentation Inspiration Layouts
This is a project manager project team ppt powerpoint presentation inspiration layouts. This is a two stage process. The stages in this process are project manager, function, phone, email.

Marketing Budget Report Approval Procedure Inspiration PDF
This slide illustrates approval flowchart for marketing budget document to ensure consistency in team operations and provide a definite blueprint of activities. This covers process of budget approval in form of workflow. Pitch your topic with ease and precision using this Marketing Budget Report Approval Procedure Inspiration PDF. This layout presents information on Budget Approval, Events, Procedure. It is also available for immediate download and adjustment. So, changes can be made in the color, design, graphics or any other component to create a unique layout.

5 Vs Of Big Data Analysis Infographics PDF
This slide showcases five Vs which are volume, veracity, variety, velocity and value. Each aspect is considered for the analytics purpose. Volume defines data in numbers, veracity explains whether the data is useful or not, variety tell whether the data is in the structured or unstructured form etc. Persuade your audience using this 5 Vs Of Big Data Analysis Infographics PDF. This PPT design covers five stages, thus making it a great tool to use. It also caters to a variety of topics including Velocity, Volume, Veracity. Download this PPT design now to present a convincing pitch that not only emphasizes the topic but also showcases your presentation skills.

Business Diagram Alarm Clock With Pie Chart For Result Analysis PowerPoint Slide
This business slide displays alarm clock with pie chart. This diagram is a data visualization tool that gives you a simple way to present statistical information. This slide helps your audience examine and interpret the data you present.
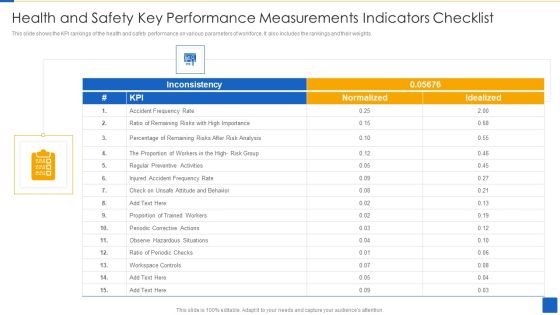
Health And Safety Key Performance Measurements Indicators Checklist Brochure PDF
This slide shows the KPI rankings of the health and safety performance on various parameters of workforce. It also includes the rankings and their weights. Pitch your topic with ease and precision using this Health And Safety Key Performance Measurements Indicators Checklist Brochure PDF This layout presents information on Injured Accident, Inconsistency, Proportion Trained Workers It is also available for immediate download and adjustment. So, changes can be made in the color, design, graphics or any other component to create a unique layout.

Project Manager Project Team Ppt PowerPoint Presentation Model Samples
This is a project manager project team ppt powerpoint presentation model samples. This is a two stage process. The stages in this process are function, leave of absence, phone, email, name, function.

Data And Analytics Procedure Evaluation Checklist Infographics PDF
This slide showcases a checklist of data and analytics process to find current trends and improve performance. The KPIs involved in this are cost, performance scalability, and modernization. Pitch your topic with ease and precision using this Data And Analytics Procedure Evaluation Checklist Infographics PDF. This layout presents information on Particulars, Owner, Deadline. It is also available for immediate download and adjustment. So, changes can be made in the color, design, graphics or any other component to create a unique layout.
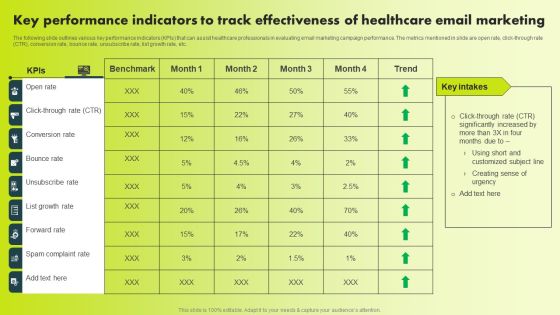
Key Performance Indicators To Track Effectiveness Of Healthcare Email Marketing Introduction PDF
The following slide outlines various key performance indicators KPIs that can assist healthcare professionals in evaluating email marketing campaign performance. The metrics mentioned in slide are open rate, click-through rate CTR, conversion rate, bounce rate, unsubscribe rate, list growth rate, etc. Present like a pro with Key Performance Indicators To Track Effectiveness Of Healthcare Email Marketing Introduction PDF Create beautiful presentations together with your team, using our easy-to-use presentation slides. Share your ideas in real-time and make changes on the fly by downloading our templates. So whether you are in the office, on the go, or in a remote location, you can stay in sync with your team and present your ideas with confidence. With Slidegeeks presentation got a whole lot easier. Grab these presentations today.

Business Diagram 3d Colorful Pie Graph With Magnifier Data Search PowerPoint Slide
This business slide displays 3d colorful pie graph with magnifier. This diagram is a data visualization tool that gives you a simple way to present statistical information. This slide helps your audience examine and interpret the data you present.

Business Diagram Data Driven Pie Chart Inside The Magnifier PowerPoint Slide
This business slide displays 3d colorful pie graph with magnifier. This diagram is a data visualization tool that gives you a simple way to present statistical information. This slide helps your audience examine and interpret the data you present.
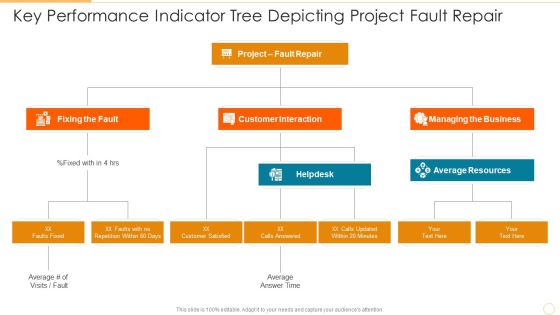
Key Performance Indicator Tree Depicting Project Fault Repair Diagrams PDF
Presenting key performance indicator tree depicting project fault repair diagrams pdf to dispense important information. This template comprises three stages. It also presents valuable insights into the topics including customer interaction, managing the business, fixing the fault. This is a completely customizable PowerPoint theme that can be put to use immediately. So, download it and address the topic impactfully.

Checklist For Technical On Page And Off Page SEO Audit Training Ppt
This slide showcases a comprehensive checklist to conduct an SEO audit. It includes details of multiple factors associated with Technical, On-Page, and Off-Page SEO Audit.
Project Key Performance Indicator Tree Illustrating Customer Satisfaction Icons PDF
Persuade your audience using this project key performance indicator tree illustrating customer satisfaction icons pdf. This PPT design covers four stages, thus making it a great tool to use. It also caters to a variety of topics including total customer complaints, total customer notifications, customer satisfaction project. Download this PPT design now to present a convincing pitch that not only emphasizes the topic but also showcases your presentation skills.
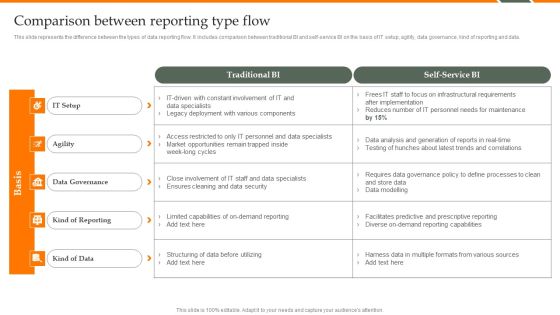
Human Resource Analytics Comparison Between Reporting Type Flow Demonstration PDF
This slide represents the difference between the types of data reporting flow. It includes comparison between traditional BI and self-service BI on the basis of IT setup, agility, data governance, kind of reporting and data. If your project calls for a presentation, then Slidegeeks is your go-to partner because we have professionally designed, easy-to-edit templates that are perfect for any presentation. After downloading, you can easily edit Human Resource Analytics Comparison Between Reporting Type Flow Demonstration PDF and make the changes accordingly. You can rearrange slides or fill them with different images. Check out all the handy templates.

Ways To Improve Crm Strategy Predictive And Big Data Analytics Ppt PowerPoint Presentation Portfolio Information
This is a ways to improve crm strategy predictive and big data analytics ppt powerpoint presentation portfolio information. This is a six stage process. The stages in this process are employee performance review, job evaluation, customer 360.
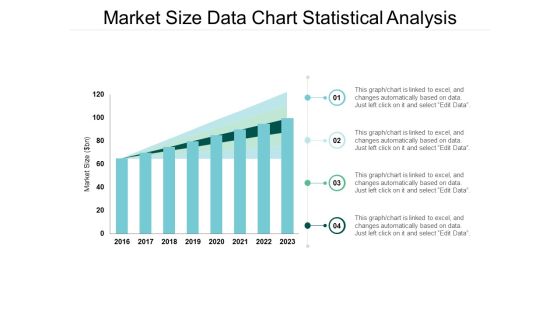
Market Size Data Chart Statistical Analysis Ppt Powerpoint Presentation Model Format
This is a market size data chart statistical analysis ppt powerpoint presentation model format. The topics discussed in this diagram are market growth, market opportunity, market profitability. This is a completely editable PowerPoint presentation, and is available for immediate download.

Predictive Analytics Big Data Ppt PowerPoint Presentation Infographics Design Templates Cpb
Presenting this set of slides with name predictive analytics big data ppt powerpoint presentation infographics design templates cpb. This is an editable Powerpoint five stages graphic that deals with topics like predictive analytics big data to help convey your message better graphically. This product is a premium product available for immediate download and is 100 percent editable in Powerpoint. Download this now and use it in your presentations to impress your audience.
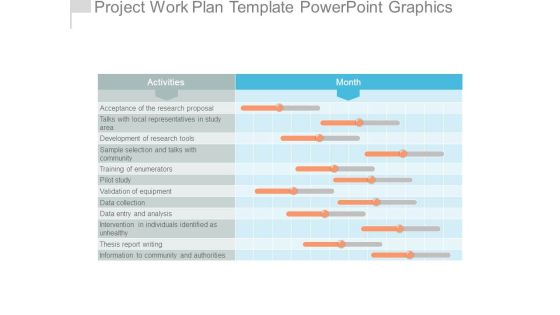
Project Work Plan Template Powerpoint Graphics
This is a project work plan template powerpoint graphics. This is a twelve stage process. The stages in this process are acceptance of the research proposal, talks with local representatives in study area, development of research tools, sample selection and talks with community, training of enumerators, pilot study, validation of equipment, data collection, data entry and analysis, intervention in individuals identified as unhealthy, thesis report writing, information to community and authorities.

Corporate Execution And Financial Liability Report Project Budget Portrait PDF
Presenting this set of slides with name corporate execution and financial liability report project budget portrait pdf. The topics discussed in these slides are develop, cost, perform, acceptance. This is a completely editable PowerPoint presentation and is available for immediate download. Download now and impress your audience.
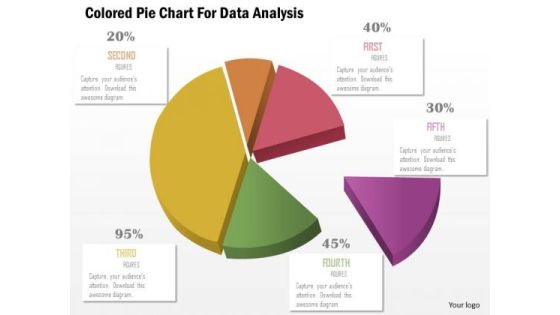
Business Diagram Colored Pie Chart For Data Analysis Presentation Template
This business slide displays pie chart. This diagram is a data visualization tool that gives you a simple way to present statistical information. This slide helps your audience examine and interpret the data you present.

Business Education PowerPoint Templates Business Bar Graph Data Driven Ppt Slides
Business Education PowerPoint Templates Business bar graph data driven PPT Slides-This PowerPoint slide is a data driven Columns Chart. The number of columns depend on the data.-Business Editable PowerPoint Templates Business beveled column chart PPT Slides-This ppt can be used for concepts relating to-chart,, graph, growth, investment, , market, percentage, , presentation report, results, statistics, stock, success and business.

Best Practices For Workplace Diversity Data Collection Budget Download PDF
Following slide demonstrates best practices which can be used by businesses for data collection without interruptions. It includes best practices such as determine diversity data requirement, budget allocation and regular budget review. Persuade your audience using this Best Practices For Workplace Diversity Data Collection Budget Download PDF. This PPT design covers three stages, thus making it a great tool to use. It also caters to a variety of topics including Determine Data Requirement, Data Collection Budget, Budget Review. Download this PPT design now to present a convincing pitch that not only emphasizes the topic but also showcases your presentation skills.
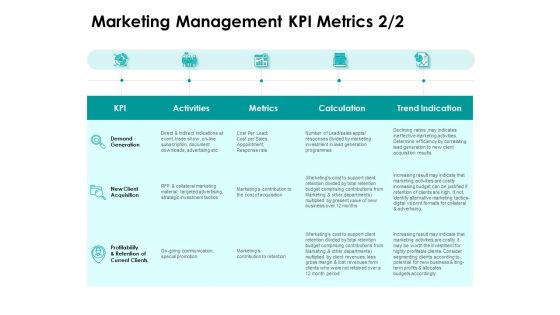
Target Market Strategy Marketing Management KPI Metrics Trend Ppt Infographics Graphics Download PDF
Deliver an awe-inspiring pitch with this creative target market strategy marketing management kpi metrics trend ppt infographics graphics download pdf bundle. Topics like activities, metrics, calculation, trend indication can be discussed with this completely editable template. It is available for immediate download depending on the needs and requirements of the user.

Ways Artificial Intelligence Is Transforming Finance Sector AI Model To Calculate Probability Of Debt Ideas PDF
This slide showcases deployment of Artificial intelligence model that can help financial institutions to calculate debt collection probability. Its key elements are data collection, data preparation, machine learning models plus evaluation and interpretation.Coming up with a presentation necessitates that the majority of the effort goes into the content and the message you intend to convey. The visuals of a PowerPoint presentation can only be effective if it supplements and supports the story that is being told. Keeping this in mind our experts created Ways Artificial Intelligence Is Transforming Finance Sector AI Model To Calculate Probability Of Debt Ideas PDF to reduce the time that goes into designing the presentation. This way, you can concentrate on the message while our designers take care of providing you with the right template for the situation.
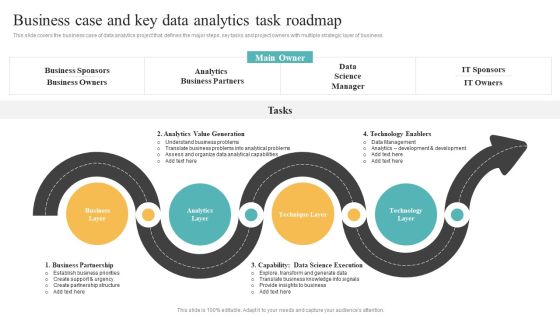
Transformation Toolkit Competitive Intelligence Information Analysis Business Case And Key Data Analytics Mockup PDF
This slide covers the business case of data analytics project that defines the major steps, key tasks and project owners with multiple strategic layer of business. From laying roadmaps to briefing everything in detail, our templates are perfect for you. You can set the stage with your presentation slides. All you have to do is download these easy to edit and customizable templates. Transformation Toolkit Competitive Intelligence Information Analysis Business Case And Key Data Analytics Mockup PDF will help you deliver an outstanding performance that everyone would remember and praise you for. Do download this presentation today.

Transformation Toolkit Competitive Intelligence Information Analysis Work Streams For Data Analytics Infographics PDF
This slide shows the work streams structure with team head for implementing the data analytics project. If your project calls for a presentation, then Slidegeeks is your go to partner because we have professionally designed, easy to edit templates that are perfect for any presentation. After downloading, you can easily edit Transformation Toolkit Competitive Intelligence Information Analysis Work Streams For Data Analytics Infographics PDF and make the changes accordingly. You can rearrange slides or fill them with different images. Check out all the handy templates.

Predictive Data Model Difference Between Four Types Of Advanced Analytics Guidelines PDF
This slide represents the difference between the main types of advanced analytics, and it includes diagnostic, descriptive, predictive, and prescriptive analytics. The four major categories of advanced analytics share certain commonalities but are distinguished mostly by their distinctions. Do you have an important presentation coming up Are you looking for something that will make your presentation stand out from the rest Look no further than Predictive Data Model Difference Between Four Types Of Advanced Analytics Guidelines PDF. With our professional designs, you can trust that your presentation will pop and make delivering it a smooth process. And with Slidegeeks, you can trust that your presentation will be unique and memorable. So why wait Grab Predictive Data Model Difference Between Four Types Of Advanced Analytics Guidelines PDF today and make your presentation stand out from the rest

Cloud Computing Services Why Should Businesses Adopt Software As A Service Saas Formats PDF
This slide defines why businesses should adopt software as a service, including an alternative model for typical software installation and no need to maintain the servers, etc. Presenting Cloud Computing Services Why Should Businesses Adopt Software As A Service Saas Formats PDF to provide visual cues and insights. Share and navigate important information on eight stages that need your due attention. This template can be used to pitch topics like Marketing Automation, Project Management, Email Marketing. In addtion, this PPT design contains high resolution images, graphics, etc, that are easily editable and available for immediate download.

Data Driven Insights Diagram Ppt Slide Examples
This is a data driven insights diagram ppt slide examples. This is a seven stage process. The stages in this process are descriptive analytics, diagnostic analytics, predictive analytics, prescriptive analytics, machine learning, data management, execution media.

Data And Analytics Playbook How To Bridge Business Intelligence And Predictive Graphics PDF
This template depicts that with interactive BI visualization and predictive modeling in the same enterprise analytics platform, organizations can easily collaborate on initiatives that make recommended actions accessible to the business. Deliver and pitch your topic in the best possible manner with this Data And Analytics Playbook How To Bridge Business Intelligence And Predictive Graphics PDF. Use them to share invaluable insights on Probability By Package, Customer Information, Internet Data and impress your audience. This template can be altered and modified as per your expectations. So, grab it now.

3 Best Practices For Effective Project Budget Planning Ideas PDF
This slide covers three practices to improve the project financial management process. It also includes practices such as use more analytics, standardize processes and data and deliver real time information Persuade your audience using this 3 best practices for effective project budget planning ideas pdf. This PPT design covers three stages, thus making it a great tool to use. It also caters to a variety of topics including use more analysis, standardize processes and data, deliver real time information. Download this PPT design now to present a convincing pitch that not only emphasizes the topic but also showcases your presentation skills.

Budget Report Ppt PowerPoint Presentation Backgrounds
This is a budget report ppt powerpoint presentation backgrounds. This is a four stage process. The stages in this process are project, incurred, future scheduled, budget, remaining.

Key Technologies For Big Data Analytics In Organization Ppt Outline Gridlines PDF
The following slide highlights applications of key technologies for big data analytics in business industry to discover hardware and software solutions for processing data. It includes components such as predictive analysis, nosql database, knowledge discovery tools , data virtualization etc. Presenting Key Technologies For Big Data Analytics In Organization Ppt Outline Gridlines PDF to dispense important information. This template comprises five stages. It also presents valuable insights into the topics including Predictive Analytics, Knowledge Discovery Tools, Data Virtualization, Distributed Storage . This is a completely customizable PowerPoint theme that can be put to use immediately. So, download it and address the topic impactfully.
Icons Slide For Predictive Analytics In The Age Of Big Data Inspiration PDF
Introducing our well designed Icons Slide For Predictive Analytics In The Age Of Big Data Inspiration PDF set of slides. The slide displays editable icons to enhance your visual presentation. The icons can be edited easily. So customize according to your business to achieve a creative edge. Download and share it with your audience.
Quarterly Budget Report For Company Staff Training Ppt Icon Slide PDF
Showcasing this set of slides titled quarterly budget report for company staff training ppt icon slide pdf. The topics addressed in these templates are training budget, blockchain training, data analytics. All the content presented in this PPT design is completely editable. Download it and make adjustments in color, background, font etc. as per your unique business setting.

Value Stream Data Analytics Process Business Analysis Modification Toolkit Professional PDF
This slide shows the step by step approach of data analytics project focusing on data gathering, consolidation and data analysis to build business insights for effective decision making. This is a Value Stream Data Analytics Process Business Analysis Modification Toolkit Professional PDF template with various stages. Focus and dispense information on six stages using this creative set, that comes with editable features. It contains large content boxes to add your information on topics like Data Gathering, Data Cleaning, Data Consolidation. You can also showcase facts, figures, and other relevant content using this PPT layout. Grab it now.

Key Performance Indicators For Business Review Mockup PDF
This slide outlines the key performance indicators for business review for business objectives and focus on specific areas. It includes various KPIs such as number of leads, cost per lead, units produce and customer acquisition cost. Showcasing this set of slides titled Key Performance Indicators For Business Review Mockup PDF. The topics addressed in these templates are Estimated Value, Actual Value, Variance. All the content presented in this PPT design is completely editable. Download it and make adjustments in color, background, font etc. as per your unique business setting.
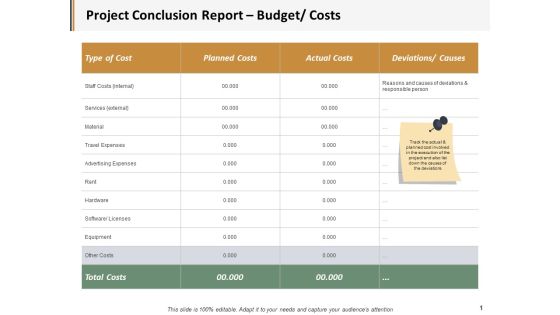
Project Conclusion Report Budget Costs Ppt PowerPoint Presentation Inspiration Outline
This is a project conclusion report budget costs ppt powerpoint presentation inspiration outline. This is a four stage process. The stages in this process are business, management, marketing.

Work Streams For Data Analytics With Its Roles Business Analysis Modification Toolkit Topics PDF
Presenting Work Streams For Data Analytics With Its Roles Business Analysis Modification Toolkit Topics PDF to provide visual cues and insights. Share and navigate important information on six stages that need your due attention. This template can be used to pitch topics like Project Executive, Data Analytics, Organization Business. In addtion, this PPT design contains high resolution images, graphics, etc, that are easily editable and available for immediate download.

Toolkit For Data Science And Analytics Transition Data Analytics Program Checklist Portrait PDF
This slide shows progress status of data analytics process which includes important key tasks that must be performed while initiating a project. From laying roadmaps to briefing everything in detail, our templates are perfect for you. You can set the stage with your presentation slides. All you have to do is download these easy to edit and customizable templates. Toolkit For Data Science And Analytics Transition Data Analytics Program Checklist Portrait PDF will help you deliver an outstanding performance that everyone would remember and praise you for. Do download this presentation today.

Budget Report Ppt PowerPoint Presentation Topics
This is a budget report ppt powerpoint presentation topics. This is a five stage process. The stages in this process are project, incurred, future scheduled, budget, remaining.

Data Analytics Maturity Framework Stages Ppt PowerPoint Presentation File Demonstration PDF
This slide mentions the stages involved in data analytics maturity model with their specific applications, tools involved and specialists required at each stage. The stages include descriptive, diagnostic, predictive and prescriptive analysis. Showcasing this set of slides titled Data Analytics Maturity Framework Stages Ppt PowerPoint Presentation File Demonstration PDF. The topics addressed in these templates are Descriptive Analytics, Diagnostic Analytics, Predictive Analytics, Prescriptive Analytics. All the content presented in this PPT design is completely editable. Download it and make adjustments in color, background, font etc. as per your unique business setting.

State Location On Africa Map With Percentage Data Powerpoint Slides
This PowerPoint template displays state location on Africa map with percentage data. This Map template can be used for annual growth report. This slide can also be used by school students for educational projects.
Map Of Czech With Percentage Data And Icons Powerpoint Slides
This PowerPoint template displays map of Czech with percentage data and icons. This Map template can be used for annual growth report. This slide can also be used by school students for educational projects.
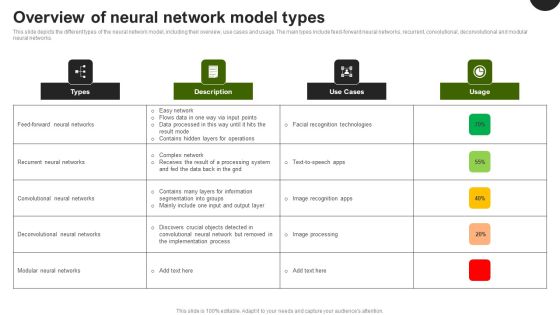
Predictive Analytics In The Age Of Big Data Overview Of Neural Network Model Types Guidelines PDF
This slide depicts the different types of the neural network model, including their overview, use cases and usage. The main types include feed-forward neural networks, recurrent, convolutional, deconvolutional and modular neural networks. Find highly impressive Predictive Analytics In The Age Of Big Data Overview Of Neural Network Model Types Guidelines PDF on Slidegeeks to deliver a meaningful presentation. You can save an ample amount of time using these presentation templates. No need to worry to prepare everything from scratch because Slidegeeks experts have already done a huge research and work for you. You need to download Predictive Analytics In The Age Of Big Data Overview Of Neural Network Model Types Guidelines PDF for your upcoming presentation. All the presentation templates are 100 percent editable and you can change the color and personalize the content accordingly. Download now.

Predictive Analytics In The Age Of Big Data Overview Of Regression Model Types Diagrams PDF
This slide represents the types of the regression model, including its overview, examples, and usage percentage. The main types of regression include linear, multiple linear, stepwise regression modelling, and non-linear regression. If you are looking for a format to display your unique thoughts, then the professionally designed Predictive Analytics In The Age Of Big Data Overview Of Regression Model Types Diagrams PDF is the one for you. You can use it as a Google Slides template or a PowerPoint template. Incorporate impressive visuals, symbols, images, and other charts. Modify or reorganize the text boxes as you desire. Experiment with shade schemes and font pairings. Alter, share or cooperate with other people on your work. Download Predictive Analytics In The Age Of Big Data Overview Of Regression Model Types Diagrams PDF and find out how to give a successful presentation. Present a perfect display to your team and make your presentation unforgettable.

Cyber Risks And Incident Response Playbook Checklist For Work From Home Data Security Infographics PDF
From laying roadmaps to briefing everything in detail, our templates are perfect for you. You can set the stage with your presentation slides. All you have to do is download these easy-to-edit and customizable templates. Cyber Risks And Incident Response Playbook Checklist For Work From Home Data Security Infographics PDF will help you deliver an outstanding performance that everyone would remember and praise you for. Do download this presentation today.

Predictive Analytics In The Age Of Big Data Decision Trees Technique For Classification Model Brochure PDF
This slide depicts the decision tree model of predictive analytics that are beneficial for quick decision-making and consists of decision node and leaf nodes. In this, leaves define a particular decision, and the branches describe the possible options. Want to ace your presentation in front of a live audience Our Predictive Analytics In The Age Of Big Data Decision Trees Technique For Classification Model Brochure PDF can help you do that by engaging all the users towards you. Slidegeeks experts have put their efforts and expertise into creating these impeccable powerpoint presentations so that you can communicate your ideas clearly. Moreover, all the templates are customizable, and easy to edit and downloadable. Use these for both personal and commercial use.

Collecting Consumer Qualitative Data For Personalized Marketing Professional PDF
This slide showcases consumer qualitative data that can be collected to formulate personalized marketing campaign. It also shows ways to collect data from different sources. Are you searching for a Collecting Consumer Qualitative Data For Personalized Marketing Professional PDF that is uncluttered, straightforward, and original Its easy to edit, and you can change the colors to suit your personal or business branding. For a presentation that expresses how much effort you have put in, this template is ideal With all of its features, including tables, diagrams, statistics, and lists, its perfect for a business plan presentation. Make your ideas more appealing with these professional slides. Download Collecting Consumer Qualitative Data For Personalized Marketing Professional PDF from Slidegeeks today.

Collecting Identity Data For Personalized Marketing Ppt File Examples PDF
This slide showcases identity data that can be collected to formulate personalized marketing campaign. It also shows ways to collect data from different sources. Are you searching for a Collecting Identity Data For Personalized Marketing Ppt File Examples PDF that is uncluttered, straightforward, and original Its easy to edit, and you can change the colors to suit your personal or business branding. For a presentation that expresses how much effort you have put in, this template is ideal With all of its features, including tables, diagrams, statistics, and lists, its perfect for a business plan presentation. Make your ideas more appealing with these professional slides. Download Collecting Identity Data For Personalized Marketing Ppt File Examples PDF from Slidegeeks today.

Scrum Master Key Performance Indicators And Kpis Ppt Gallery Files PDF
This slide illustrates graphical representation of performance reviews of scrum team. It includes average task results, key areas and reviews etc. Showcasing this set of slides titled Scrum Master Key Performance Indicators And Kpis Ppt Gallery Files PDF. The topics addressed in these templates are Scrum Team, Average Task Results, Project Timeline Management. All the content presented in this PPT design is completely editable. Download it and make adjustments in color, background, font etc. as per your unique business setting.
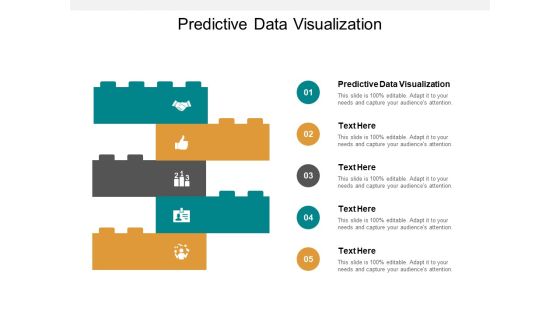
Predictive Data Visualization Ppt PowerPoint Presentation Infographics Design Ideas Cpb
Presenting this set of slides with name predictive data visualization ppt powerpoint presentation infographics design ideas cpb. This is an editable Powerpoint five stages graphic that deals with topics like predictive data visualization to help convey your message better graphically. This product is a premium product available for immediate download and is 100 percent editable in Powerpoint. Download this now and use it in your presentations to impress your audience.

Predictive Data Information Ppt PowerPoint Presentation Ideas Display Cpb
Presenting this set of slides with name predictive data information ppt powerpoint presentation ideas display cpb. This is an editable Powerpoint four stages graphic that deals with topics like predictive data information to help convey your message better graphically. This product is a premium product available for immediate download and is 100 percent editable in Powerpoint. Download this now and use it in your presentations to impress your audience.
Predictive Model Data Mining Ppt PowerPoint Presentation Summary Cpb
Presenting this set of slides with name predictive model data mining ppt powerpoint presentation summary cpb. This is an editable Powerpoint four stages graphic that deals with topics like predictive model data mining to help convey your message better graphically. This product is a premium product available for immediate download and is 100 percent editable in Powerpoint. Download this now and use it in your presentations to impress your audience.

 Home
Home