Flow Chart
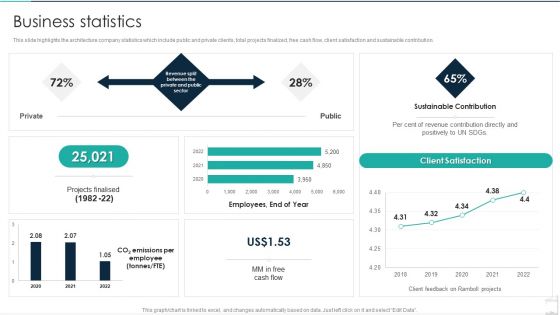
Commercial Construction And Architecture Firm Business Statistics Ideas PDF
This slide highlights the architecture company statistics which include public and private clients, total projects finalized, free cash flow, client satisfaction and sustainable contribution. Deliver an awe inspiring pitch with this creative Commercial Construction And Architecture Firm Business Statistics Ideas PDF bundle. Topics like Revenue, Projects Finalised, Employees can be discussed with this completely editable template. It is available for immediate download depending on the needs and requirements of the user.
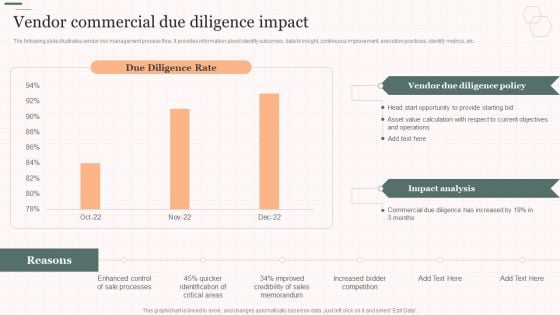
Vendor Commercial Due Diligence Impact Vendor Management Strategies Background PDF
The following slide illustrates vendor risk management process flow. It provides information about identify outcomes, data to insight, continuous improvement, execution practices, identify metrics, etc. Deliver and pitch your topic in the best possible manner with this Vendor Commercial Due Diligence Impact Vendor Management Strategies Background PDF. Use them to share invaluable insights on Diligence Policy, Impact Analysis, Commercial Diligence and impress your audience. This template can be altered and modified as per your expectations. So, grab it now.
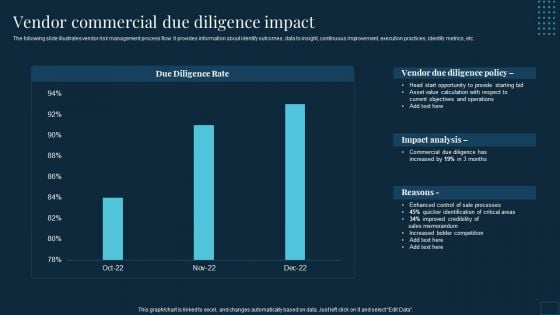
Vendor Management To Handle Purchase Vendor Commercial Due Diligence Impact Inspiration PDF
The following slide illustrates vendor risk management process flow. It provides information about identify outcomes, data to insight, continuous improvement, execution practices, identify metrics, etc. Deliver and pitch your topic in the best possible manner with this Vendor Management To Handle Purchase Vendor Commercial Due Diligence Impact Inspiration PDF. Use them to share invaluable insights on Opportunity Provide, Starting Bid, Asset Value and impress your audience. This template can be altered and modified as per your expectations. So, grab it now.
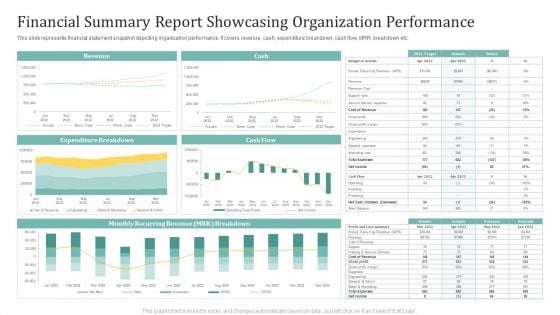
Financial Summary Report Showcasing Organization Performance Ppt Show Skills PDF
This slide represents financial statement snapshot depicting organization performance. It covers revenue, cash, expenditure breakdown, cash flow, MRR breakdown etc. Showcasing this set of slides titled Financial Summary Report Showcasing Organization Performance Ppt Show Skills PDF. The topics addressed in these templates are Revenue, Cash, Expenditure Breakdown. All the content presented in this PPT design is completely editable. Download it and make adjustments in color, background, font etc. as per your unique business setting.
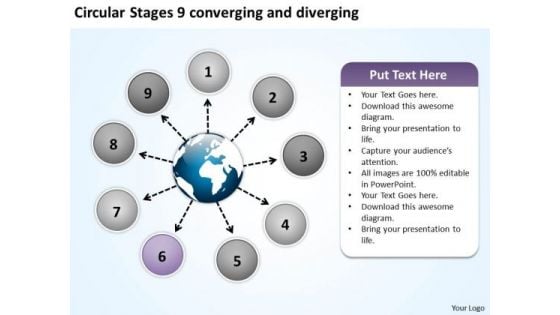
Circular Stages 9 Converging And Diverging Motion Diagram PowerPoint Slides
We present our circular stages 9 converging and diverging Motion Diagram PowerPoint Slides.Download and present our Ring charts PowerPoint Templates because Our PowerPoint Templates and Slides will let your team Walk through your plans. See their energy levels rise as you show them the way. Download our Marketing PowerPoint Templates because customer satisfaction is a mantra of the marketplace. Building a loyal client base is an essential element of your business. Download our Arrows PowerPoint Templates because clear thnking is your strength, transmit your thoughts to your eager team. Present our Shapes PowerPoint Templates because you have it all down to a nicety, slice by slice, layer by layer. Use our Business PowerPoint Templates because a brainwave has occurred to you after review. You know just how to push the graph skyward.Use these PowerPoint slides for presentations relating to Around, arrow, business, chart, circle, circular, circulation, commerce, concept, curving, cycle, diagram, direction, e-commerce, element, finance, financial, flow, flowchart, flowing, global, globe, internet, investment, market, motion, movement, moving, presentation, process, recession, recycle, repeat, repetitive, ring, rotation, round, savings, shape, shipping, shopping, spinning, step, structure, symbol. The prominent colors used in the PowerPoint template are Purple, Blue, Black. People tell us our circular stages 9 converging and diverging Motion Diagram PowerPoint Slides are Clever. We assure you our chart PowerPoint templates and PPT Slides are specially created by a professional team with vast experience. They diligently strive to come up with the right vehicle for your brilliant Ideas. PowerPoint presentation experts tell us our circular stages 9 converging and diverging Motion Diagram PowerPoint Slides are Breathtaking. You can be sure our business PowerPoint templates and PPT Slides are Charming. Professionals tell us our circular stages 9 converging and diverging Motion Diagram PowerPoint Slides are Festive. Use our business PowerPoint templates and PPT Slides are designed by professionals Clever is the basic for our Circular Stages 9 Converging And Diverging Motion Diagram PowerPoint Slides. Brilliance is what your thoughts will achieve.
Business Diagram Eight Icons With Circle Diagram Presentation Template
This power point template slide has been crafted with graphic of eight staged circle diagram. This PPT contains the concept of process flow. Use this PPT diagram for business and marketing related presentations.
Business Diagram Seven Icons With Circle Diagram Presentation Template
Seven staged circle diagram has been used to craft this power point template diagram. This PPT contains the concept of process flow. Use this PPT and build an innovative presentation for business and sales process related topics.
Business Diagram Six Icons With Circle Diagram Presentation Template
Six staged circle diagram has been used to craft this power point template diagram. This PPT contains the concept of process flow. Use this PPT and build an excellent presentation for business and sales process related topics.
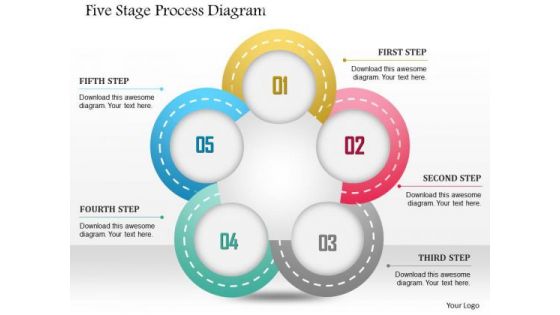
Business Diagram Five Stage Process Diagram Presentation Template
This power point template has been crafted with graphic of five stage process diagram. This process diagram is useful to display business process flow. Add this process diagram in your business presentations.
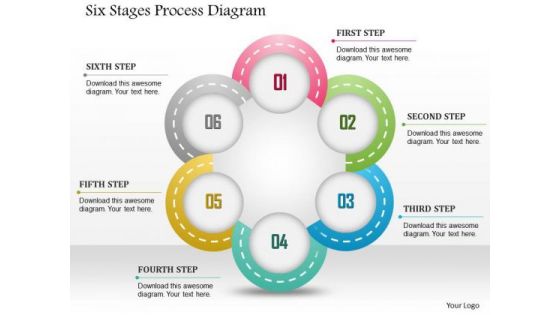
Business Diagram Six Stages Process Diagram Presentation Template
Six staged process diagram has been used to design this power point template. This template contains the concept of process flow. Use this PPT in your presentations and create a professional presentations.
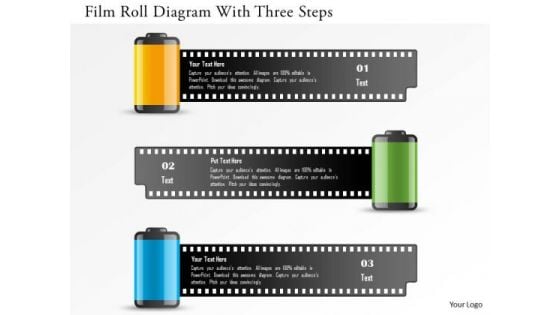
Business Diagram Film Roll Diagram With Three Steps Presentation Template
This power point template has been crafted with graphic of three film roll graphics. This PPT contains the concept of data flow. Use this PPT for your data related presentations.
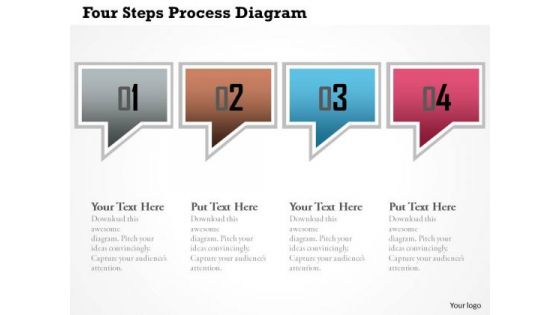
Business Diagram Four Steps Process Diagram Presentation Template
This power point template has been crafted with graphic of dialogue box. This PPT contains the concept of process and data flow. Use this PPT for your business and data related presentations.
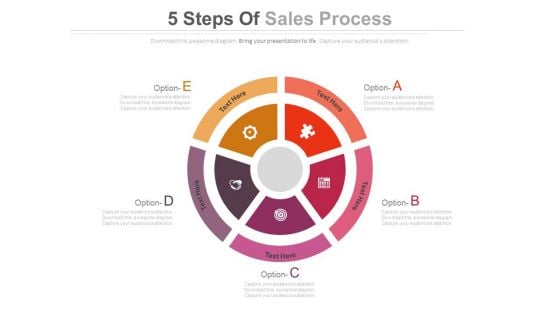
Five Options Circular Infographic Diagram Powerpoint Slides
This PowerPoint template has been designed with circular diagram and business icons. This PPT slide displays five business options in circular flow. Enlighten your viewers on the process with this innovative graphic.
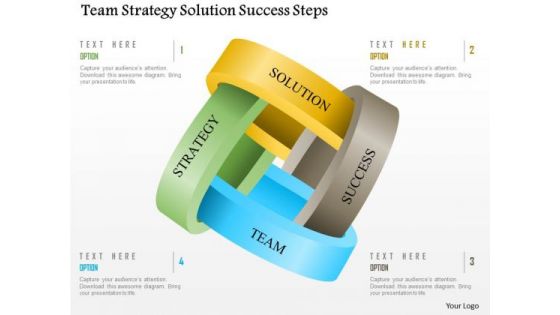
Business Diagram Team Strategy Solution Success Steps Presentation Template
Graphic of four dependent step process diagram has been used to craft this power point template. This PPT diagram contains the concept of process flow. Use this PPT for business and marketing related presentations.

Busines Diagram Three Staged Text Boxes For Data Representation Presentation Template
Three staged text boxes are used to design this business diagram. This slide helps to depict business process flow. This slide offers an excellent background to build professional presentations.
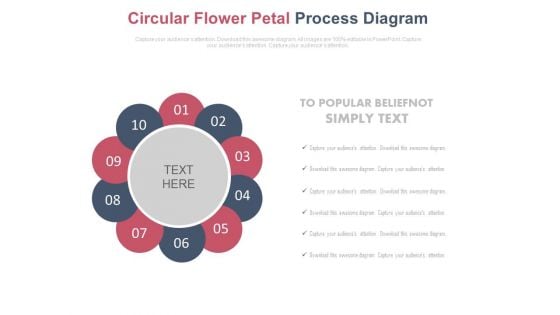
Ten Circular Petals Business Process Diagram Powerpoint Slides
This PowerPoint template has been designed with circular diagram. This PPT slide displays ten business steps in circular flow. You may download this PPT slide to display business process and workflow.
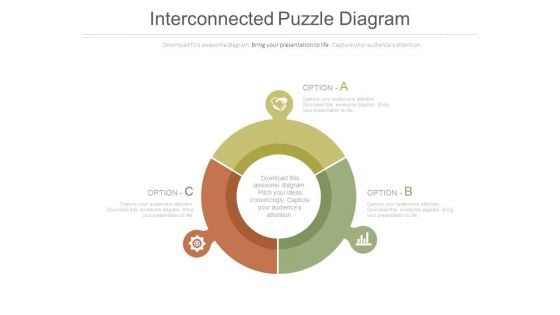
Circular Diagram With Three Sides Powerpoint Slides
This PowerPoint slide has been designed with graphics of circular diagram. This slide contains four steps with icons in circular flow. Enlighten your viewers on the process with this innovative graphic.
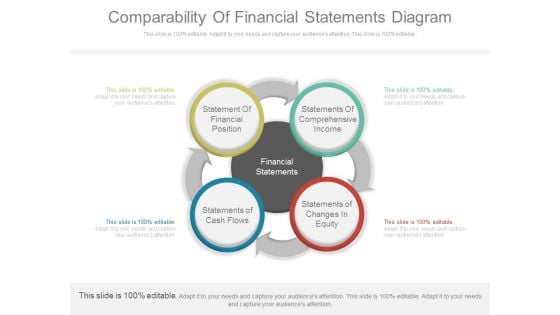
Comparability Of Financial Statements Diagram
This is a comparability of financial statements diagram. This is a four stage process. The stages in this process are statement of financial position, statements of comprehensive income, statements of cash flows, statements of changes in equity.
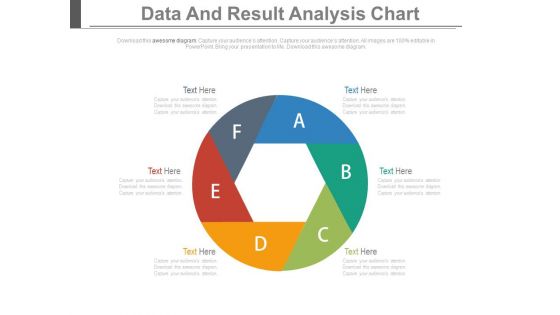
Circular Diagram Of Six Steps Powerpoint Slides
This PowerPoint slide has been designed with graphics of circular diagram. This slide contains six steps with alphabets in circular flow. Enlighten your viewers on the process with this innovative graphic.
Work Execution Liability Message From The Chief Financial Officer Ppt Icon Mockup PDF
The following slide provides an overview of the chief financial officers message that briefly introduces the clients to the annual financial performance along with major annual financial highlights. Deliver and pitch your topic in the best possible manner with this work execution liability message from the chief financial officer ppt icon mockup pdf. Use them to share invaluable insights on revenue, operating profit, cash flow, operating activities and impress your audience. This template can be altered and modified as per your expectations. So, grab it now.
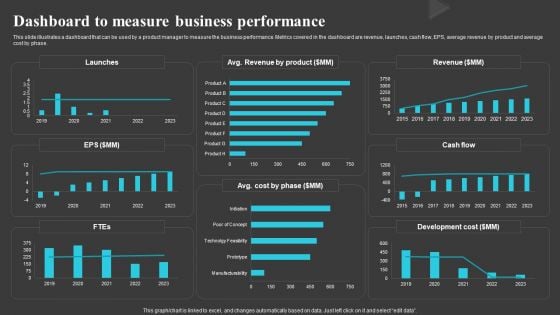
Dashboard To Measure Business Performance Creating And Offering Multiple Product Ranges In New Business Introduction PDF
This slide illustrates a dashboard that can be used by a product manager to measure the business performance. Metrics covered in the dashboard are revenue, launches, cash flow, EPS, average revenue by product and average cost by phase.There are so many reasons you need a Dashboard To Measure Business Performance Creating And Offering Multiple Product Ranges In New Business Introduction PDF. The first reason is you can notspend time making everything from scratch, Thus, Slidegeeks has made presentation templates for you too. You can easily download these templates from our website easily.
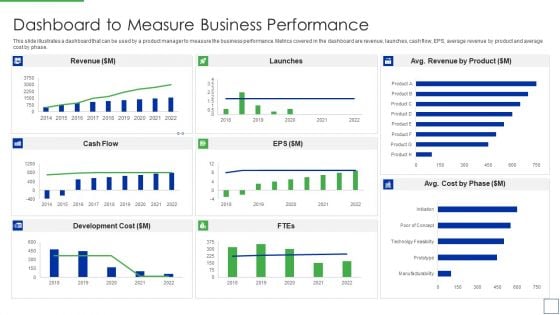
Product Portfolio Management For New Target Region Dashboard To Measure Business Rules PDF
This slide illustrates a dashboard that can be used by a product manager to measure the business performance. Metrics covered in the dashboard are revenue, launches, cash flow, EPS, average revenue by product and average cost by phase.Deliver and pitch your topic in the best possible manner with this Product Portfolio Management For New Target Region Dashboard To Measure Business Rules PDF Use them to share invaluable insights on Dashboard to Measure Business Performance and impress your audience. This template can be altered and modified as per your expectations. So, grab it now.
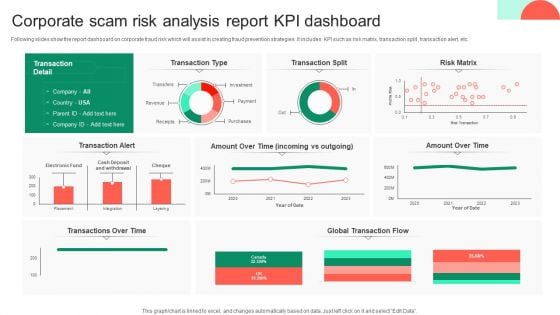
Corporate Scam Risk Analysis Report KPI Dashboard Themes PDF
Following slides show the report dashboard on corporate fraud risk which will assist in creating fraud prevention strategies .It includes KPI such as risk matrix, transaction split , transaction alert, etc. Pitch your topic with ease and precision using this Corporate Scam Risk Analysis Report KPI Dashboard Themes PDF. This layout presents information on Global Transaction Flow, Risk Matrix, Transaction Split, Analysis Report Kpi Dashboard. It is also available for immediate download and adjustment. So, changes can be made in the color, design, graphics or any other component to create a unique layout.
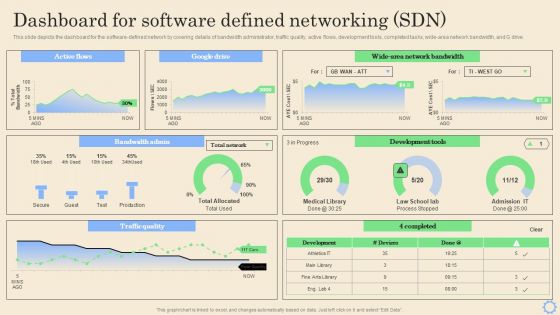
Software Defined Networking Development Strategies Dashboard For Software Defined Networking Sdn Infographics PDF
This slide depicts the dashboard for the software-defined network by covering details of bandwidth administrator, traffic quality, active flows, development tools, completed tasks, wide-area network bandwidth, and G drive. Find a pre designed and impeccable Software Defined Networking Development Strategies Dashboard For Software Defined Networking Sdn Infographics PDF. The templates can ace your presentation without additional effort. You can download these easy to edit presentation templates to make your presentation stand out from others. So, what are you waiting for Download the template from Slidegeeks today and give a unique touch to your presentation.
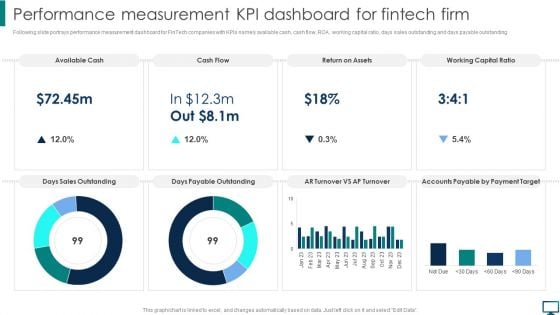
Performance Measurement KPI Dashboard For Fintech Firm Topics PDF
Following slide portrays performance measurement dashboard for FinTech companies with KPIs namely available cash, cash flow, ROA, working capital ratio, days sales outstanding and days payable outstanding. Create an editable Performance Measurement KPI Dashboard For Fintech Firm Topics PDF that communicates your idea and engages your audience. Whether you are presenting a business or an educational presentation, pre designed presentation templates help save time. Performance Measurement KPI Dashboard For Fintech Firm Topics PDF is highly customizable and very easy to edit, covering many different styles from creative to business presentations. Slidegeeks has creative team members who have crafted amazing templates. So, go and get them without any delay.
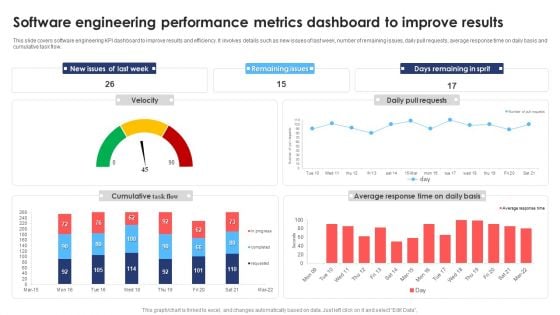
Software Engineering Performance Metrics Dashboard To Improve Results Infographics PDF
This slide covers software engineering KPI dashboard to improve results and efficiency. It involves details such as new issues of last week, number of remaining issues, daily pull requests, average response time on daily basis and cumulative task flow. Pitch your topic with ease and precision using this Software Engineering Performance Metrics Dashboard To Improve Results Infographics PDF. This layout presents information on Software Engineering Performance, Metrics Dashboard Improve Results. It is also available for immediate download and adjustment. So, changes can be made in the color, design, graphics or any other component to create a unique layout.
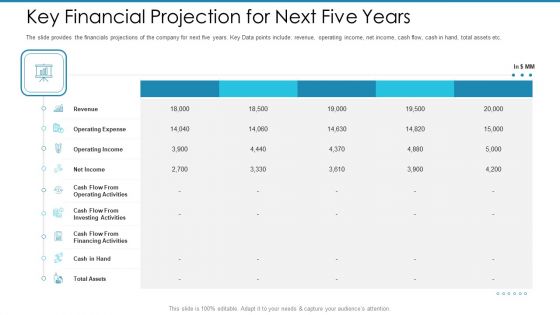
Post Initial Pubic Offering Market Pitch Deck Key Financial Projection For Next Five Years Information PDF
The slide provides the financials projections of the company for next five years. Key Data points include revenue, operating income, net income, cash flow, cash in hand, total assets etc.Deliver and pitch your topic in the best possible manner with this post initial pubic offering market pitch deck key financial projection for next five years information pdf. Use them to share invaluable insights on operating expense, 2019 to 2023, net income, and impress your audience. This template can be altered and modified as per your expectations. So, grab it now.
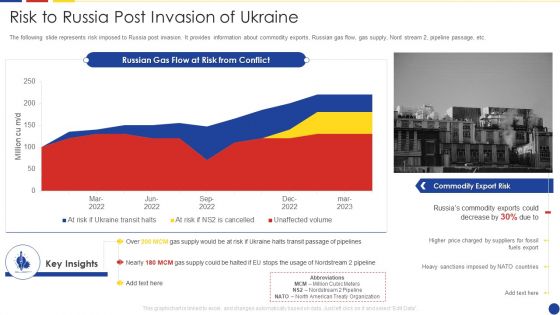
Analyzing The Impact Of Russia Ukraine Conflict On Gas Sector Risk To Russia Post Invasion Of Ukraine Designs PDF
The following slide represents risk imposed to Russia post invasion. It provides information about commodity exports, Russian gas flow, gas supply, Nord stream 2, pipeline passage, etc. Deliver and pitch your topic in the best possible manner with this analyzing the impact of russia ukraine conflict on gas sector risk to russia post invasion of ukraine designs pdf. Use them to share invaluable insights on risk to russia post invasion of ukraine and impress your audience. This template can be altered and modified as per your expectations. So, grab it now.
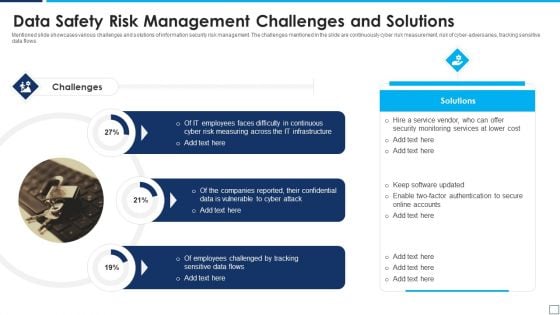
Data Safety Risk Management Challenges And Solutions Clipart PDF
Mentioned slide showcases various challenges and solutions of information security risk management. The challenges mentioned in the slide are continuously cyber risk measurement, risk of cyber-adversaries, tracking sensitive data flows. Showcasing this set of slides titled y risk management challenges and solutions clipart pdf. The topics addressed in these templates are data safety risk management challenges and solutions. All the content presented in this PPT design is completely editable. Download it and make adjustments in color, background, font etc. as per your unique business setting.
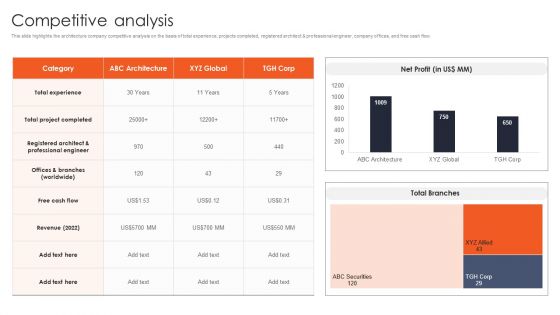
International Design And Architecture Firm Competitive Analysis Slides PDF
This slide highlights the architecture company competitive analysis on the basis of total experience, projects completed, registered architect and professional engineer, company offices, and free cash flow. This International Design And Architecture Firm Competitive Analysis Slides PDF is perfect for any presentation, be it in front of clients or colleagues. It is a versatile and stylish solution for organizing your meetings. The International Design And Architecture Firm Competitive Analysis Slides PDF features a modern design for your presentation meetings. The adjustable and customizable slides provide unlimited possibilities for acing up your presentation. Slidegeeks has done all the homework before launching the product for you. So, dont wait, grab the presentation templates today.
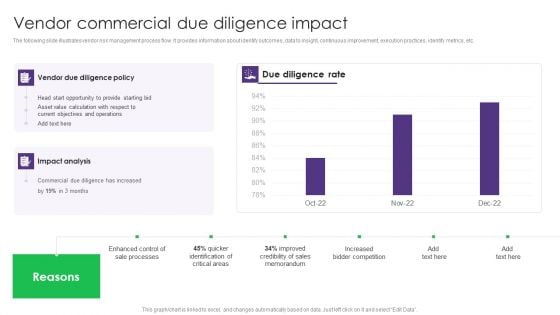
Vendor Commercial Due Diligence Impact Vendor Management System Deployment Infographics PDF
The following slide illustrates vendor risk management process flow. It provides information about identify outcomes, data to insight, continuous improvement, execution practices, identify metrics, etc. The Vendor Commercial Due Diligence Impact Vendor Management System Deployment Infographics PDF is a compilation of the most recent design trends as a series of slides. It is suitable for any subject or industry presentation, containing attractive visuals and photo spots for businesses to clearly express their messages. This template contains a variety of slides for the user to input data, such as structures to contrast two elements, bullet points, and slides for written information. Slidegeeks is prepared to create an impression.
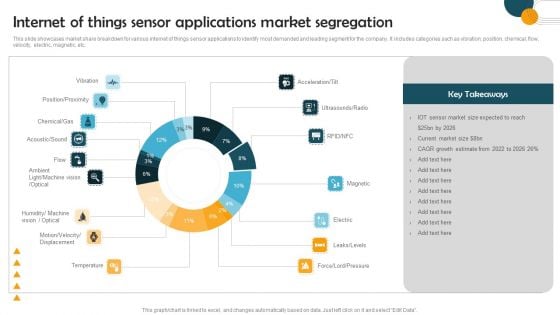
Internet Of Things Sensor Applications Market Segregation Sample PDF
This slide showcases market share breakdown for various internet of things sensor applications to identify most demanded and leading segment for the company. It includes categories such as vibration, position, chemical, flow, velocity, electric, magnetic, etc. Showcasing this set of slides titled Internet Of Things Sensor Applications Market Segregation Sample PDF. The topics addressed in these templates are Internet Things Sensor, Applications Market Segregation. All the content presented in this PPT design is completely editable. Download it and make adjustments in color, background, font etc. as per your unique business setting.
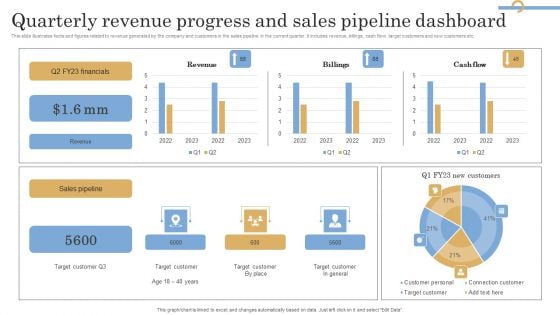
Quarterly Revenue Progress And Sales Pipeline Dashboard Information PDF
This slide illustrates facts and figures related to revenue generated by the company and customers in the sales pipeline in the current quarter. It includes revenue, billings, cash flow, target customers and new customers etc. Showcasing this set of slides titled Quarterly Revenue Progress And Sales Pipeline Dashboard Information PDF. The topics addressed in these templates are Financials, Revenue, Sales Pipeline. All the content presented in this PPT design is completely editable. Download it and make adjustments in color, background, font etc. as per your unique business setting.
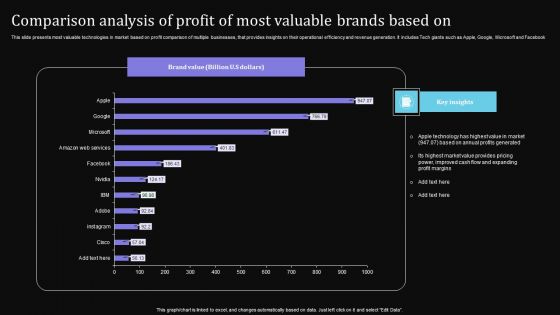
Comparison Analysis Of Profit Of Most Valuable Brands Based On Pictures PDF
This slide presents most valuable technologies in market based on profit comparison of multiple businesses, that provides insights on their operational efficiency and revenue generation. It includes Tech giants such as Apple, Google, Microsoft and Facebook. Showcasing this set of slides titled Comparison Analysis Of Profit Of Most Valuable Brands Based On Pictures PDF. The topics addressed in these templates are Apple Technology, Annual Profits Generated, Improved Cash Flow. All the content presented in this PPT design is completely editable. Download it and make adjustments in color, background, font etc. as per your unique business setting.
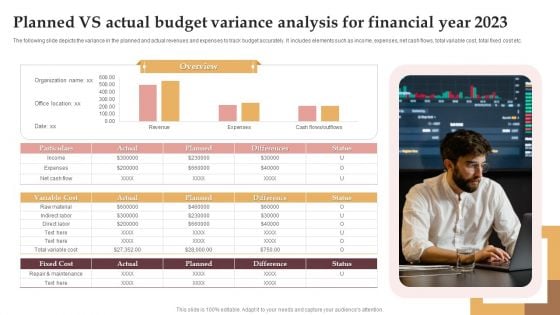
Planned Vs Actual Budget Variance Analysis For Financial Year 2023 Inspiration PDF
The following slide depicts the variance in the planned and actual revenues and expenses to track budget accurately. It includes elements such as income, expenses, net cash flows, total variable cost, total fixed cost etc. Pitch your topic with ease and precision using this Planned Vs Actual Budget Variance Analysis For Financial Year 2023 Inspiration PDF. This layout presents information on Budget Variance Analysis, Variable Cost, Fixed Cost. It is also available for immediate download and adjustment. So, changes can be made in the color, design, graphics or any other component to create a unique layout.
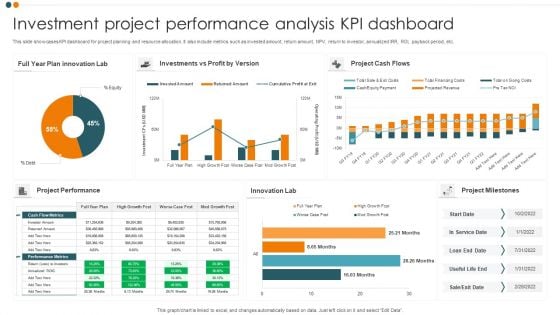
Investment Project Performance Analysis KPI Dashboard Professional PDF
This slide showcases KPI dashboard for project planning and resource allocation. It also include metrics such as invested amount, return amount, NPV, return to investor, annualized IRR, ROI, payback period, etc. Pitch your topic with ease and precision using this Investment Project Performance Analysis KPI Dashboard Professional PDF. This layout presents information on Project Cash Flows, Project Performance, Innovation Lab. It is also available for immediate download and adjustment. So, changes can be made in the color, design, graphics or any other component to create a unique layout.
Failure Methods And Effects Assessments FMEA Organization Structure Of FMEA Team Icons PDF
This slide provides the organization or hierarchy chart of FMEA Team. It includes head of the team and 6 team members 2 each from 3 different departments. This is a failure methods and effects assessments fmea organization structure of fmea team icons pdf template with various stages. Focus and dispense information on two stages using this creative set, that comes with editable features. It contains large content boxes to add your information on topics like manufacturing team, quality control team, designing. You can also showcase facts, figures, and other relevant content using this PPT layout. Grab it now.
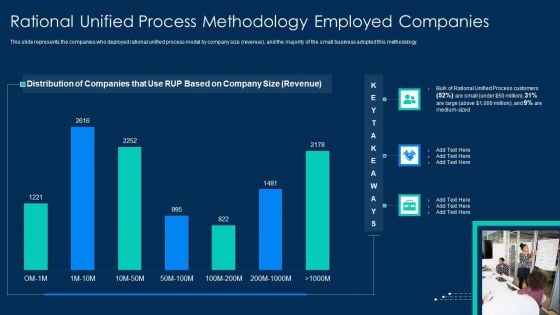
RUP Methodology Rational Unified Process Methodology Employed Companies Ideas PDF
This slide represents the companies who deployed rational unified process model by company size revenue, and the majority of the small business adopted this methodology.Deliver an awe inspiring pitch with this creative RUP Methodology Rational Unified Process Methodology Employed Companies Ideas PDF bundle. Topics like Rational Unified Process Methodology Employed Companies can be discussed with this completely editable template. It is available for immediate download depending on the needs and requirements of the user.

Ppt Background Vertical Steps For Free Idea Strategy 3 Design
We present our PPT Background vertical Steps for free idea strategy 3 design. Use our Circle Charts PowerPoint Templates because, this template with an image of helps you chart the course of your presentation. Use our Arrows PowerPoint Templates because, the basic stages are in place, you need to build upon them with our PowerPoint templates. Use our Communication PowerPoint Templates because; Employ the right colors for your brilliant ideas. Use our Layers PowerPoint Templates because; Outline your targets to your team. Use our Business PowerPoint Templates because, Marketing Strategy Business Template:- Maximizing sales of your product is the intended destination. Use these PowerPoint slides for presentations relating to background, blog, business, chain, communication, community, concept, connection, constructive, contact, design, flow, interaction, internet, line, linear, location, logistic, modern, movement, network, path, pointer, reaction, structure, system, team, . The prominent colors used in the PowerPoint template are Green, Gray, and Black There is never a dull moment with our Ppt Background Vertical Steps For Free Idea Strategy 3 Design. They keep it going at fever pitch.
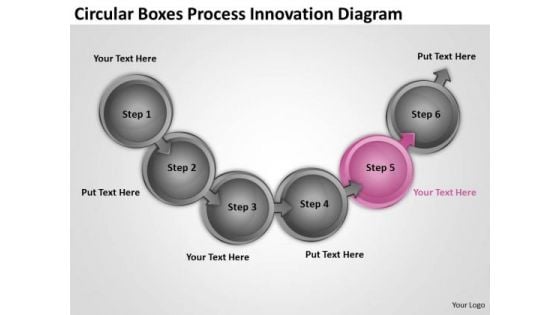
Circular Boxes Process Innovation Diagram Flowchart Of Business Plan PowerPoint Templates
We present our circular boxes process innovation diagram flowchart of business plan PowerPoint templates.Present our Marketing PowerPoint Templates because Our PowerPoint Templates and Slides are created with admirable insight. Use them and give your group a sense of your logical mind. Download our Busines PowerPoint Templates because this diagram helps you to discuss each step slowly but surely move up the pyramid narrowing down to the best and most success oriented project. Download our Circle Charts PowerPoint Templates because this helps you to put all your brilliant views to your audience. Download our Arrows PowerPoint Templates because so that you can Lead the way to spread good cheer to one and all. Download our Spheres PowerPoint Templates because honesty is the best policy has an ardent follower in you.Use these PowerPoint slides for presentations relating to Arrow, Business, Chain, Chart, Circle, Circle, Frame, Color, Concept, Connect, Connection, Connectivity, Corporate, Data, Design, Diagram, Financial, Flow, Flowchart, Graph, Graphical, Group, Important, Organization, Organize, Plan, Process, Rectangle, Relation, Set, Steps, Structure, Teamwork. The prominent colors used in the PowerPoint template are Pink, Gray, Black. Customers tell us our circular boxes process innovation diagram flowchart of business plan PowerPoint templates are Nifty. You can be sure our Chart PowerPoint templates and PPT Slides are Quaint. Presenters tell us our circular boxes process innovation diagram flowchart of business plan PowerPoint templates are No-nonsense. Professionals tell us our Chain PowerPoint templates and PPT Slides are Romantic. Presenters tell us our circular boxes process innovation diagram flowchart of business plan PowerPoint templates are Upbeat. Professionals tell us our Circle PowerPoint templates and PPT Slides are Cheerful. Our Circular Boxes Process Innovation Diagram Flowchart Of Business Plan PowerPoint Templates are geared for excellence. They will have your thoughts accelerating away.
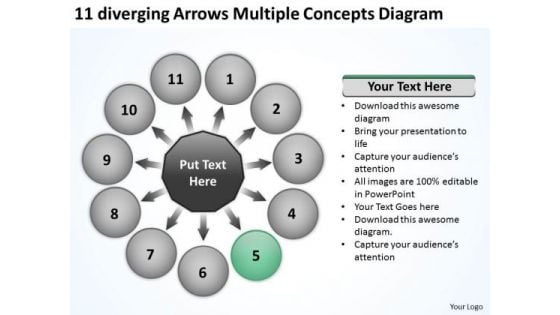
11 Diverging Arrows Multilple Concepts Diagram Circular Spoke Process PowerPoint Slides
We present our 11 diverging arrows multilple concepts diagram Circular Spoke Process PowerPoint Slides.Use our Shapes PowerPoint Templates because this slide helps you to communicate your concerns and educate your team along the path to success. Download our Ring Charts PowerPoint Templates because you can Lead your flock steadily to greater heights. Look around at the vast potential of achievement around you. Use our Business PowerPoint Templates because the majestic tiger lord of all it surveys.It exudes power even when it is in repose. Present our Marketing PowerPoint Templates because it explains the goals of each team and how you intend for each slice to contribute to the entire cake. Download and present our Future PowerPoint Templates because let this slide illustrates others piggyback on you to see well over the horizon.Use these PowerPoint slides for presentations relating to Arrow, blue, business, button,chart, collection, color, computer,concept, diagonal, direction, down,element, first, flowing, forward, future,graphic, group, growth, icon, increase,internet, isolated, leader, leadership,motion, moving, north, pole, progress,push, race, red, render, set, shape, shiny, sign . The prominent colors used in the PowerPoint template are Green dark , Gray, Black. You can be sure our 11 diverging arrows multilple concepts diagram Circular Spoke Process PowerPoint Slides are Royal. Professionals tell us our collection PowerPoint templates and PPT Slides will make the presenter look like a pro even if they are not computer savvy. PowerPoint presentation experts tell us our 11 diverging arrows multilple concepts diagram Circular Spoke Process PowerPoint Slides are second to none. You can be sure our computer PowerPoint templates and PPT Slides effectively help you save your valuable time. You can be sure our 11 diverging arrows multilple concepts diagram Circular Spoke Process PowerPoint Slides are Luxuriant. The feedback we get is that our chart PowerPoint templates and PPT Slides are Efficacious. Take control with our 11 Diverging Arrows Multilple Concepts Diagram Circular Spoke Process PowerPoint Slides. Do not be fatalistic in your approach.
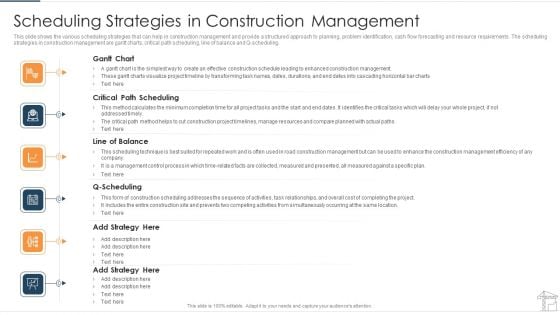
Scheduling Strategies In Construction Management Diagrams PDF
This slide shows the various scheduling strategies that can help in construction management and provide a structured approach to planning, problem identification, cash flow forecasting and resource requirements. The scheduling strategies in construction management are gantt charts, critical path scheduling, line of balance and Q-scheduling. Presenting scheduling strategies in construction management diagrams pdf to provide visual cues and insights. Share and navigate important information on six stages that need your due attention. This template can be used to pitch topics like critical path scheduling, line of balance, gantt chart. In addtion, this PPT design contains high resolution images, graphics, etc, that are easily editable and available for immediate download.
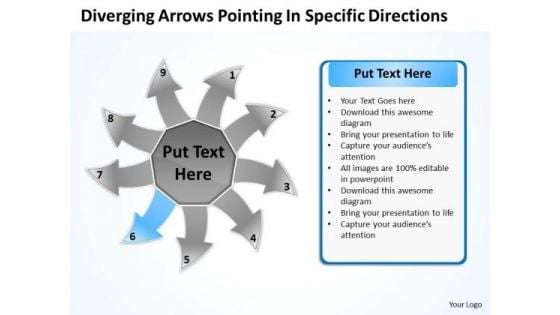
Diverging Arrows Pointing Specific Directions Circular Cycle Process PowerPoint Slides
We present our diverging arrows pointing specific directions circular Cycle Process PowerPoint Slides.Present our Communication PowerPoint Templates because you have a great training programme in mind to upgrade the skills of your staff. Download our Arrows PowerPoint Templates because you have the process in your head, our template design showing will illuminate your thoughts. Use our Circle Charts PowerPoint Templates because you can Signpost your preferred roadmap to your eager co- travellers and demonstrate clearly how you intend to navigate them towards the desired corporate goal. Download and present our Business PowerPoint Templates because this diagram can set an example to enthuse your team with the passion and fervour of your ideas. Use our Shapes PowerPoint Templates because your quicksilver ideas are the arrows in your quiver.Use these PowerPoint slides for presentations relating to Arrow, Bio, Business, Chart, Circle, Concept, Control, Cycle, Design, Development, Diagram, Eco, Ecology, Environmental, Evaluate, Flow, Flowchart, Fresh, Graphic, Green, Idea, Infographic, Iterative, Life, Lifecycle, Management, Method, Model, Natural, Nature, Organic, Process, Quality, Recycle, Research, Schema, Spiral, Step, Strategy, Success, System. The prominent colors used in the PowerPoint template are Blue, Gray, White. Customers tell us our diverging arrows pointing specific directions circular Cycle Process PowerPoint Slides are Fabulous. Customers tell us our Business PowerPoint templates and PPT Slides are Classic. Presenters tell us our diverging arrows pointing specific directions circular Cycle Process PowerPoint Slides are Graceful. PowerPoint presentation experts tell us our Circle PowerPoint templates and PPT Slides are Striking. Customers tell us our diverging arrows pointing specific directions circular Cycle Process PowerPoint Slides are Exuberant. Professionals tell us our Chart PowerPoint templates and PPT Slides are Amazing. Our Diverging Arrows Pointing Specific Directions Circular Cycle Process PowerPoint Slides take it from bud to bloom. Convert your idea into a booming business.
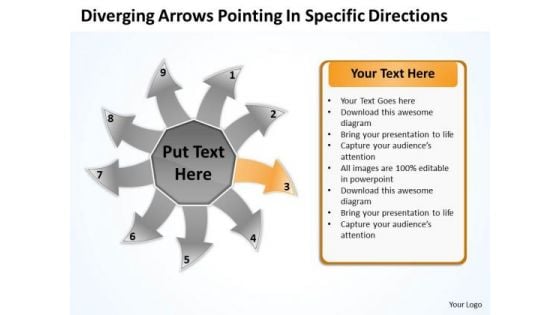
Diverging Arrows Pointing Specific Directions Cycle Process PowerPoint Slides
We present our diverging arrows pointing specific directions Cycle Process PowerPoint Slides.Download our Communication PowerPoint Templates because this is a wonderful graphics to see the smiles of happiness spread as your audience realizes the value of your words. Download and present our Arrows PowerPoint Templates because you have played a stellar role and have a few ideas. Download and present our Circle Charts PowerPoint Templates because it have all to represent to your viewers. Download our Business PowerPoint Templates because everybody knows The world over it is a priority for many. Along with it there are so many oppurtunities waiting to be utilised. Use our Shapes PowerPoint Templates because Our PowerPoint Templates and Slides are created with admirable insight. Use them and give your group a sense of your logical mind.Use these PowerPoint slides for presentations relating to Arrow, Bio, Business, Chart, Circle, Concept, Control, Cycle, Design, Development, Diagram, Eco, Ecology, Environmental, Evaluate, Flow, Flowchart, Fresh, Graphic, Green, Idea, Infographic, Iterative, Life, Lifecycle, Management, Method, Model, Natural, Nature, Organic, Process, Quality, Recycle, Research, Schema, Spiral, Step, Strategy, Success, System. The prominent colors used in the PowerPoint template are Yellow, Gray, White. Customers tell us our diverging arrows pointing specific directions Cycle Process PowerPoint Slides are Fashionable. Customers tell us our Control PowerPoint templates and PPT Slides are Detailed. Presenters tell us our diverging arrows pointing specific directions Cycle Process PowerPoint Slides are Reminiscent. PowerPoint presentation experts tell us our Chart PowerPoint templates and PPT Slides are Swanky. Customers tell us our diverging arrows pointing specific directions Cycle Process PowerPoint Slides are Efficient. Professionals tell us our Business PowerPoint templates and PPT Slides are Elevated. Examine the facts in all their combinations. Run the comb through with our Diverging Arrows Pointing Specific Directions Cycle Process PowerPoint Slides.
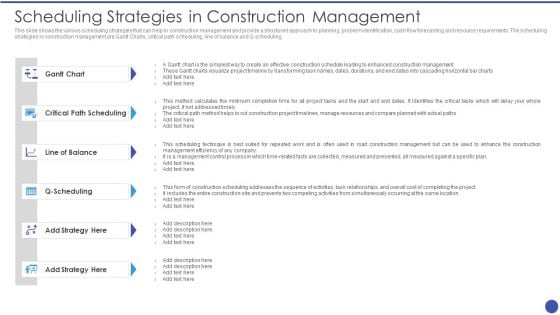
Management Techniques Scheduling Strategies In Construction Management Professional PDF
This slide shows the various scheduling strategies that can help in construction management and provide a structured approach to planning, problem identification, cash flow forecasting and resource requirements. The scheduling strategies in construction management are Gantt Charts, critical path scheduling, line of balance and Q-scheduling. Presenting Management Techniques Scheduling Strategies In Construction Management Professional PDF to provide visual cues and insights. Share and navigate important information on six stages that need your due attention. This template can be used to pitch topics like Gantt Chart, Critical Path Scheduling, Line Balance, Strategy. In addtion, this PPT design contains high resolution images, graphics, etc, that are easily editable and available for immediate download.
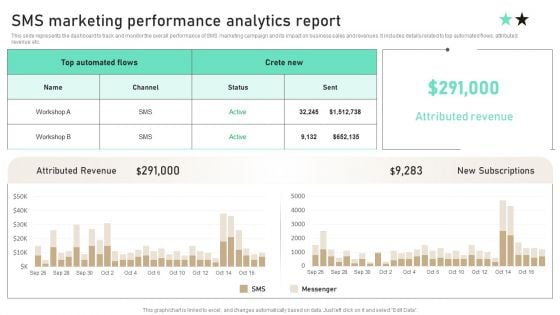
SMS Marketing Performance Analytics Report Ppt PowerPoint Presentation Diagram Templates PDF
This slide represents the dashboard to track and monitor the overall performance of SMS marketing campaign and its impact on business sales and revenues. It includes details related to top automated flows, attributed revenue etc. Slidegeeks is here to make your presentations a breeze with SMS Marketing Performance Analytics Report Ppt PowerPoint Presentation Diagram Templates PDF With our easy to use and customizable templates, you can focus on delivering your ideas rather than worrying about formatting. With a variety of designs to choose from, you are sure to find one that suits your needs. And with animations and unique photos, illustrations, and fonts, you can make your presentation pop. So whether you are giving a sales pitch or presenting to the board, make sure to check out Slidegeeks first.
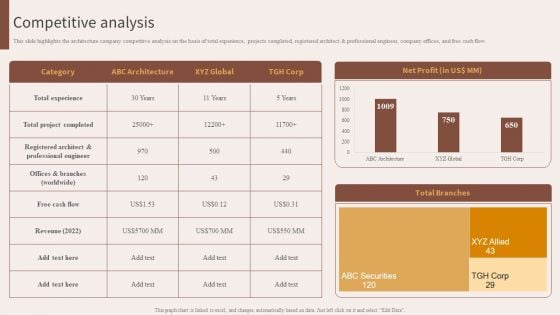
Architecture Engineering Planning Services Company Competitive Analysis Topics PDF
This slide highlights the architecture company competitive analysis on the basis of total experience, projects completed, registered architect and professional engineer, company offices, and free cash flow. Here you can discover an assortment of the finest PowerPoint and Google Slides templates. With these templates, you can create presentations for a variety of purposes while simultaneously providing your audience with an eye catching visual experience. Download Architecture Engineering Planning Services Company Competitive Analysis Topics PDF to deliver an impeccable presentation. These templates will make your job of preparing presentations much quicker, yet still, maintain a high level of quality. Slidegeeks has experienced researchers who prepare these templates and write high quality content for you. Later on, you can personalize the content by editing the Architecture Engineering Planning Services Company Competitive Analysis Topics PDF.
Dashboard For Software Defined Networking SDN Ppt Icon Samples PDF
This slide depicts the dashboard for the software-defined network by covering details of bandwidth administrator, traffic quality, active flows, development tools, completed tasks, wide-area network bandwidth, and G drive. Coming up with a presentation necessitates that the majority of the effort goes into the content and the message you intend to convey. The visuals of a PowerPoint presentation can only be effective if it supplements and supports the story that is being told. Keeping this in mind our experts created Dashboard For Software Defined Networking SDN Ppt Icon Samples PDF to reduce the time that goes into designing the presentation. This way, you can concentrate on the message while our designers take care of providing you with the right template for the situation.
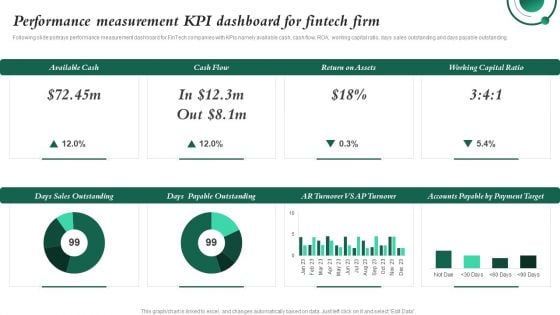
Performance Measurement KPI Dashboard For Fintech Firm Investment In Latest Technology To Ensure Portrait PDF
Following slide portrays performance measurement dashboard for FinTech companies with KPIs namely available cash, cash flow, ROA, working capital ratio, days sales outstanding and days payable outstanding.Whether you have daily or monthly meetings, a brilliant presentation is necessary. Performance Measurement KPI Dashboard For Fintech Firm Investment In Latest Technology To Ensure Portrait PDF can be your best option for delivering a presentation. Represent everything in detail using Performance Measurement KPI Dashboard For Fintech Firm Investment In Latest Technology To Ensure Portrait PDF and make yourself stand out in meetings. The template is versatile and follows a structure that will cater to your requirements. All the templates prepared by Slidegeeks are easy to download and edit. Our research experts have taken care of the corporate themes as well. So, give it a try and see the results.
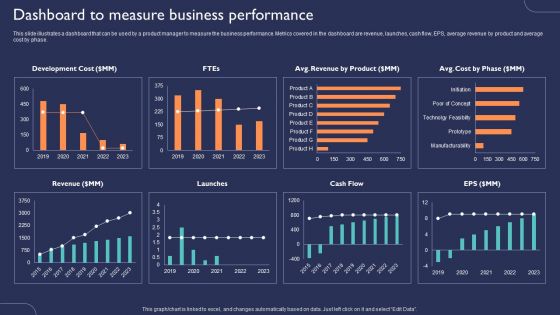
Introduction To New Product Portfolio Dashboard To Measure Business Performance Ppt Ideas Clipart Images PDF
This slide illustrates a dashboard that can be used by a product manager to measure the business performance. Metrics covered in the dashboard are revenue, launches, cash flow, EPS, average revenue by product and average cost by phase. Are you in need of a template that can accommodate all of your creative concepts. This one is crafted professionally and can be altered to fit any style. Use it with Google Slides or PowerPoint. Include striking photographs, symbols, depictions, and other visuals. Fill, move around, or remove text boxes as desired. Test out color palettes and font mixtures. Edit and save your work, or work with colleagues. Download Introduction To New Product Portfolio Dashboard To Measure Business Performance Ppt Ideas Clipart Images PDF and observe how to make your presentation outstanding. Give an impeccable presentation to your group and make your presentation unforgettable.
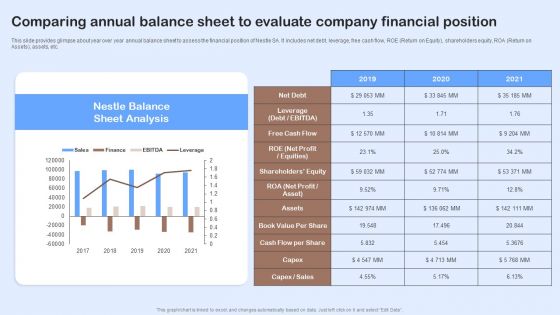
Nestle Performance Management Report Comparing Annual Balance Sheet To Evaluate Download PDF
This slide provides glimpse about year over year annual balance sheet to assess the financial position of Nestle SA. It includes net debt, leverage, free cash flow, ROE Return on Equity, shareholders equity, ROA Return on Assets, assets, etc. Do you have to make sure that everyone on your team knows about any specific topic I yes, then you should give Nestle Performance Management Report Comparing Annual Balance Sheet To Evaluate Download PDF a try. Our experts have put a lot of knowledge and effort into creating this impeccable Nestle Performance Management Report Comparing Annual Balance Sheet To Evaluate Download PDF. You can use this template for your upcoming presentations, as the slides are perfect to represent even the tiniest detail. You can download these templates from the Slidegeeks website and these are easy to edit. So grab these today.
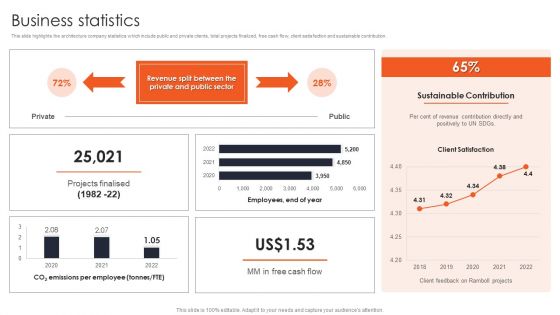
International Design And Architecture Firm Business Statistics Designs PDF
This slide highlights the architecture company statistics which include public and private clients, total projects finalized, free cash flow, client satisfaction and sustainable contribution. Are you in need of a template that can accommodate all of your creative concepts This one is crafted professionally and can be altered to fit any style. Use it with Google Slides or PowerPoint. Include striking photographs, symbols, depictions, and other visuals. Fill, move around, or remove text boxes as desired. Test out color palettes and font mixtures. Edit and save your work, or work with colleagues. Download International Design And Architecture Firm Business Statistics Designs PDF and observe how to make your presentation outstanding. Give an impeccable presentation to your group and make your presentation unforgettable.
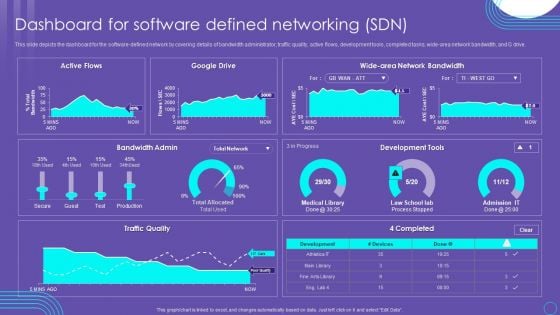
SDN Security Architecture Dashboard For Software Defined Networking SDN Mockup PDF
This slide depicts the dashboard for the software defined network by covering details of bandwidth administrator, traffic quality, active flows, development tools, completed tasks, wide area network bandwidth, and G drive. Coming up with a presentation necessitates that the majority of the effort goes into the content and the message you intend to convey. The visuals of a PowerPoint presentation can only be effective if it supplements and supports the story that is being told. Keeping this in mind our experts created SDN Security Architecture Dashboard For Software Defined Networking SDN Mockup PDF to reduce the time that goes into designing the presentation. This way, you can concentrate on the message while our designers take care of providing you with the right template for the situation.
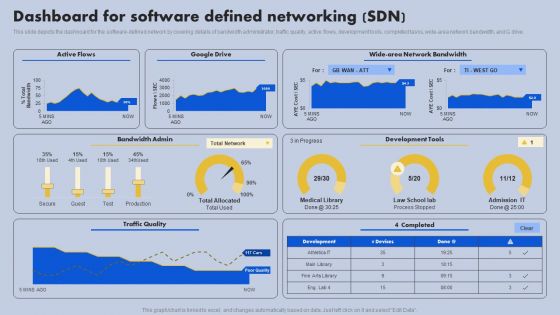
Dashboard For Software Defined Networking SDN Ppt Slides Images PDF
This slide depicts the dashboard for the software-defined network by covering details of bandwidth administrator, traffic quality, active flows, development tools, completed tasks, wide-area network bandwidth, and G drive. Coming up with a presentation necessitates that the majority of the effort goes into the content and the message you intend to convey. The visuals of a PowerPoint presentation can only be effective if it supplements and supports the story that is being told. Keeping this in mind our experts created Dashboard For Software Defined Networking SDN Ppt Slides Images PDF to reduce the time that goes into designing the presentation. This way, you can concentrate on the message while our designers take care of providing you with the right template for the situation.
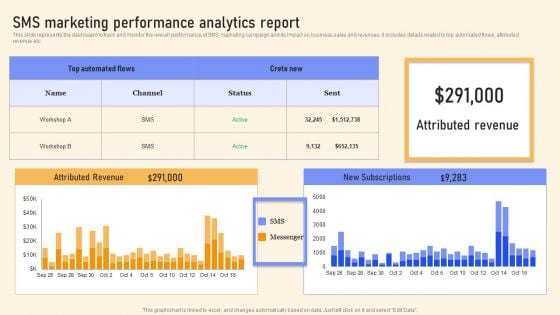
SMS Marketing Performance Analytics Report Ppt PowerPoint Presentation File Infographics PDF
This slide represents the dashboard to track and monitor the overall performance of SMS marketing campaign and its impact on business sales and revenues. It includes details related to top automated flows, attributed revenue etc. Slidegeeks is here to make your presentations a breeze with SMS Marketing Performance Analytics Report Ppt PowerPoint Presentation File Infographics PDF With our easy to use and customizable templates, you can focus on delivering your ideas rather than worrying about formatting. With a variety of designs to choose from, you are sure to find one that suits your needs. And with animations and unique photos, illustrations, and fonts, you can make your presentation pop. So whether you are giving a sales pitch or presenting to the board, make sure to check out Slidegeeks first.
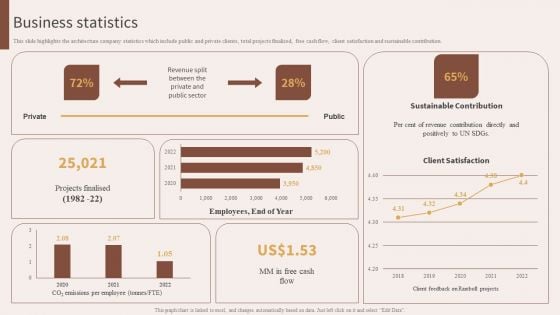
Architecture Engineering Planning Services Company Business Statistics Clipart PDF
This slide highlights the architecture company statistics which include public and private clients, total projects finalized, free cash flow, client satisfaction and sustainable contribution. Presenting this PowerPoint presentation, titled Architecture Engineering Planning Services Company Business Statistics Clipart PDF, with topics curated by our researchers after extensive research. This editable presentation is available for immediate download and provides attractive features when used. Download now and captivate your audience. Presenting this Architecture Engineering Planning Services Company Business Statistics Clipart PDF. Our researchers have carefully researched and created these slides with all aspects taken into consideration. This is a completely customizable Architecture Engineering Planning Services Company Business Statistics Clipart PDF that is available for immediate downloading. Download now and make an impact on your audience. Highlight the attractive features available with our PPTs.
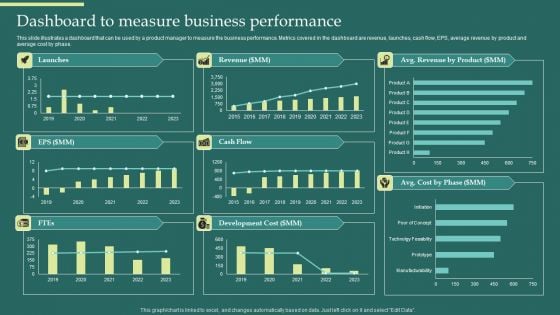
Product Portfolios And Strategic Dashboard To Measure Business Performance Portrait PDF
This slide illustrates a dashboard that can be used by a product manager to measure the business performance. Metrics covered in the dashboard are revenue, launches, cash flow, EPS, average revenue by product and average cost by phase. Do you have an important presentation coming up Are you looking for something that will make your presentation stand out from the rest Look no further than Product Portfolios And Strategic Dashboard To Measure Business Performance Portrait PDF. With our professional designs, you can trust that your presentation will pop and make delivering it a smooth process. And with Slidegeeks, you can trust that your presentation will be unique and memorable. So why wait Grab Product Portfolios And Strategic Dashboard To Measure Business Performance Portrait PDF today and make your presentation stand out from the rest.
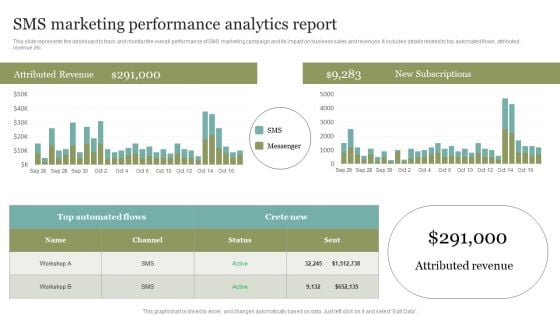
SMS Marketing Performance Analytics Report Summary PDF
This slide represents the dashboard to track and monitor the overall performance of SMS marketing campaign and its impact on business sales and revenues. It includes details related to top automated flows, attributed revenue etc. This SMS Marketing Performance Analytics Report Summary PDF from Slidegeeks makes it easy to present information on your topic with precision. It provides customization options, so you can make changes to the colors, design, graphics, or any other component to create a unique layout. It is also available for immediate download, so you can begin using it right away. Slidegeeks has done good research to ensure that you have everything you need to make your presentation stand out. Make a name out there for a brilliant performance.

Risk Based Methodology Fault Tree Analysis Method Infographics PDF
This slide covers quality risk management tool such as Fault-tree Analysis for obtaining understanding of the system and problems related to it. This Risk Based Methodology Fault Tree Analysis Method Infographics PDF is perfect for any presentation, be it in front of clients or colleagues. It is a versatile and stylish solution for organizing your meetings. The Risk Based Methodology Fault Tree Analysis Method Infographics PDF features a modern design for your presentation meetings. The adjustable and customizable slides provide unlimited possibilities for acing up your presentation. Slidegeeks has done all the homework before launching the product for you. So, do not wait, grab the presentation templates today
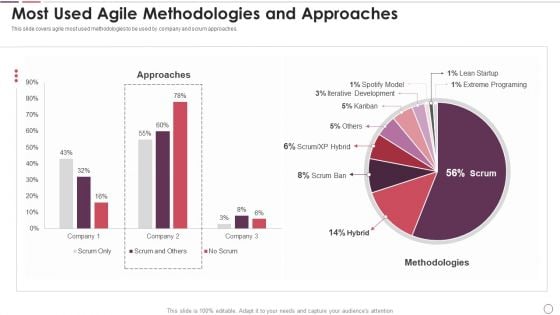
Agile Methodology In Project Management IT Most Used Agile Methodologies And Approaches Inspiration PDF
This slide covers agile most used methodologies to be used by company and scrum approaches. Deliver and pitch your topic in the best possible manner with this agile methodology in project management it most used agile methodologies and approaches inspiration pdf. Use them to share invaluable insights on most used agile methodologies and approaches and impress your audience. This template can be altered and modified as per your expectations. So, grab it now.


 Continue with Email

 Home
Home


