Floor Plan

break even analysis for cost control ppt powerpoint presentation summary
This is a break even analysis for cost control ppt powerpoint presentation summary. This is a four stage process. The stages in this process are break even point,break even analysis,break even level break even point,break even analysis,break even level.
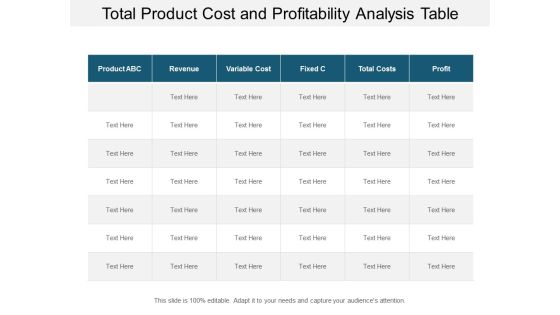
total product cost and profitability analysis table ppt powerpoint presentation summary grid
This is a total product cost and profitability analysis table ppt powerpoint presentation summary grid. This is a six stage process. The stages in this process are break even point,break even analysis,break even level.

Clustered Column Line Investment Ppt PowerPoint Presentation Styles Smartart
This is a clustered column line investment ppt powerpoint presentation styles smartart. This is a three stage process. The stages in this process are finance, analysis, business, investment, marketing.
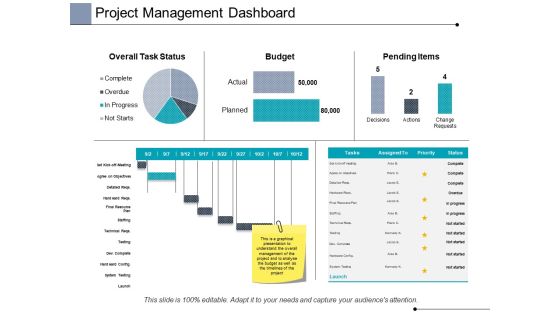
Project Management Dashboard Ppt PowerPoint Presentation Infographic Template Graphics
This is a project management dashboard ppt powerpoint presentation infographic template graphics. This is a three stage process. The stages in this process are finance, analysis, business, investment, marketing.

Bar Graph Product Ppt PowerPoint Presentation Model Graphic Tips
This is a bar graph product ppt powerpoint presentation model graphic tips. This is a three stage process. The stages in this process are product, percentage, business, management, marketing.

Comparison Male And Female Ppt PowerPoint Presentation Professional Skills
This is a comparison male and female ppt powerpoint presentation professional skills. This is a two stage process. The stages in this process are product, percentage, business, management, marketing.
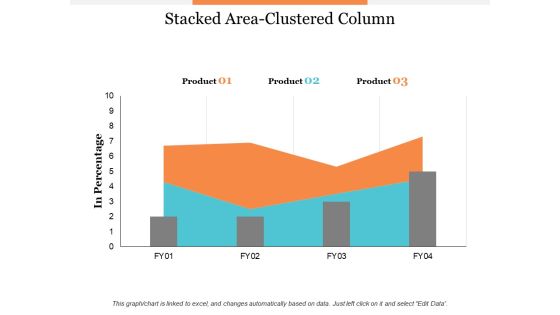
Stacked Area Clustered Column Ppt PowerPoint Presentation Infographic Template Summary
This is a stacked area clustered column ppt powerpoint presentation infographic template summary. This is a three stage process. The stages in this process are business, management, marketing, percentage, product.
Project Management Dashboard Finance Ppt PowerPoint Presentation Styles Icons
This is a project management dashboard finance ppt powerpoint presentation styles icons. This is a three stage process. The stages in this process are finance, analysis, business, investment, marketing.

Area Graph Showing Sales Trends Over Time Ppt PowerPoint Presentation Model Background Designs
This is a area graph showing sales trends over time ppt powerpoint presentation model background designs. This is a three stage process. The stages in this process are financial analysis, quantitative, statistical modelling.

Bar Graph Icon For Data Analysis Ppt PowerPoint Presentation Pictures Ideas
This is a bar graph icon for data analysis ppt powerpoint presentation pictures ideas. This is a four stage process. The stages in this process are financial analysis, quantitative, statistical modelling.
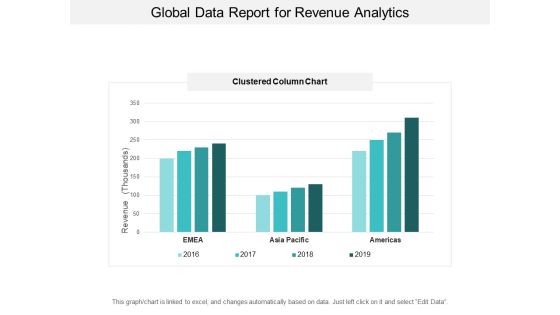
Global Data Report For Revenue Analytics Ppt PowerPoint Presentation Inspiration Visuals
This is a global data report for revenue analytics ppt powerpoint presentation inspiration visuals. This is a four stage process. The stages in this process are financial analysis, quantitative, statistical modelling.

Quarterly Financial Performance Ratio Analysis Ppt PowerPoint Presentation Model Format Ideas
This is a quarterly financial performance ratio analysis ppt powerpoint presentation model format ideas. This is a four stage process. The stages in this process are financial analysis, quantitative, statistical modelling.

January 2000 July 2013 Marketing Ppt PowerPoint Presentation File Slide Download
This is a january 2000 july 2013 marketing ppt powerpoint presentation file slide download. This is a four stage process. The stages in this process are finance, analysis, business, investment, marketing.

Marketing Return On Investment Ppt PowerPoint Presentation Infographics Files
This is a marketing return on investment ppt powerpoint presentation infographics files. This is a three stage process. The stages in this process are marketing investment, impressions, return on investment, finance, marketing.

Clustered Bar Investment Ppt Powerpoint Presentation Gallery Clipart
This is a clustered bar investment ppt powerpoint presentation gallery clipart. This is a three stage process. The stages in this process are clustered bar, finance, marketing, management, analysis.

Effective Management Virtual Teams Ppt PowerPoint Presentation Infographics Ideas Cpb
This is a effective management virtual teams ppt powerpoint presentation infographics ideas cpb. This is a six stage process. The stages in this process are effective management virtual teams.

Stacked Area Clustered Column Ppt PowerPoint Presentation Model Slides
This is a stacked area clustered column ppt powerpoint presentation model slides. This is a three stage process. The stages in this process are business, management, percentage, product, marketing.
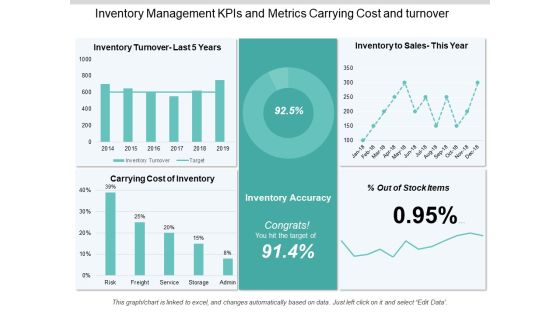
Inventory Management Kpis And Metrics Carrying Cost And Turnover Ppt PowerPoint Presentation Information
This is a inventory management kpis and metrics carrying cost and turnover ppt powerpoint presentation information. This is a five stage process. The stages in this process are logistics performance, logistics dashboard, logistics kpis.

Key Performance Indicators In Supply Chain Order Accuracy And Cycle Time Ppt PowerPoint Presentation Infographics Slideshow
This is a key performance indicators in supply chain order accuracy and cycle time ppt powerpoint presentation infographics slideshow. This is a two stage process. The stages in this process are logistics performance, logistics dashboard, logistics kpis.

Kpis In Shipping Perfect Order Rate And On Time Shipment Ppt PowerPoint Presentation Show Guide
This is a kpis in shipping perfect order rate and on time shipment ppt powerpoint presentation show guide. This is a six stage process. The stages in this process are logistics performance, logistics dashboard, logistics kpis.
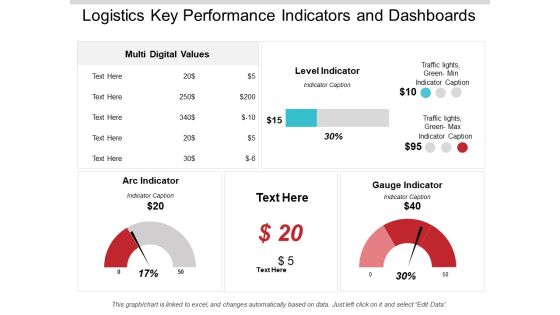
Logistics Key Performance Indicators And Dashboards Ppt PowerPoint Presentation Infographics Background Image
This is a logistics key performance indicators and dashboards ppt powerpoint presentation infographics background image. This is a three stage process. The stages in this process are logistics performance, logistics dashboard, logistics kpis.
Logistics Kpis And Metrics Percentage Of Orders Delivered Ppt PowerPoint Presentation Icon
This is a logistics kpis and metrics percentage of orders delivered ppt powerpoint presentation icon. This is a five stage process. The stages in this process are logistics performance, logistics dashboard, logistics kpis.
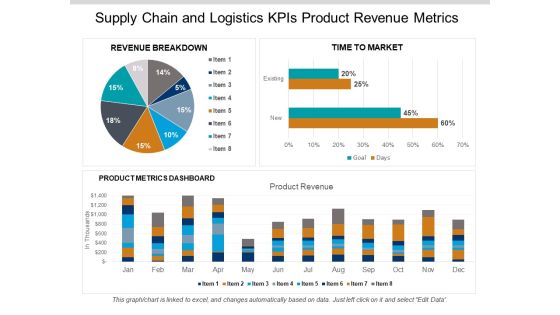
Supply Chain And Logistics Kpis Product Revenue Metrics Ppt PowerPoint Presentation Gallery Aids
This is a supply chain and logistics kpis product revenue metrics ppt powerpoint presentation gallery aids. This is a three stage process. The stages in this process are logistics performance, logistics dashboard, logistics kpis.
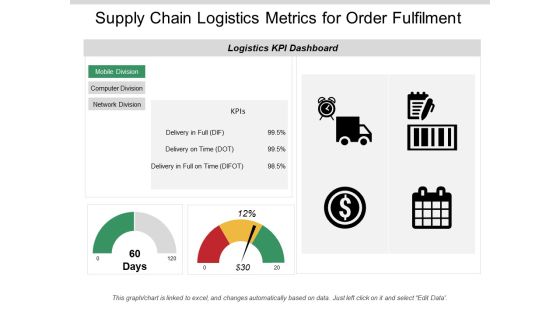
Supply Chain Logistics Metrics For Order Fulfilment Ppt PowerPoint Presentation Infographic Template Information
This is a supply chain logistics metrics for order fulfilment ppt powerpoint presentation infographic template information. This is a two stage process. The stages in this process are logistics performance, logistics dashboard, logistics kpis.

Supply Chain Metrics Fleet Efficiency Loading Time And Weight Ppt PowerPoint Presentation Portfolio Guidelines
This is a supply chain metrics fleet efficiency loading time and weight ppt powerpoint presentation portfolio guidelines. This is a four stage process. The stages in this process are logistics performance, logistics dashboard, logistics kpis.

Customer Satisfaction Levels High Medium Low Indicator Dashboard Ppt PowerPoint Presentation Icon Show
This is a customer satisfaction levels high medium low indicator dashboard ppt powerpoint presentation icon show. This is a six stage process. The stages in this process are performance dashboard, performance meter, performance kpi.

Dashboard Vector With Pointer And Text Holders Ppt PowerPoint Presentation Portfolio Format Ideas
This is a dashboard vector with pointer and text holders ppt powerpoint presentation portfolio format ideas. This is a four stage process. The stages in this process are performance dashboard, performance meter, performance kpi.

Dashboards For Performance Mapping And Management Ppt PowerPoint Presentation Ideas File Formats
This is a dashboards for performance mapping and management ppt powerpoint presentation ideas file formats. This is a four stage process. The stages in this process are performance dashboard, performance meter, performance kpi.

KPI Dashboards And Operational Metrics Ppt PowerPoint Presentation Portfolio Infographics

Low High Performance Measurement Indicator Dashboard Ppt PowerPoint Presentation Summary Images
This is a low high performance measurement indicator dashboard ppt powerpoint presentation summary images. This is a five stage process. The stages in this process are performance dashboard, performance meter, performance kpi.

100 Percent Stacked Bar Finance Ppt PowerPoint Presentation Model Templates
This is a 100 percent stacked bar finance ppt powerpoint presentation model templates. This is a three stage process. The stages in this process are finance, analysis, business, investment, marketing.

Open High Low Close Ppt PowerPoint Presentation Slides Guidelines
This is a open high low close ppt powerpoint presentation slides guidelines. This is a two stage process. The stages in this process are finance, analysis, business, investment, marketing.
Retail Competition Ppt PowerPoint Presentation Icon Microsoft
This is a retail competition ppt powerpoint presentation icon microsoft. This is a six stage process. The stages in this process are customer service, shipping speed, product quality, price, product fidelity.

Retail Global Trends Comparing Online Ppt PowerPoint Presentation Infographics Guide
This is a retail global trends comparing online ppt powerpoint presentation infographics guide. This is a two stage process. The stages in this process are finance, analysis, business, investment, marketing.

Retail KPI Dashboard Showing Revenue Vs Units Sold Ppt PowerPoint Presentation Professional Smartart
This is a retail kpi dashboard showing revenue vs units sold ppt powerpoint presentation professional smartart. This is a four stage process. The stages in this process are finance, analysis, business, investment, marketing.

Retail KPI Dashboard Showing Sales Revenue Customers Ppt PowerPoint Presentation Show Background Designs
This is a retail kpi dashboard showing sales revenue customers ppt powerpoint presentation show background designs. This is a six stage process. The stages in this process are finance, analysis, business, investment, marketing.
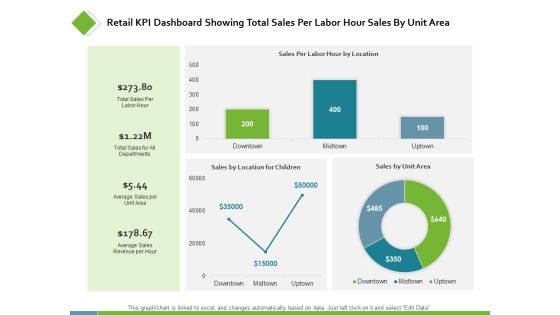
Retail KPI Dashboard Showing Total Sales Per Labor Ppt PowerPoint Presentation Styles Examples
This is a retail kpi dashboard showing total sales per labor ppt powerpoint presentation styles examples. This is a three stage process. The stages in this process are finance, analysis, business, investment, marketing.
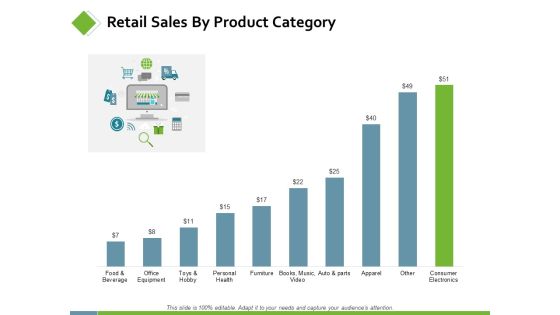
Retail Sales By Product Category Ppt PowerPoint Presentation Infographic Template Images
This is a retail sales by product category ppt powerpoint presentation infographic template images. This is a two stage process. The stages in this process are finance, analysis, business, investment, marketing.
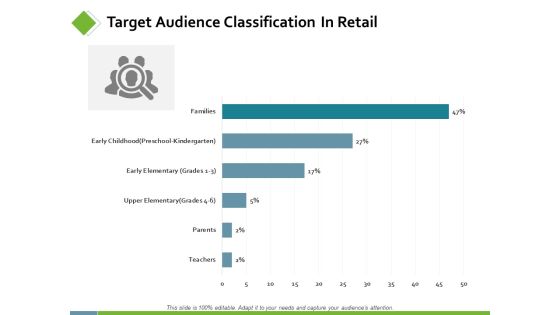
Target Audience Classification In Retail Ppt PowerPoint Presentation Summary Infographics
This is a target audience classification in retail ppt powerpoint presentation summary infographics. This is a two stage process. The stages in this process are finance, analysis, business, investment, marketing.
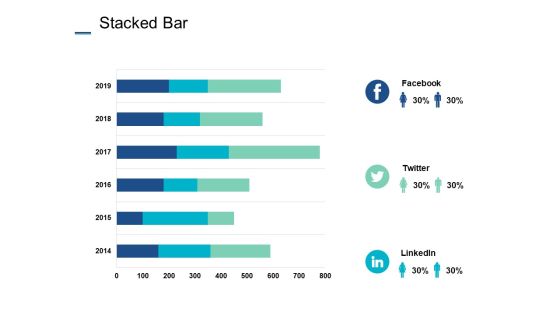
Stacked Bar Investment Ppt PowerPoint Presentation Ideas Graphics Tutorials
This is a stacked bar investment ppt powerpoint presentation ideas graphics tutorials. This is a three stage process. The stages in this process are stacked bar, finance, marketing, analysis, business, investment.

Cost Performance Index Ppt PowerPoint Presentation Infographics Mockup
This is a cost performance index ppt powerpoint presentation infographics mockup. This is a three stage process. The stages in this process are finance, marketing, management, investment, product, percentage.
Employee Weekly Efficiency Dashboard Ppt PowerPoint Presentation Icon Backgrounds
This is a employee weekly efficiency dashboard ppt powerpoint presentation icon backgrounds. This is a four stage process. The stages in this process are finance, analysis, business, investment, marketing.

Project Health Card Business Ppt PowerPoint Presentation Summary Samples
This is a project health card business ppt powerpoint presentation summary samples. This is a three stage process. The stages in this process are finance, analysis, business, investment, marketing.
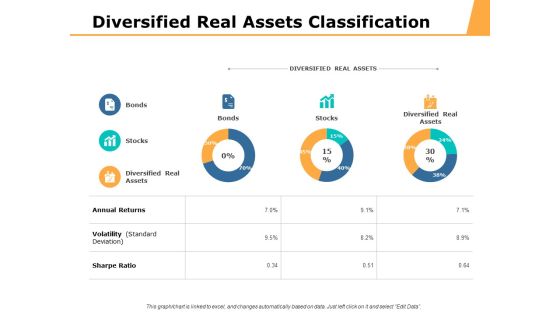
Diversified Real Assets Classification Ppt PowerPoint Presentation Ideas Tips
This is a diversified real assets classification ppt powerpoint presentation ideas tips. This is a three stage process. The stages in this process are percentage, product, business, management, marketing.
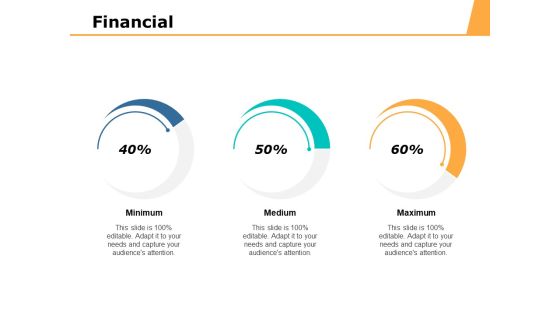
Financial Investment Analysis Ppt PowerPoint Presentation Layouts Design Inspiration
This is a financial investment analysis ppt powerpoint presentation layouts design inspiration. This is a three stage process. The stages in this process are finance, marketing, management, investment, analysis.

Investments In Real Assets Ppt PowerPoint Presentation Styles Pictures
This is a investments in real assets ppt powerpoint presentation styles pictures. This is a three stage process. The stages in this process are percentage, product, business, management, marketing.

Portfolio Management Securities Allocation Dashboard Ppt PowerPoint Presentation Professional Design Ideas
This is a portfolio management securities allocation dashboard ppt powerpoint presentation professional design ideas. This is a four stage process. The stages in this process are percentage product, business, management, marketing.

Portfolio Summary Management Dashboard Ppt PowerPoint Presentation File Design Templates
This is a portfolio summary management dashboard ppt powerpoint presentation file design templates. This is a five stage process. The stages in this process are percentage product, business, management, marketing.

Dashboard Finance Ppt PowerPoint Presentation Infographic Template Graphic Tips
This is a dashboard finance ppt powerpoint presentation infographic template graphic tips. This is a three stage process. The stages in this process are dashboard, finance, analysis, business, investment.
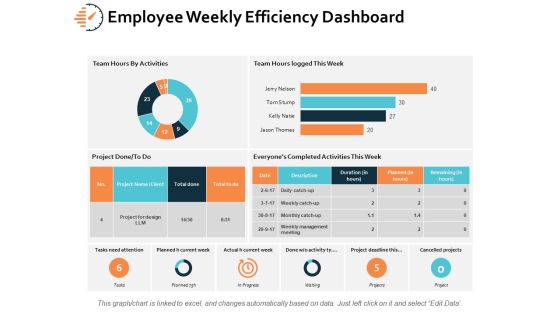
Employee Weekly Efficiency Dashboard Ppt PowerPoint Presentation Infographics Microsoft
This is a employee weekly efficiency dashboard ppt powerpoint presentation infographics microsoft. This is a six stage process. The stages in this process are finance, analysis, business, investment, marketing.
Negative Impacts Of Workplace Stress Finance Ppt PowerPoint Presentation Icon Inspiration
This is a negative impacts of workplace stress finance ppt powerpoint presentation icon inspiration. This is a five stage process. The stages in this process are finance, analysis, business, investment, marketing.
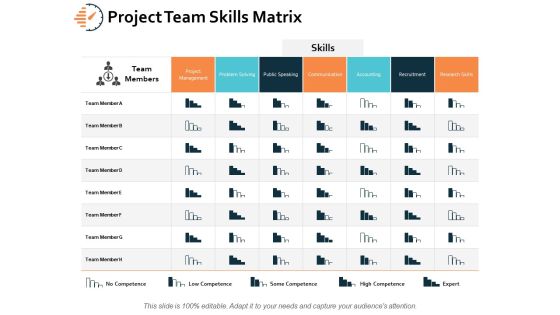
Project Team Skills Matrix Ppt PowerPoint Presentation Styles Example Introduction
This is a project team skills matrix ppt powerpoint presentation styles example introduction. This is a seven stage process. The stages in this process are communication, accounting, problem solving, project management, recruitment.
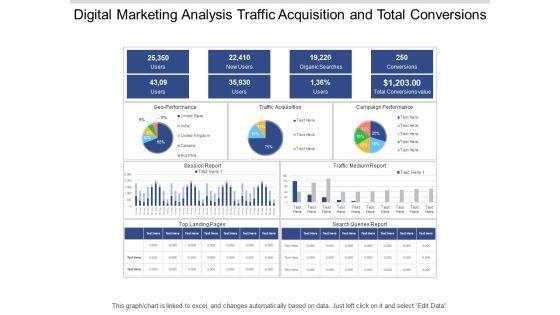
Digital Marketing Analysis Traffic Acquisition And Total Conversions Ppt PowerPoint Presentation Pictures Layouts
This is a digital marketing analysis traffic acquisition and total conversions ppt powerpoint presentation pictures layouts. This is a three stage process. The stages in this process are digital analytics, digital dashboard, marketing.
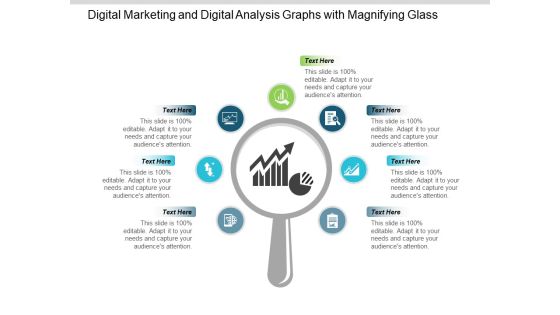
Digital Marketing And Digital Analysis Graphs With Magnifying Glass Ppt PowerPoint Presentation Portfolio Show
This is a digital marketing and digital analysis graphs with magnifying glass ppt powerpoint presentation portfolio show. This is a seven stage process. The stages in this process are digital analytics, digital dashboard, marketing.
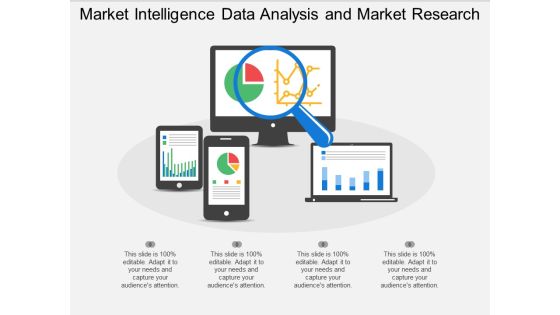
Market Intelligence Data Analysis And Market Research Ppt PowerPoint Presentation Professional Templates
This is a market intelligence data analysis and market research ppt powerpoint presentation professional templates. This is a four stage process. The stages in this process are digital analytics, digital dashboard, marketing.

Measure Success With Digital Marketing Analytics Ppt PowerPoint Presentation Gallery Infographics
This is a measure success with digital marketing analytics ppt powerpoint presentation gallery infographics. This is a five stage process. The stages in this process are digital analytics, digital dashboard, marketing.

Online Market Intelligence Social Media Analytics Ppt PowerPoint Presentation Infographics Themes
This is a online market intelligence social media analytics ppt powerpoint presentation infographics themes. This is a five stage process. The stages in this process are digital analytics, digital dashboard, marketing.

Web Analytics For Seo Marketing Ppt PowerPoint Presentation Examples
This is a web analytics for seo marketing ppt powerpoint presentation examples. This is a five stage process. The stages in this process are digital analytics, digital dashboard, marketing.

Web Analytics Traffic Sources And Conversion Rate Ppt PowerPoint Presentation Picture
This is a web analytics traffic sources and conversion rate ppt powerpoint presentation picture. This is a four stage process. The stages in this process are digital analytics, digital dashboard, marketing.
Web Marketing Analytics Bounce Rate Goal Conversion Ppt PowerPoint Presentation Inspiration Icon
This is a web marketing analytics bounce rate goal conversion ppt powerpoint presentation inspiration icon. This is a six stage process. The stages in this process are digital analytics, digital dashboard, marketing.
 Home
Home