AI PPT Maker
Templates
PPT Bundles
Design Services
Business PPTs
Business Plan
Management
Strategy
Introduction PPT
Roadmap
Self Introduction
Timelines
Process
Marketing
Agenda
Technology
Medical
Startup Business Plan
Cyber Security
Dashboards
SWOT
Proposals
Education
Pitch Deck
Digital Marketing
KPIs
Project Management
Product Management
Artificial Intelligence
Target Market
Communication
Supply Chain
Google Slides
Research Services
 One Pagers
All Categories
-
Home
- Customer Favorites
- Floor Plan
Floor Plan

Line Chart Ppt PowerPoint Presentation Ideas
This is a line chart ppt powerpoint presentation ideas. This is a two stage process. The stages in this process are marketing, in percentage, sun, mon, tue, wed.

Area Chart Ppt PowerPoint Presentation Show
This is a area chart ppt powerpoint presentation show. This is a two stage process. The stages in this process are sales in percentage, business, marketing, analysis, success.
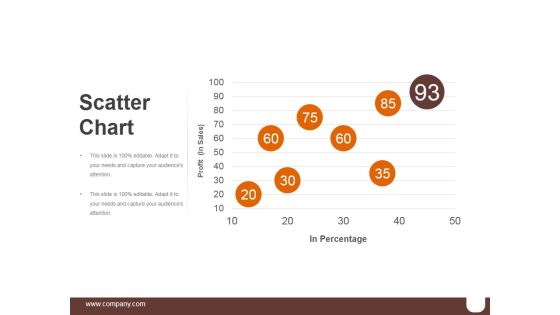
Scatter Chart Ppt PowerPoint Presentation Graphics
This is a scatter chart ppt powerpoint presentation graphics. This is a five stage process. The stages in this process are business, marketing, percentage, success, finance.

Bar Chart Ppt PowerPoint Presentation Styles
This is a bar chart ppt powerpoint presentation styles. This is a nine stage process. The stages in this process are business, management, sales in percentage, growth.

Line Chart Ppt PowerPoint Presentation Show
This is a line chart ppt powerpoint presentation show. This is a seven stage process. The stages in this process are sun, mon, tue, wed.

Stock Chart Ppt PowerPoint Presentation Information
This is a stock chart ppt powerpoint presentation information. This is a five stage process. The stages in this process are projects, marketing, high, volume, low.

Pie Chart Ppt PowerPoint Presentation Visual Aids
This is a pie chart ppt powerpoint presentation visual aids. This is a five stage process. The stages in this process are pie, finance, analysis, division, percentage.
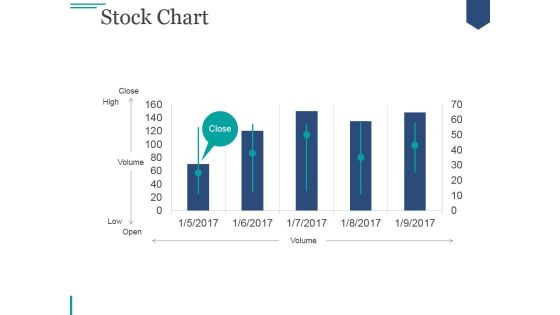
Stock Chart Ppt PowerPoint Presentation Diagrams
This is a stock chart ppt powerpoint presentation diagrams. This is a five stage process. The stages in this process are close, high, volume, low, open.
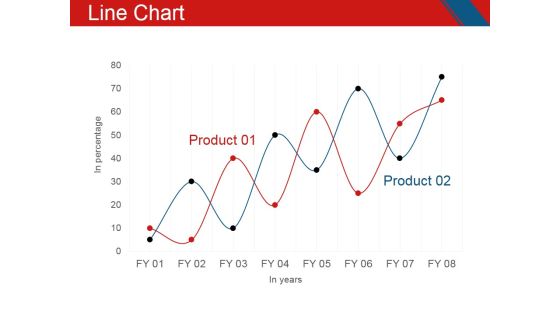
Line Chart Ppt PowerPoint Presentation File Layout
This is a line chart ppt powerpoint presentation file layout. This is a two stage process. The stages in this process are business, management, growth, product, marketing.

Stock Chart Ppt PowerPoint Presentation Professional Maker
This is a stock chart ppt powerpoint presentation professional maker. This is a five stage process. The stages in this process are close, high, volume, low, open.

Column Chart Ppt Powerpoint Presentation Professional Model
This is a column chart ppt powerpoint presentation professional model. This is a two stage process. The stages in this process are product, dollars in thousands, graph, growth.

Column Chart Ppt PowerPoint Presentation Summary Introduction
This is a column chart ppt powerpoint presentation summary introduction. This is a two stage process. The stages in this process are business, marketing, bar, graph, finance.

Pie Chart Ppt PowerPoint Presentation Deck
This is a pie chart ppt powerpoint presentation deck. This is a five stage process. The stages in this process are business, pie, finance, percentage, product.

Area Chart Ppt Powerpoint Presentation Ideas Templates
This is a area chart ppt powerpoint presentation ideas templates. This is a two stage process. The stages in this process are product, financial year, in percentage, graph.
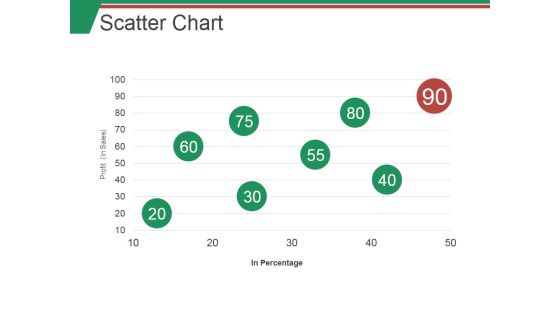
Scatter Chart Ppt PowerPoint Presentation Model Themes
This is a scatter chart ppt powerpoint presentation model themes. This is a eight stage process. The stages in this process are business, scatter, bubble, graph, marketing.

Bar Chart Ppt PowerPoint Presentation Model Good
This is a bar chart ppt powerpoint presentation model good. This is a seven stage process. The stages in this process are business, marketing, bar, success, finance.
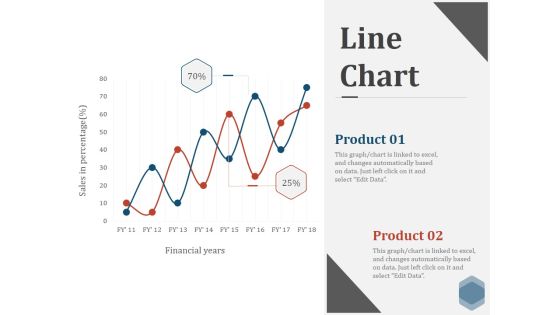
Line Chart Ppt PowerPoint Presentation Show Visuals
This is a line chart ppt powerpoint presentation show visuals. This is a two stage process. The stages in this process are financial, graph, line, marketing, success.
Scatter Chart Ppt PowerPoint Presentation Slides Icons
This is a scatter chart ppt powerpoint presentation slides icons. This is a three stage process. The stages in this process are line, graph, success, business, marketing.

Column Chart Ppt PowerPoint Presentation Gallery
This is a column chart ppt powerpoint presentation gallery. This is a six stage process. The stages in this process are business, finance, years, product, graph.
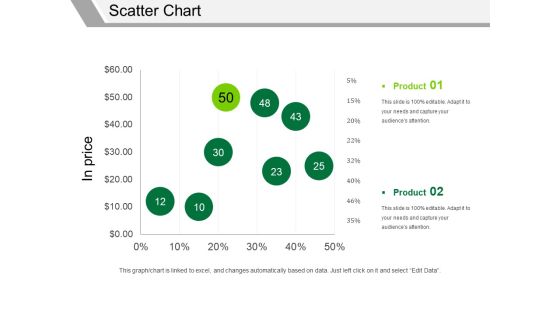
Scatter Chart Ppt PowerPoint Presentation Pictures Elements
This is a scatter chart ppt powerpoint presentation pictures elements. This is a two stage process. The stages in this process are in price, product, finance, business, marketing.

Bar Chart Ppt PowerPoint Presentation Pictures Inspiration
This is a bar chart ppt powerpoint presentation pictures inspiration. This is a seven stage process. The stages in this process are in percentage, business, marketing, finance, graph.

Column Chart Ppt PowerPoint Presentation Inspiration Deck
This is a column chart ppt powerpoint presentation inspiration deck. This is a two stage process. The stages in this process are years, business, marketing, graph, finance, product.

Combo Chart Ppt PowerPoint Presentation Ideas Portrait
This is a combo chart ppt powerpoint presentation ideas portrait. This is a three stage process. The stages in this process are product, business, finance, growth.
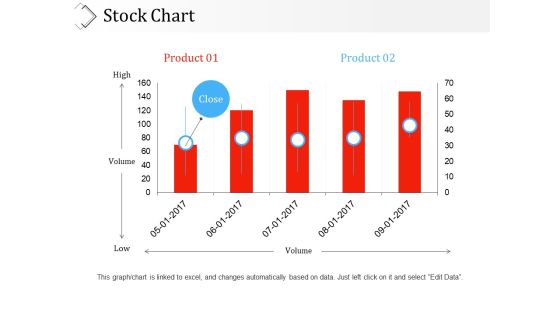
Stock Chart Ppt PowerPoint Presentation Ideas Sample
This is a stock chart ppt powerpoint presentation ideas sample. This is a five stage process. The stages in this process are product, high, low, volume, business.

Radar Chart Ppt PowerPoint Presentation Styles Guide
This is a radar chart ppt powerpoint presentation styles guide. This is a two stage process. The stages in this process are product, graph, business, marketing, finance.
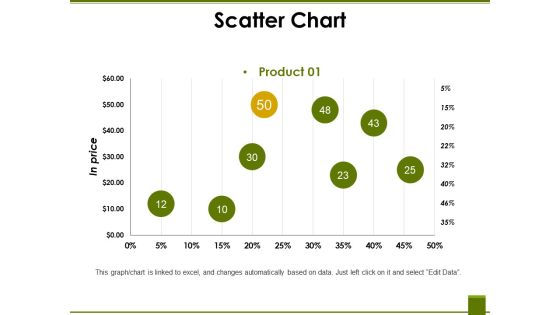
Scatter Chart Ppt PowerPoint Presentation File Display
This is a scatter chart ppt powerpoint presentation file display. This is a eight stage process. The stages in this process are product, business, marketing, finance, in price.
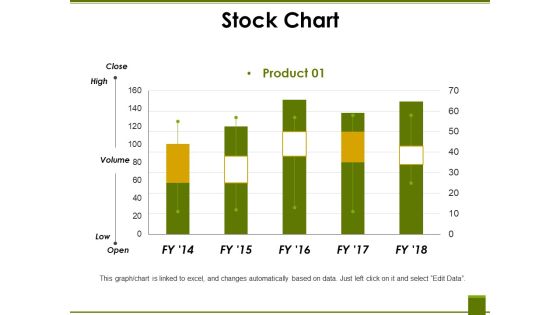
Stock Chart Ppt PowerPoint Presentation Summary Pictures
This is a stock chart ppt powerpoint presentation summary pictures. This is a five stage process. The stages in this process are high, volume, low, product, graph.

Scatter Chart Ppt PowerPoint Presentation Templates
This is a scatter chart ppt powerpoint presentation templates. This is a nine stage process. The stages in this process are product, values, business, marketing, growth, success.
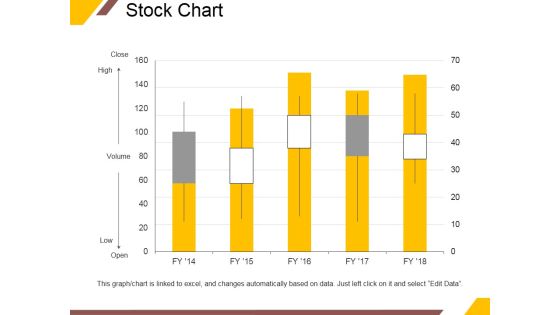
Stock Chart Ppt PowerPoint Presentation Professional Pictures
This is a stock chart ppt powerpoint presentation professional pictures. This is a five stage process. The stages in this process are close, high, volume, low, open.
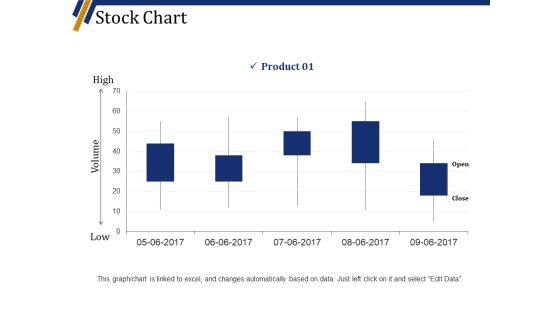
Stock Chart Ppt PowerPoint Presentation Slides Maker
This is a stock chart ppt powerpoint presentation slides maker. This is a five stage process. The stages in this process are high, volume, low, product, business, graph.
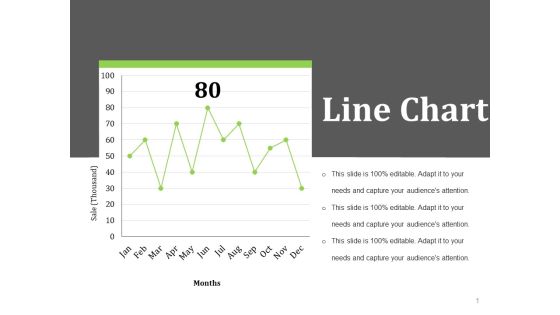
Line Chart Ppt PowerPoint Presentation Slides Template
This is a line chart ppt powerpoint presentation slides template. This is a one stage process. The stages in this process are months, sale thousand, business, marketing, finance.

Pie Chart Ppt PowerPoint Presentation Layouts Topics
This is a pie chart ppt powerpoint presentation layouts topics. This is a three stage process. The stages in this process are pie, process, percentage, finance, business.
Stock Chart Ppt PowerPoint Presentation Show Sample
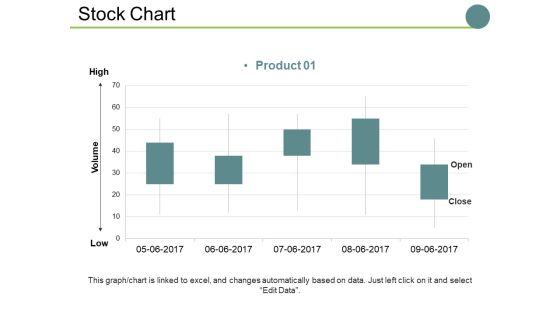
This is a stock chart ppt powerpoint presentation show sample. This is a one stage process. The stages in this process are high, volume, low, business, graph, marketing.

Stock Chart Ppt PowerPoint Presentation Styles Deck
This is a stock chart ppt powerpoint presentation styles deck. This is a two stage process. The stages in this process are high, volume, low.

Bar Chart Ppt PowerPoint Presentation Infographics Icon
This is a bar chart ppt powerpoint presentation infographics icon. This is a three stage process. The stages in this process are product, bar graph, success, business, growth.

Column Chart Ppt PowerPoint Presentation Gallery Styles
This is a column chart ppt powerpoint presentation gallery styles. This is a two stage process. The stages in this process are years, graph, business, marketing, finance.

Column Chart Ppt PowerPoint Presentation Model Visuals
This is a column chart ppt powerpoint presentation model visuals. This is a two stage process. The stages in this process are product, year, graph, business, finance.
Pie Chart Ppt PowerPoint Presentation Summary Infographics
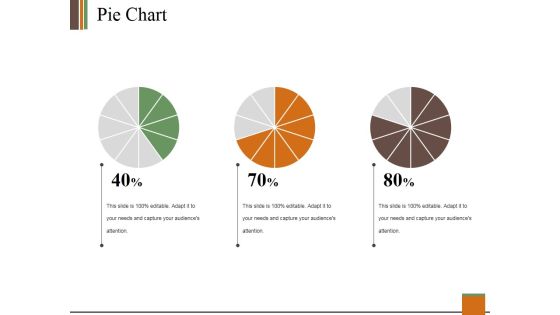
This is a pie chart ppt powerpoint presentation summary infographics. This is a three stage process. The stages in this process are pie, process, percentage, finance, business.

Scatter Chart Ppt PowerPoint Presentation Gallery Guide
This is a scatter chart ppt powerpoint presentation gallery guide. This is a one stage process. The stages in this process are profit, product, in percentage, growth, success.

Stock Chart Ppt PowerPoint Presentation Show Backgrounds
This is a stock chart ppt powerpoint presentation show backgrounds. This is a one stage process. The stages in this process are high, volume, low, business, marketing.

Scatter Chart Ppt PowerPoint Presentation Ideas Professional
This is a scatter chart ppt powerpoint presentation ideas professional. This is a one stage process. The stages in this process are product, percentage, growth, success, line graph.

Stock Chart Ppt PowerPoint Presentation Model Grid
This is a stock chart ppt powerpoint presentation model grid. This is a two stage process. The stages in this process are close, high, volume, low, open, product.
Pie Chart Ppt PowerPoint Presentation Layouts Gridlines
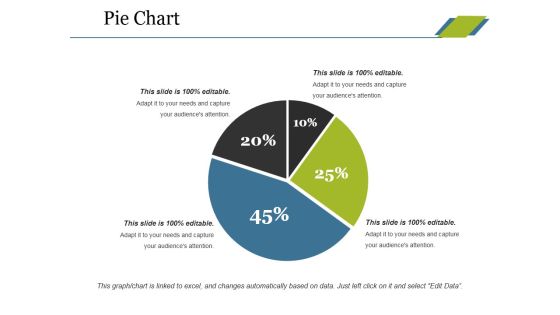
This is a pie chart ppt powerpoint presentation layouts gridlines. This is a four stage process. The stages in this process are pie, process, percentage, finance, business.

Column Chart Ppt PowerPoint Presentation Styles Picture
This is a column chart ppt powerpoint presentation styles picture. This is a five stage process. The stages in this process are years, business, marketing, graph, finance.

Column Chart Ppt PowerPoint Presentation Summary Maker
This is a column chart ppt powerpoint presentation summary maker. This is a two stage process. The stages in this process are business, marketing, product, bar graph, years.

Column Chart Ppt PowerPoint Presentation Portfolio Clipart
This is a column chart ppt powerpoint presentation portfolio clipart. This is a two stage process. The stages in this process are bar graph, growth, success, product, dollars.

Bar Chart Ppt PowerPoint Presentation Model Topics
This is a bar chart ppt powerpoint presentation model topics. This is a two stage process. The stages in this process are bar graph, growth, success, business, marketing.

Stock Chart Ppt PowerPoint Presentation Styles Elements
This is a stock chart ppt powerpoint presentation styles elements. This is a two stage process. The stages in this process are high, volume, low.

Area Chart Ppt PowerPoint Presentation Ideas Tips
This is a area chart ppt powerpoint presentation ideas tips. This is a two stage process. The stages in this process are in percentage, financial, year, business, marketing.
Radar Chart Ppt PowerPoint Presentation Summary Slides
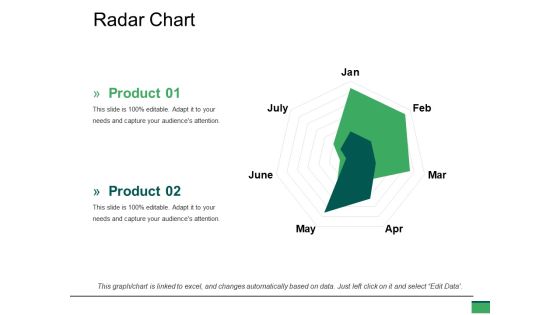
This is a radar chart ppt powerpoint presentation summary slides. This is a two stage process. The stages in this process are marketing, finance, radar, business, marketing.
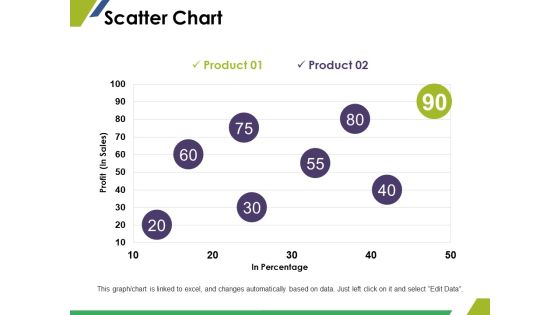
Scatter Chart Ppt PowerPoint Presentation Styles Images
This is a scatter chart ppt powerpoint presentation styles images. This is a two stage process. The stages in this process are in percentage, profit, finance, marketing, business.

Column Chart Ppt PowerPoint Presentation Summary Slides
This is a column chart ppt powerpoint presentation summary slides. This is a two stage process. The stages in this process are finance, marketing, business, graph, years.
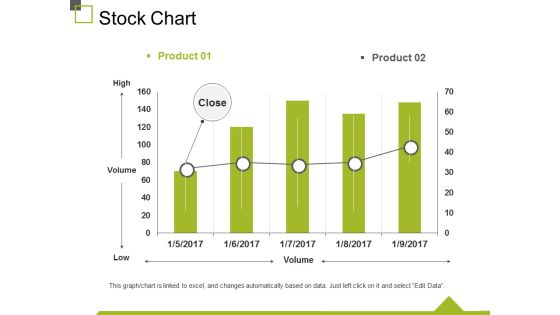
Stock Chart Ppt PowerPoint Presentation Summary Graphics
This is a stock chart ppt powerpoint presentation summary graphics. This is a two stage process. The stages in this process are High, Volume, Low, Business, Marketing.
Radar Chart Ppt PowerPoint Presentation Slides Icon
This is a radar chart ppt powerpoint presentation slides icon. This is a two stage process. The stages in this process are business, marketing, growth, success, radar.

Column Chart Ppt PowerPoint Presentation Summary Deck
This is a column chart ppt powerpoint presentation summary deck. This is a two stage process. The stages in this process are expenditure in, years, business, marketing, graph.

Line Chart Ppt PowerPoint Presentation Summary Rules
This is a line chart ppt powerpoint presentation summary rules. This is a two stage process. The stages in this process are profit, business, marketing, graph, finance.
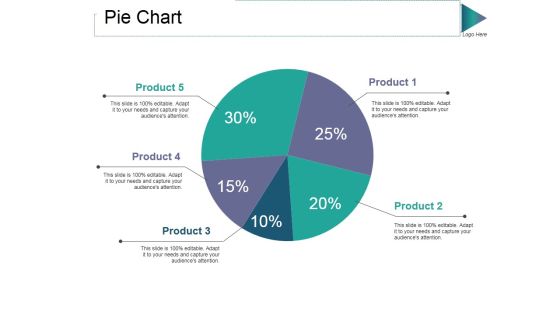
Pie Chart Ppt PowerPoint Presentation Model Grid
This is a pie chart ppt powerpoint presentation model grid. This is a five stage process. The stages in this process are product, pie, process, percentage, finance.

Column Chart Ppt PowerPoint Presentation File Inspiration
This is a column chart ppt powerpoint presentation file inspiration. This is a two stage process. The stages in this process are business, marketing, years, expenditure in, graph.

Column Chart Ppt PowerPoint Presentation Portfolio Topics
This is a column chart ppt powerpoint presentation portfolio topics. This is a two stage process. The stages in this process are expenditure, years, product, growth, success.
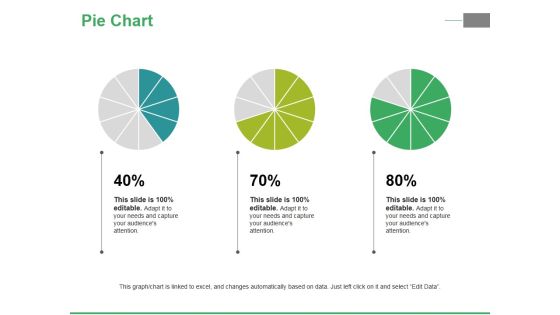
Pie Chart Ppt PowerPoint Presentation Ideas Inspiration
This is a pie chart ppt powerpoint presentation ideas inspiration. This is a three stage process. The stages in this process are pie, process, percentage, finance, business.

Column Chart Ppt PowerPoint Presentation Show Images
This is a column chart ppt powerpoint presentation show images. This is a two stage process. The stages in this process are product, expenditure, years, bar graph, growth.
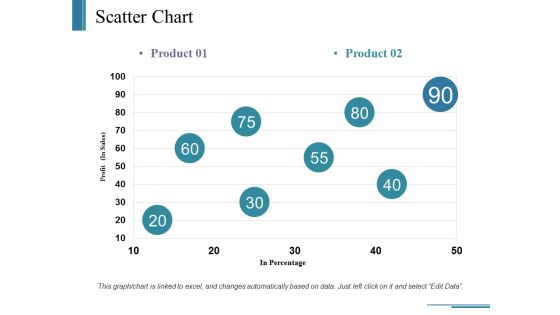
Scatter Chart Ppt PowerPoint Presentation Ideas Example
This is a scatter chart ppt powerpoint presentation ideas example. This is a two stage process. The stages in this process are business, in percentage, profit, marketing, graph.

Column Chart Ppt PowerPoint Presentation Show Example
This is a column chart ppt powerpoint presentation show example. This is a two stage process. The stages in this process are business, marketing, expenditure in, finance, years.
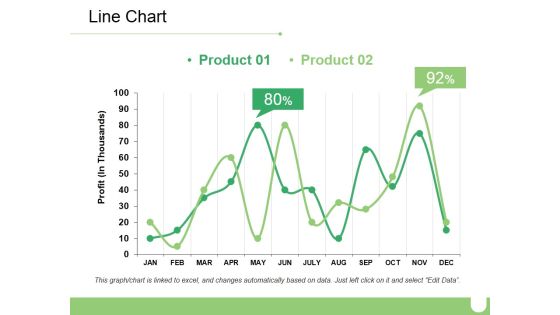
Line Chart Ppt PowerPoint Presentation Ideas Diagrams
This is a line chart ppt powerpoint presentation ideas diagrams. This is a two stage process. The stages in this process are business, marketing, percentage, financial, profit.

Column Chart Ppt PowerPoint Presentation Ideas Deck
This is a column chart ppt powerpoint presentation ideas deck. This is a two stage process. The stages in this process are business, marketing, dollars, in years, graph.

Stock Chart Ppt PowerPoint Presentation Show
This is a stock chart ppt powerpoint presentation show. This is a two stage process. The stages in this process are high, volume, low, business, marketing.

Column Chart Ppt PowerPoint Presentation Professional Template
This is a column chart ppt powerpoint presentation professional template. This is a two stage process. The stages in this process are product, percentage, finance, bar graph, growth.

Area Chart Ppt PowerPoint Presentation Icon Gallery
This is a area chart ppt powerpoint presentation icon gallery. This is a two stage process. The stages in this process are sales in percentage, product, bar graph.

Column Chart Ppt PowerPoint Presentation Professional Aids
This is a column chart ppt powerpoint presentation professional aids. This is a two stage process. The stages in this process are product, sales in percentage, financial years.

Column Chart Ppt PowerPoint Presentation Gallery Layout
This is a column chart ppt powerpoint presentation gallery layout. This is a two stage process. The stages in this process are product, sales in percentage, year.
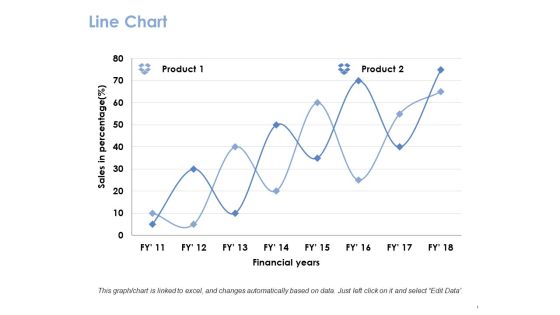
Line Chart Ppt PowerPoint Presentation Gallery Guide
This is a line chart ppt powerpoint presentation gallery guide. This is a two stage process. The stages in this process are product, financial years, sales in percentage.

Scatter Chart Ppt PowerPoint Presentation Show Sample
This is a scatter chart ppt powerpoint presentation show sample. This is a one stage process. The stages in this process are product, dollar, in percentage.
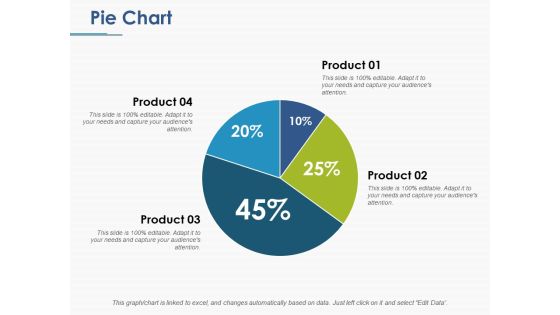
Pie Chart Ppt PowerPoint Presentation File Background
This is a pie chart ppt powerpoint presentation file background. This is a four stage process. The stages in this process are pie, process, percentage, finance, business.

Area Chart Ppt PowerPoint Presentation Styles Brochure
This is a area chart ppt powerpoint presentation styles brochure. This is a two stage process. The stages in this process are product, financial years, in percentage.

Stock Chart Ppt PowerPoint Presentation Layouts Portfolio
This is a stock chart ppt powerpoint presentation layouts portfolio. This is a two stage process. The stages in this process are business, marketing, high, volume, low, finance.

Column Chart Ppt PowerPoint Presentation Ideas Clipart
This is a column chart ppt powerpoint presentation ideas clipart. This is a two stage process. The stages in this process are product, expenditure in, years.

Combo Chart Ppt PowerPoint Presentation File Formats
This is a combo chart ppt powerpoint presentation file formats. This is a three stage process. The stages in this process are product, growth rate, market size.

Column Chart Ppt PowerPoint Presentation Show Slideshow
This is a column chart ppt powerpoint presentation show slideshow. This is a two stage process. The stages in this process are product, expenditure, years.
Line Chart Ppt PowerPoint Presentation Icon Inspiration
This is a line chart ppt powerpoint presentation icon inspiration. This is a two stage process. The stages in this process are product, financial years, sales in percentage.

Pie Chart Ppt PowerPoint Presentation Ideas Deck
This is a pie chart ppt powerpoint presentation ideas deck. This is a four stage process. The stages in this process are pie, process, percentage, finance, business.

Area Chart Ppt PowerPoint Presentation Summary Backgrounds
This is a area chart ppt powerpoint presentation summary backgrounds. This is a two stage process. The stages in this process are percentage, financial, business, management.

Area Chart Ppt PowerPoint Presentation Styles Ideas
This is a area chart ppt powerpoint presentation styles ideas. This is a three stage process. The stages in this process are percentage, product, business.

Line Chart Ppt PowerPoint Presentation File Sample
This is a line chart ppt powerpoint presentation file sample. This is a two stage process. The stages in this process are finance, marketing, management, investment, analysis.
Pie Chart Ppt PowerPoint Presentation Icon Clipart
This is a pie chart ppt powerpoint presentation icon clipart. This is a four stage process. The stages in this process are finance, marketing, management, investment, analysis.

Combo Chart Ppt PowerPoint Presentation Model Professional
This is a combo chart ppt powerpoint presentation model professional. This is a three stage process. The stages in this process are finance, marketing, management, investment, analysis.

Bubble Chart Ppt PowerPoint Presentation Styles Show
This is a bubble chart ppt powerpoint presentation styles show. This is a three stage process. The stages in this process are finance, marketing, management, investment, analysis.

Bubble Chart Ppt PowerPoint Presentation Background Designs
This is a bubble chart ppt powerpoint presentation background designs. This is a two stage process. The stages in this process are product, percentage, marketing, business.

Column Chart Ppt PowerPoint Presentation Pictures Aids
This is a column chart ppt powerpoint presentation pictures aids. This is a two stage process. The stages in this process are Percentage, Product, Marketing, Management.

Bar Chart Ppt PowerPoint Presentation Professional Examples
This is a bar chart ppt powerpoint presentation professional examples. This is a four stage process. The stages in this process are percentage, marketing, management, product.

Bar Chart Ppt PowerPoint Presentation Show Deck
This is a bar chart ppt powerpoint presentation show deck. This is a two stage process. The stages in this process are percentage, product, business, marketing.
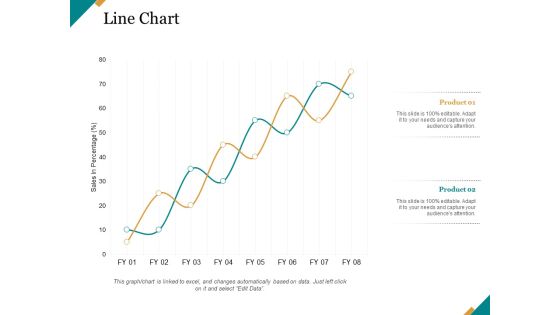
Line Chart Ppt PowerPoint Presentation Pictures Graphics
This is a line chart ppt powerpoint presentation pictures graphics. This is a two stage process. The stages in this process are finance, marketing, management, investment, analysis.

Area Chart Ppt PowerPoint Presentation Show Graphics
This is a area chart ppt powerpoint presentation show graphics. This is a three stage process. The stages in this process are percentage, product, marketing, management, business.

Combo Chart Ppt PowerPoint Presentation Slides Slideshow
This is a combo chart ppt powerpoint presentation slides slideshow. This is a three stage process. The stages in this process are percentage, product, marketing, management, business.

Column Chart Ppt PowerPoint Presentation Show Objects
This is a column chart ppt powerpoint presentation show objects. This is a two stage process. The stages in this process are percentage, product, business, management, marketing.

Bubble Chart Ppt PowerPoint Presentation Ideas Images
This is a bubble chart ppt powerpoint presentation ideas images. This is a three stage process. The stages in this process are percentage, product, marketing, business.

Area Chart Ppt PowerPoint Presentation Icon Smartart
This is a area chart ppt powerpoint presentation icon smartart. This is a two stage process. The stages in this process are percentage, product, business, marketing.

Column Chart Ppt PowerPoint Presentation Model Slideshow
This is a column chart ppt powerpoint presentation model slideshow. This is a two stage process. The stages in this process are percentage, product, business, marketing.

Combo Chart Ppt PowerPoint Presentation Styles Topics
This is a combo chart ppt powerpoint presentation styles topics. This is a three stage process. The stages in this process are percentage, product, business, management, marketing.

Column Chart Financial Ppt PowerPoint Presentation Information
This is a column chart financial ppt powerpoint presentation information. This is a three stage process. The stages in this process are business, management, marketing, percentage, product.

Column Chart Ppt PowerPoint Presentation Slides Clipart
This is a column chart ppt powerpoint presentation slides clipart. This is a two stage process. The stages in this process are business, management, marketing, percentage, product.
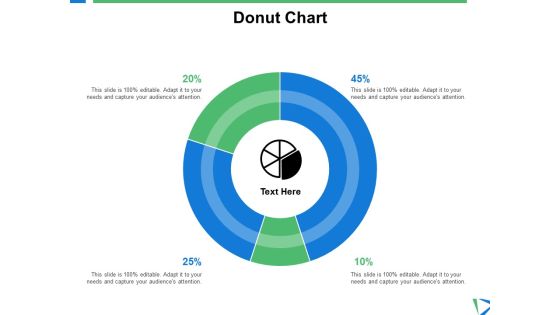
Donut Chart Investment Ppt PowerPoint Presentation Shapes
This is a donut chart investment ppt powerpoint presentation shapes. This is a four stage process. The stages in this process are finance, analysis, business, investment, marketing.
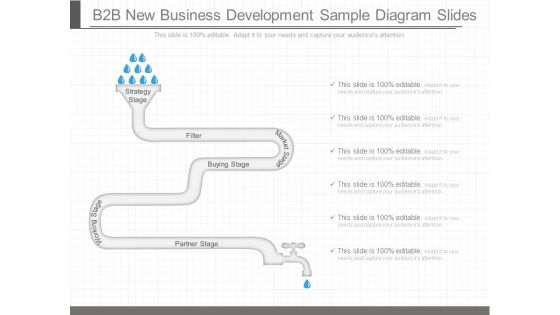
B2b New Business Development Sample Diagram Slides
This is a b2b new business development sample diagram slides. This is a two stage process. The stages in this process are strategy stage, filter, buying stage, market stage, working stage, partner stage.

Web Development Desktop Application Development Technique Background PDF
This slide describes the desktop application development, which is limited to local devices but sometimes can be executed over the internet as well.This is a Web Development Desktop Application Development Technique Background PDF template with various stages. Focus and dispense information on ten stages using this creative set, that comes with editable features. It contains large content boxes to add your information on topics like Desktop Application Development Technique You can also showcase facts, figures, and other relevant content using this PPT layout. Grab it now.
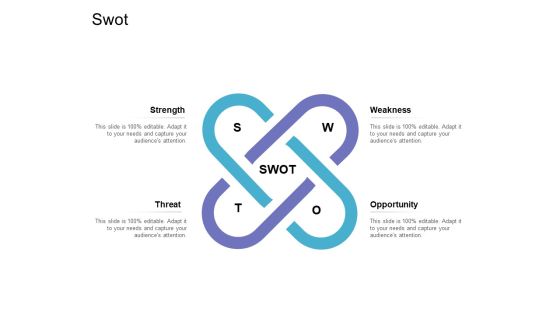
Executing Agile Operations Structured System Support Swot Information PDF
Presenting executing agile operations structured system support swot information pdf to provide visual cues and insights. Share and navigate important information on four stages that need your due attention. This template can be used to pitch topics like strength, threat, opportunity, weakness. In addition, this PPT design contains high-resolution images, graphics, etc, that are easily editable and available for immediate download.

Executing Online Solution In Banking Timeline Inspiration PDF
Presenting executing online solution in banking timeline inspiration pdf to provide visual cues and insights. Share and navigate important information on five stages that need your due attention. This template can be used to pitch topics like timeline 2016 to 2020. In addtion, this PPT design contains high resolution images, graphics, etc, that are easily editable and available for immediate download.
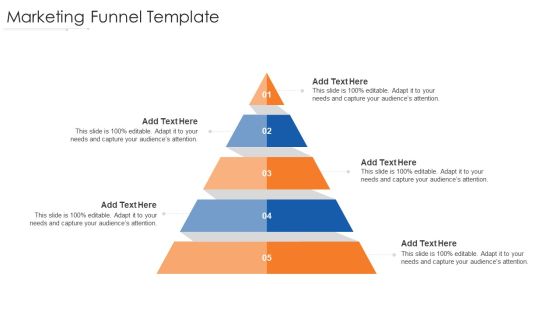
Online Marketing Approach And Execution Marketing Funnel Template Professional PDF
Presenting online marketing approach and execution marketing funnel template professional pdf to provide visual cues and insights. Share and navigate important information on five stages that need your due attention. This template can be used to pitch topics like marketing funnel template. In addtion, this PPT design contains high resolution images, graphics, etc, that are easily editable and available for immediate download.
Strategic Development And Operations Execution IT Circular Diagram Icons PDF
Presenting strategic development and operations execution it circular diagram icons pdf to provide visual cues and insights. Share and navigate important information on four stages that need your due attention. This template can be used to pitch topics like circular diagram. In addtion, this PPT design contains high resolution images, graphics, etc, that are easily editable and available for immediate download.

Strategic Development And Operations Execution IT Financial Designs PDF
Presenting strategic development and operations execution it financial designs pdf to provide visual cues and insights. Share and navigate important information on three stages that need your due attention. This template can be used to pitch topics like minimum, medium, maximum. In addtion, this PPT design contains high resolution images, graphics, etc, that are easily editable and available for immediate download.
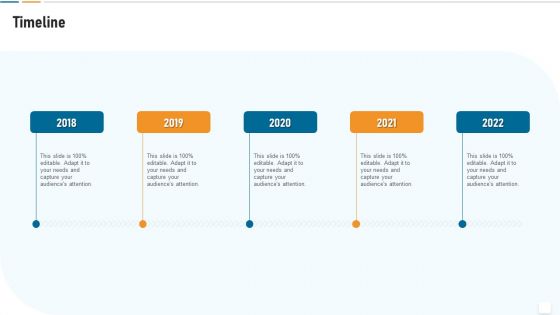
Strategic Development And Operations Execution IT Timeline Formats PDF
Presenting strategic development and operations execution it timeline formats pdf to provide visual cues and insights. Share and navigate important information on five stages that need your due attention. This template can be used to pitch topics like timeline, 2018 to 2022. In addtion, this PPT design contains high resolution images, graphics, etc, that are easily editable and available for immediate download.

Execution Management In Business Compare Theories Of Change Demonstration PDF
Presenting execution management in business compare theories of change demonstration pdf to provide visual cues and insights. Share and navigate important information on six stages that need your due attention. This template can be used to pitch topics like compare theories of change. In addtion, this PPT design contains high resolution images, graphics, etc, that are easily editable and available for immediate download.

Execution Management In Business Continuous Improvement Summary PDF
Presenting execution management in business continuous improvement summary pdf to provide visual cues and insights. Share and navigate important information on five stages that need your due attention. This template can be used to pitch topics like manage change, implement, evaluate, asses. In addtion, this PPT design contains high resolution images, graphics, etc, that are easily editable and available for immediate download.

Execution Management In Business Forces For Change Structure PDF
Presenting execution management in business forces for change structure pdf to provide visual cues and insights. Share and navigate important information on six stages that need your due attention. This template can be used to pitch topics like virtual organization, convergence. digital, privatizations. In addtion, this PPT design contains high resolution images, graphics, etc, that are easily editable and available for immediate download.

Execution Management In Business Ideating Change Management Themes PDF
Presenting execution management in business ideating change management themes pdf to provide visual cues and insights. Share and navigate important information on six stages that need your due attention. This template can be used to pitch topics like ideating change management. In addtion, this PPT design contains high resolution images, graphics, etc, that are easily editable and available for immediate download.

Execution Management In Business Principles Of Change Information PDF
Presenting execution management in business principles of change information pdf to provide visual cues and insights. Share and navigate important information on seven stages that need your due attention. This template can be used to pitch topics like receivers, sender, resistance, comfort, authority. In addtion, this PPT design contains high resolution images, graphics, etc, that are easily editable and available for immediate download.
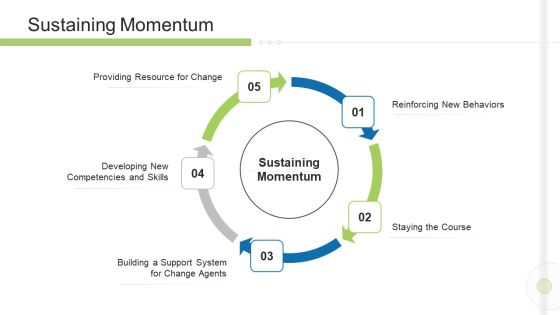
Execution Management In Business Sustaining Momentum Background PDF
Presenting execution management in business sustaining momentum background pdf to provide visual cues and insights. Share and navigate important information on five stages that need your due attention. This template can be used to pitch topics like developing, skills, competencies, resource, system. In addtion, this PPT design contains high resolution images, graphics, etc, that are easily editable and available for immediate download.
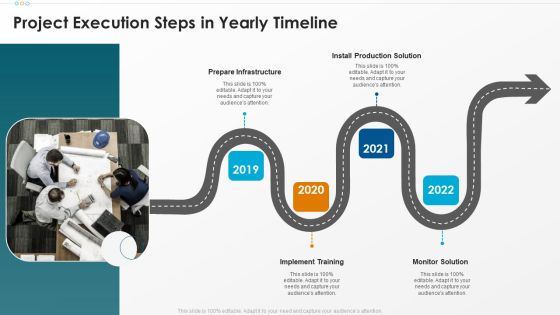
Project Execution Steps In Yearly Timeline Elements PDF
Persuade your audience using this project execution steps in yearly timeline elements pdf. This PPT design covers four stages, thus making it a great tool to use. It also caters to a variety of topics including prepare infrastructure, implement training, monitor solution. Download this PPT design now to present a convincing pitch that not only emphasizes the topic but also showcases your presentation skills.
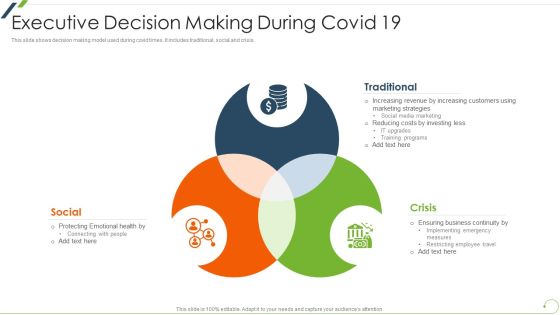
Executive Decision Making During Covid 19 Information PDF
Presenting executive decision making during covid 19 information pdf to dispense important information. This template comprises three stages. It also presents valuable insights into the topics including traditional, crisis, social. This is a completely customizable PowerPoint theme that can be put to use immediately. So, download it and address the topic impactfully.

Investment Financing And Dividend Decision By Executive Brochure PDF
Presenting investment financing and dividend decision by executive brochure pdf to dispense important information. This template comprises three stages. It also presents valuable insights into the topics including divided decision, financing decision, investment decision. This is a completely customizable PowerPoint theme that can be put to use immediately. So, download it and address the topic impactfully.

Raci Matrix Of Executive Decision Making Diagrams PDF
Persuade your audience using this raci matrix of executive decision making diagrams pdf. This PPT design covers four stages, thus making it a great tool to use. It also caters to a variety of topics including operational decision, determine direction, divestiture decisions. Download this PPT design now to present a convincing pitch that not only emphasizes the topic but also showcases your presentation skills.

Circular Arrow Process 5 Issues Ppt Visio Office PowerPoint Templates
We present our circular arrow process 5 issues ppt vision office PowerPoint templates. Use our Business PowerPoint Templates because, Weak Links & Chains: - Chain reactions and the element of teamwork add value to your efforts. Use our Circle Charts PowerPoint Templates because, the pyramid is a symbol of the desire to reach the top in a steady manner. Use our Arrows PowerPoint Templates because, they enhance the essence of your viable ideas. Use our Signs PowerPoint Templates because, Brilliant ideas popping up all over the place. Use our Process and Flows PowerPoint Templates because; discuss each path to the smallest detail. Use these PowerPoint slides for presentations relating to abstract arrow blank business chart circular circulation concept conceptual diagram executive flow icon idea illustration linear management model organization procedure process progression resource stages steps strategy. The prominent colors used in the PowerPoint template are Blue, Gray, and White
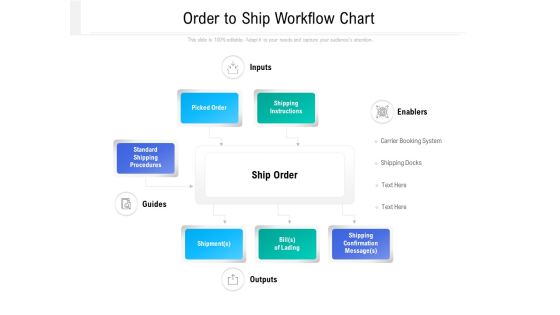
Order To Ship Workflow Chart Ppt PowerPoint Presentation Backgrounds PDF
Presenting this set of slides with name order to ship workflow chart ppt powerpoint presentation backgrounds pdf. This is a four stage process. The stages in this process are inputs, picked order, shipping instructions, standard shipping procedures, guides, outputs, ship order, enablers, shipping confirmation message, bill of lading, shipment. This is a completely editable PowerPoint presentation and is available for immediate download. Download now and impress your audience.

Hybrid Learning Framework For Business Skills Development Ppt PowerPoint Presentation Gallery Show PDF
Presenting hybrid learning framework for business skills development ppt powerpoint presentation gallery show pdf to dispense important information. This template comprises eight stages. It also presents valuable insights into the topics including personalization, flexible schedules, social distancing. This is a completely customizable PowerPoint theme that can be put to use immediately. So, download it and address the topic impactfully.
Venn Diagram For Critical Areas Analysis Powerpoint Slides
This is a venn diagram for critical areas analysis powerpoint slides. This is a three stage process. The stages in this process are venn, business, circle chart, process, strategy, management.

Projects And Assignments Bar Graph Ppt Sample Download
This is a projects and assignments bar graph ppt sample download. This is a five stage process. The stages in this process are business, process, marketing, strategy, graph chart, management.

Team Target And Procurement Analysis Graph Powerpoint Slide Deck Samples
This is a team target and procurement analysis graph powerpoint slide deck samples. This is a six stage process. The stages in this process are graph chart, business, success, strategy, management.
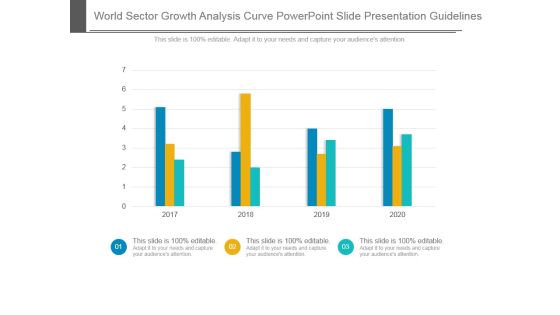
World Sector Growth Analysis Curve Powerpoint Slide Presentation Guidelines
This is a world sector growth analysis curve powerpoint slide presentation guidelines. This is a four stage process. The stages in this process are chart, business, presentation, strategy, presentation.
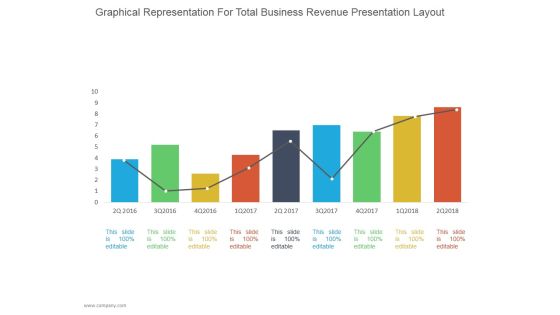
Graphical Representation For Total Business Revenue Ppt PowerPoint Presentation Diagrams
This is a graphical representation for total business revenue ppt powerpoint presentation diagrams. This is a nine stage process. The stages in this process are business, strategy, line chart, bar graph, marketing, management.

Organic Visits And Backlinks Ppt PowerPoint Presentation Graphics
This is a organic visits and backlinks ppt powerpoint presentation graphics. This is a two stage process. The stages in this process are business, finance, pie chart, marketing, strategy, success.

Portfolio Evaluation Template 2 Ppt PowerPoint Presentation Picture
This is a portfolio evaluation template 2 ppt powerpoint presentation picture. This is a five stage process. The stages in this process are business, strategy, marketing, analysis, finance, chart and graph.
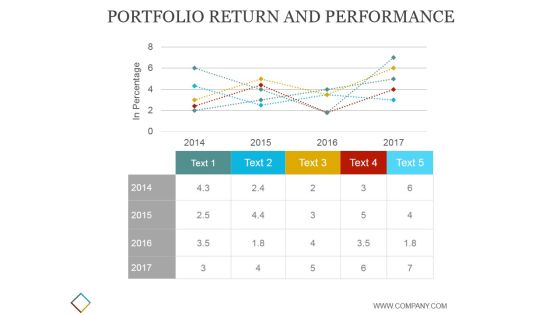
Portfolio Return And Performance Template Ppt PowerPoint Presentation Visuals
This is a portfolio return and performance template ppt powerpoint presentation visuals. This is a five stage process. The stages in this process are business, strategy, marketing, analysis, finance, chart and graph, growth.

Business Model Template 2 Ppt PowerPoint Presentation Slides
This is a business model template 2 ppt powerpoint presentation slides. This is a three stage process. The stages in this process are business, pie chart, marketing, strategy, analysis.
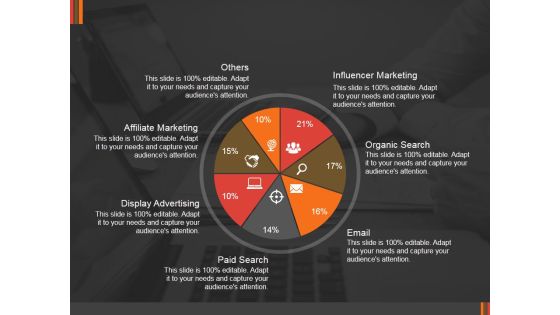
Marketing Research By Channels Ppt PowerPoint Presentation Pictures Example
This is a marketing research by channels ppt powerpoint presentation pictures example. This is a seven stage process. The stages in this process are business, pie chart, marketing, analysis, strategy, success.

Current Staff Composition Ppt PowerPoint Presentation Layouts Mockup
This is a current staff composition ppt powerpoint presentation layouts mockup. This is a five stage process. The stages in this process are business, pie chart, marketing, strategy, analysis.

Big Data Opportunities And Challenges Template 1 Ppt PowerPoint Presentation Infographic Template Summary
This is a big data opportunities and challenges template 1 ppt powerpoint presentation infographic template summary. This is a three stage process. The stages in this process are business, pie chart, finance, marketing, analysis, strategy.

Portfolio Selection Allocation Template 2 Ppt PowerPoint Presentation Layouts Show
This is a portfolio selection allocation template 2 ppt powerpoint presentation layouts show. This is a six stage process. The stages in this process are business, pie chart, finance, marketing, strategy, analysis.
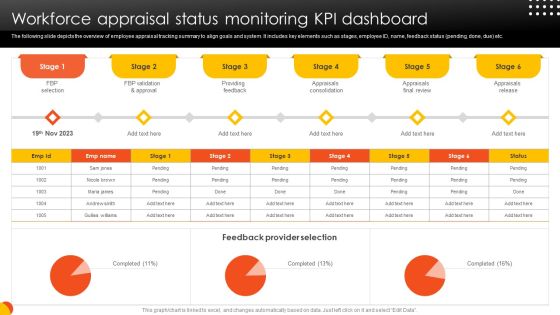
Effective Staff Performance Optimization Techniques Workforce Appraisal Status Monitoring Themes PDF
The following slide depicts the overview of employee appraisal tracking summary to align goals and system. It includes key elements such as stages, employee ID, name, feedback status pending, done, due etc. From laying roadmaps to briefing everything in detail, our templates are perfect for you. You can set the stage with your presentation slides. All you have to do is download these easy to edit and customizable templates. Effective Staff Performance Optimization Techniques Workforce Appraisal Status Monitoring Themes PDF will help you deliver an outstanding performance that everyone would remember and praise you for. Do download this presentation today.

Organizational Chart Ppt PowerPoint Presentation Pictures
This is a organizational chart ppt powerpoint presentation pictures. This is a three stage process. The stages in this process are management, marketing, business, chart, organizational chart.
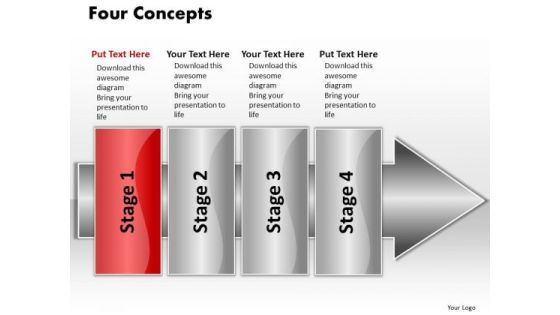
Ppt Linear Flow 4 Concepts2 PowerPoint Templates
PPT linear flow 4 concepts2 PowerPoint Templates-This diagram helps you to analyze all the connected ideas and also can be used to show aspects of an issue. This image identifies the concept of stages in process. This attractive image makes your presentations professional and interactive. Deliver amazing presentations to mesmerize your audience.-PPT linear flow 4 concepts2 PowerPoint Templates-Abstract, Arrow, Blank, Business, Chart, Circular, Circulation, 4Concepts, Conceptual, Design, Diagram, Executive, Icon, Idea, Illustration, Management, Model, Numbers, Organization, Procedure, Process, Progression, Resource, Sequence, Sequential, Stages, Steps, Strategy

Area Chart Ppt PowerPoint Presentation Picture
This is a area chart ppt powerpoint presentation picture. This is a two stage process. The stages in this process are product, in percentage, graph, management, business.

Bar Chart Ppt PowerPoint Presentation Microsoft
This is a bar chart ppt powerpoint presentation microsoft. This is a eleven stage process. The stages in this process are sales in percentage, fy, graph, success, business.

Combo Chart Ppt PowerPoint Presentation Tips
This is a combo chart ppt powerpoint presentation tips. This is a eight stage process. The stages in this process are product, growth, marketing, management.

Investor Pitch Stock Market Launch Financial Institutions Our Company Corporate Partners Structure PDF
This slide shows some of the companies such as Retail Partners, Digital Media Partners, Innovation Partners etc. with which our company has corporate tie ups and Partnerships like in US and Asia Regions. This is a investor pitch stock market launch financial institutions our company corporate partners structure pdf template with various stages. Focus and dispense information on four stages using this creative set, that comes with editable features. It contains large content boxes to add your information on topics like digital media partners, innovation partners, retail partners. You can also showcase facts, figures, and other relevant content using this PPT layout. Grab it now.
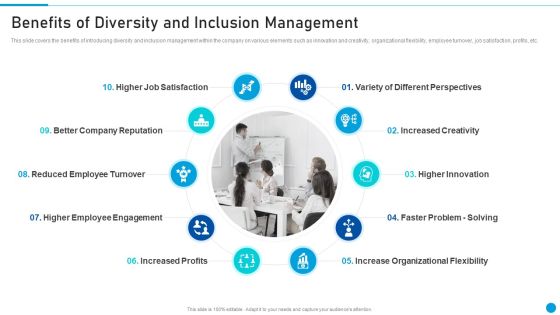
Embed Diversity And Inclusion Benefits Of Diversity And Inclusion Management Themes PDF
This slide covers the benefits of introducing diversity and inclusion management within the company on various elements such as innovation and creativity, organizational flexibility, employee turnover, job satisfaction, profits, etc. This is a Embed Diversity And Inclusion Benefits Of Diversity And Inclusion Management Themes PDF template with various stages. Focus and dispense information on ten stages using this creative set, that comes with editable features. It contains large content boxes to add your information on topics like Higher Job Satisfaction, Increased Creativity, Higher Innovation, Increase Organizational Flexibility, Increased Profits. You can also showcase facts, figures, and other relevant content using this PPT layout. Grab it now.

Digital Transformation Of Consumer Solution Cultural Shift Towards Technology In Banking Company Elements PDF
This slide shows the solutions to improve the technological operations of the banking company which includes more focus on innovation, better customer service, establishing cybersecurity in banking, etc. This is a Digital Transformation Of Consumer Solution Cultural Shift Towards Technology In Banking Company Elements PDF template with various stages. Focus and dispense information on five stages using this creative set, that comes with editable features. It contains large content boxes to add your information on topics like Focus Innovation, Better Customer, Establish Cybersecurity. You can also showcase facts, figures, and other relevant content using this PPT layout. Grab it now.

Strategic Procedure To Improve Employee Efficiency Determine Teams Learning Outcomes Designs PDF
This slide demonstrates key learning outcomes of employees throughout the team building program, it aims at assessing cognitive, physical and social satisfaction of employees.Presenting strategic procedure to improve employee efficiency determine teams learning outcomes designs pdf to provide visual cues and insights. Share and navigate important information on six stages that need your due attention. This template can be used to pitch topics like functional departments, confident about work progress, individual roles and responsibilities In addtion, this PPT design contains high resolution images, graphics, etc, that are easily editable and available for immediate download.
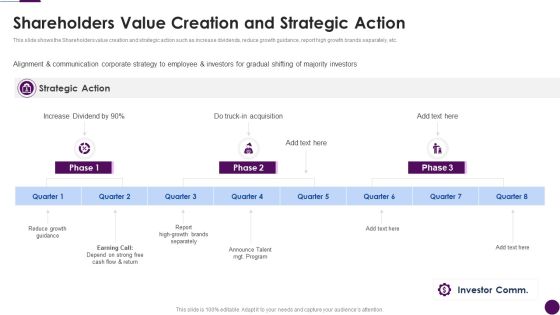
Procedure To Identify The Shareholder Value Shareholders Value Creation And Strategic Action Rules Pdf
This slide shows the Shareholders value creation and strategic action such as increase dividends, reduce growth guidance, report high growth brands separately, etc. Presenting procedure to identify the shareholder value shareholders value creation and strategic action rules pdf to provide visual cues and insights. Share and navigate important information on three stages that need your due attention. This template can be used to pitch topics like reduce growth guidance, depend on strong free cash flow and return, announce talent mgt program. In addtion, this PPT design contains high resolution images, graphics, etc, that are easily editable and available for immediate download.
Four Steps With Icons For Executive Summary Ppt Powerpoint Presentation Inspiration Styles
This is a four steps with icons for executive summary ppt powerpoint presentation inspiration styles. This is a four stage process. The stages in this process are 7 point infographic, 7 steps infographic, 7 stages infographic.

Five Steps Business Process Flow Design Execution And Monitor Ppt Powerpoint Presentation Slides Graphics
This is a five steps business process flow design execution and monitor ppt powerpoint presentation slides graphics. This is a five stage process. The stages in this process are arrow steps, arrow stages, arrow phases.

Pie Charts For Lead Scoring Ppt Background Template
This is a pie charts for lead scoring ppt background template. This is a six stage process. The stages in this process are measurable roi on lead generation program, increased conversion rates from qualified lead to opportunity, increased sales productivity and effectiveness, better alignment of marketing and sales efforts, better forecast and pipeline visibility, shortened sales cycle.

5 Level Bar Graph For Analysis With Icons Ppt PowerPoint Presentation Shapes
This is a 5 level bar graph for analysis with icons ppt powerpoint presentation shapes. This is a five stage process. The stages in this process are business, strategy, marketing, icons, growth, management.
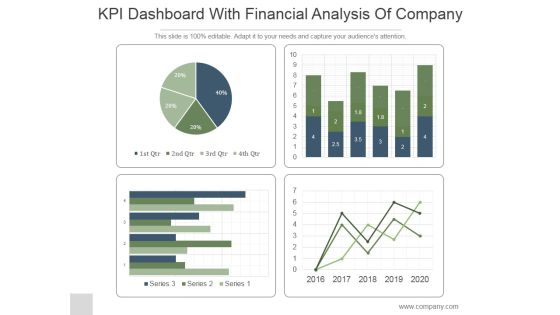
KPI Dashboard With Financial Analysis Of Company Ppt PowerPoint Presentation Backgrounds
This is a kpi dashboard with financial analysis of company ppt powerpoint presentation backgrounds. This is a four stage process. The stages in this process are business, strategy, marketing, line graph, finance.
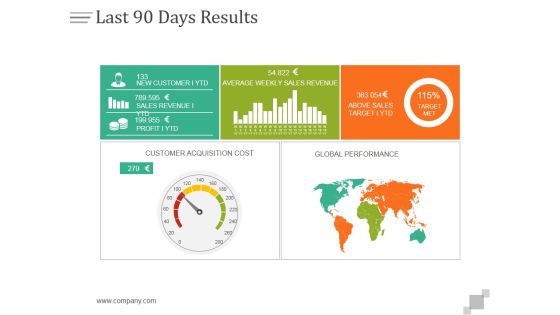
Last 90 Days Results Ppt PowerPoint Presentation Layouts
This is a last 90 days results ppt powerpoint presentation layouts. This is a five stage process. The stages in this process are business, finance, marketing, strategy, analysis, success.

Performance Overview Ppt PowerPoint Presentation Infographic Template Slide
This is a performance overview ppt powerpoint presentation infographic template slide. This is a four stage process. The stages in this process are social engagement, website review, local mobile strategy, local reach.

Current Staff Profile Years Of Experience Ppt PowerPoint Presentation File Graphics Tutorials
This is a current staff profile years of experience ppt powerpoint presentation file graphics tutorials. This is a four stage process. The stages in this process are business, marketing, strategy, finance, bar.

Process Capability Measurement Template 2 Ppt PowerPoint Presentation Gallery Graphics Example
This is a process capability measurement template 2 ppt powerpoint presentation gallery graphics example. This is a eight stage process. The stages in this process are finance, analysis, business, strategy, marketing.

Clustered Bar Graph Ppt PowerPoint Presentation Gallery Graphics Example
This is a clustered bar graph ppt powerpoint presentation gallery graphics example. This is a three stage process. The stages in this process are clustered bar graph, finance, marketing, strategy, business.
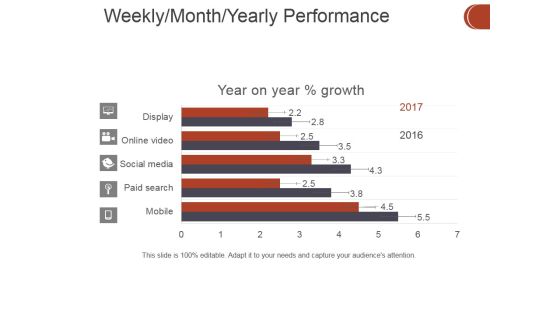
Weekly Month Yearly Performance Ppt PowerPoint Presentation Ideas Maker
This is a weekly month yearly performance ppt powerpoint presentation ideas maker. This is a five stage process. The stages in this process are business, finance, marketing, strategy, analysis, investment.

Market Analysis Ppt PowerPoint Presentation Show Design Inspiration
This is a market analysis ppt powerpoint presentation show design inspiration. This is a four stage process. The stages in this process are market segmentation, product market mapping, competitive strategies, market attractiveness.

Stacked Bar Ppt PowerPoint Presentation Styles Slide Portrait
This is a stacked bar ppt powerpoint presentation styles slide portrait. This is a three stage process. The stages in this process are unit count, business, marketing, strategy, graph, finance.
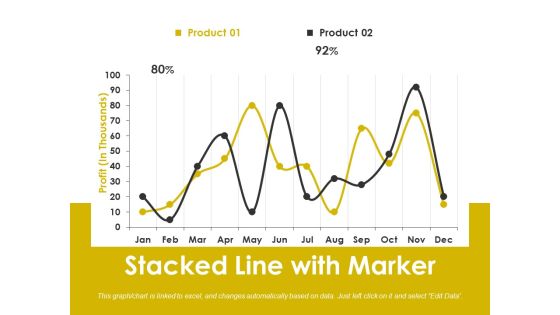
Stacked Line With Marker Ppt PowerPoint Presentation Slides File Formats
This is a stacked line with marker ppt powerpoint presentation slides file formats. This is a two stage process. The stages in this process are business, marketing, strategy, graph, finance, percentage.

Satisfaction With Word Of Mouth Marketing And Social Media Tactics Ppt PowerPoint Presentation Styles Examples
This is a satisfaction with word of mouth marketing and social media tactics ppt powerpoint presentation styles examples. This is a one stage process. The stages in this process are business, marketing, finance, strategy, graph.

Operating Efficiency Ratios Template 1 Ppt PowerPoint Presentation Layouts Introduction
This is a operating efficiency ratios template 1 ppt powerpoint presentation layouts introduction. This is a two stage process. The stages in this process are operating efficiency ratios, finance, marketing, strategy, business.
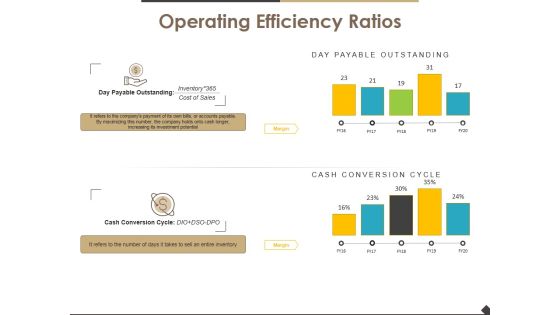
Operating Efficiency Ratios Template 2 Ppt PowerPoint Presentation Infographic Template Guide
This is a operating efficiency ratios template 2 ppt powerpoint presentation infographic template guide. This is a two stage process. The stages in this process are operating efficiency ratios, finance, marketing, strategy, business.

Clustered Column Line Ppt PowerPoint Presentation Portfolio Good
This is a clustered column line ppt powerpoint presentation portfolio good. This is a three stage process. The stages in this process are clustered column line, finance, marketing, strategy, analysis, business.
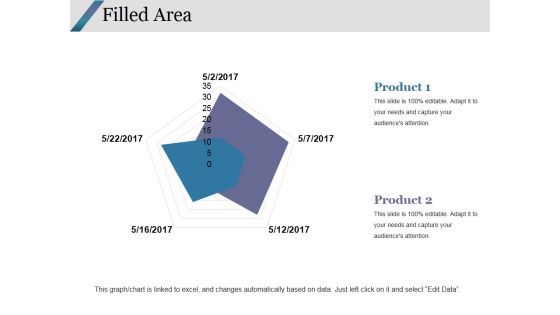
Filled Area Ppt PowerPoint Presentation Infographics Graphics Design
This is a filled area ppt powerpoint presentation infographics graphics design. This is a two stage process. The stages in this process are filled area, finance, marketing, strategy, analysis.
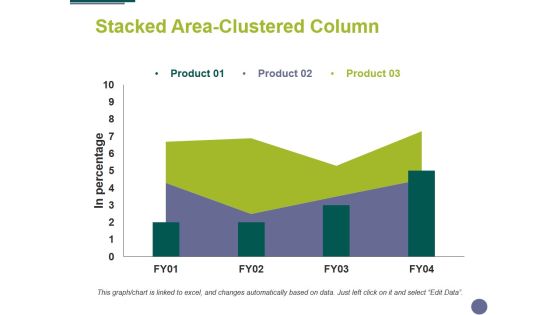
Stacked Area Clustered Column Ppt PowerPoint Presentation Ideas Objects
This is a stacked area clustered column ppt powerpoint presentation ideas objects. This is a three stage process. The stages in this process are finance, marketing, analysis, business, strategy.

Business And Financial Overview Ppt PowerPoint Presentation Layouts Icon
This is a business and financial overview ppt powerpoint presentation layouts icon. This is a one stage process. The stages in this process are business, finance, marketing, strategy, analysis.

Stacked Line Ppt PowerPoint Presentation Layouts Sample
This is a stacked line ppt powerpoint presentation layouts sample. This is a three stage process. The stages in this process are in percentage, business, marketing, finance, graph, strategy.

Capex Summary Template 1 Ppt PowerPoint Presentation Professional Mockup
This is a capex summary template 1 ppt powerpoint presentation professional mockup. This is a four stage process. The stages in this process are finance, analysis, business, marketing, strategy.

Capex Summary Template 2 Ppt PowerPoint Presentation Layouts Layout Ideas
This is a capex summary template 2 ppt powerpoint presentation layouts layout ideas. This is a four stage process. The stages in this process are finance, analysis, business, marketing, strategy.

Capital Expenditure Details Fy 18 Ppt PowerPoint Presentation Diagram Images
This is a capital expenditure details fy 18 ppt powerpoint presentation diagram images. This is a six stage process. The stages in this process are business, finance, analysis, strategy, marketing.

Capex Summary Template 1 Ppt PowerPoint Presentation Infographics Mockup
This is a capex summary template 1 ppt powerpoint presentation infographics mockup. This is a four stage process. The stages in this process are finance, marketing, business, analysis, strategy.

Capex Summary Template 2 Ppt PowerPoint Presentation Inspiration Samples
This is a capex summary template 2 ppt powerpoint presentation inspiration samples. This is a four stage process. The stages in this process are finance, marketing, business, analysis, strategy.
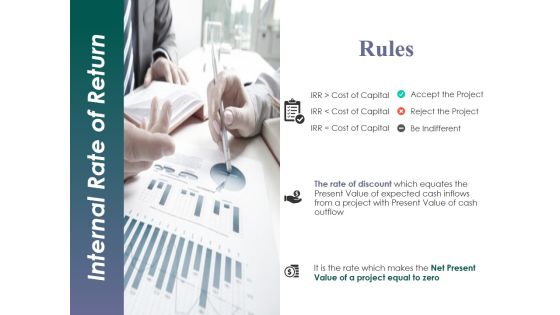
Internal Rate Of Return Template 1 Ppt PowerPoint Presentation Inspiration Skills
This is a internal rate of return template 1 ppt powerpoint presentation inspiration skills. This is a one stage process. The stages in this process are business, finance, marketing, strategy, analysis.
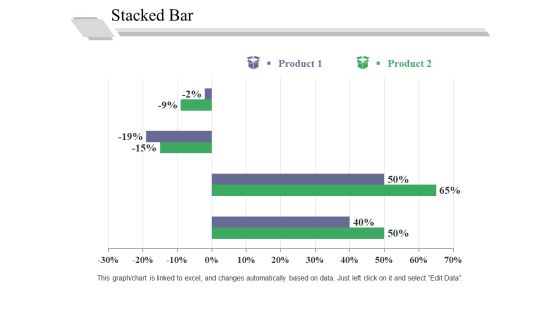
Stacked Bar Template 2 Ppt PowerPoint Presentation Professional Graphics Pictures
This is a stacked bar template 2 ppt powerpoint presentation professional graphics pictures. This is a two stage process. The stages in this process are in percentage, business, marketing, graph, strategy.
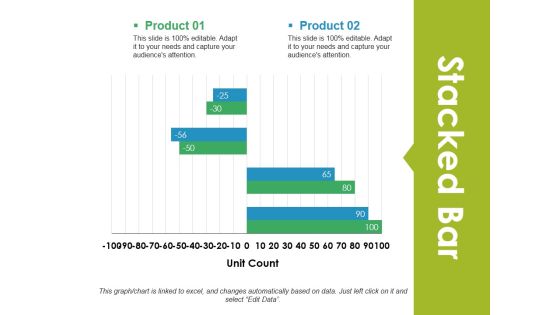
Stacked Bar Ppt PowerPoint Presentation Visual Aids Gallery
This is a stacked bar ppt powerpoint presentation visual aids gallery. This is a two stage process. The stages in this process are stacked bar, analysis, finance, marketing, strategy.
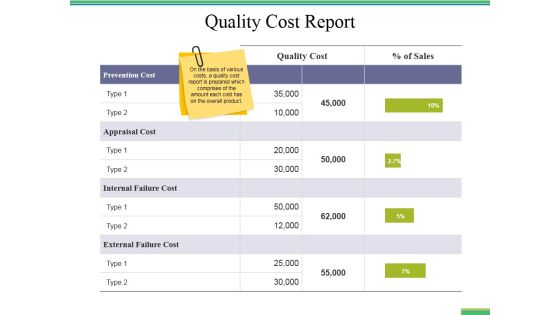
Quality Cost Report Ppt PowerPoint Presentation Styles Infographic Template
This is a quality cost report ppt powerpoint presentation styles infographic template. This is a five stage process. The stages in this process are business, finance, marketing, strategy, bar graph, analysis.
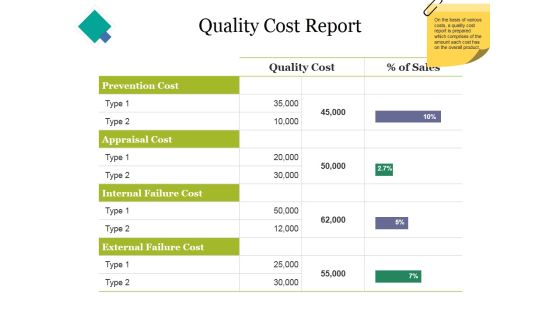
Quality Cost Report Ppt PowerPoint Presentation Styles Graphics Example
This is a quality cost report ppt powerpoint presentation styles graphics example. This is a five stage process. The stages in this process are finance, business, analysis, marketing, strategy.

clustered bar ppt powerpoint presentation model display
This is a clustered bar ppt powerpoint presentation model display. This is a two stage process. The stages in this process are clustered bar, finance, marketing, strategy, analysis, business.

Clustered Column Ppt PowerPoint Presentation Slides Microsoft
This is a clustered column ppt powerpoint presentation slides microsoft. This is a two stage process. The stages in this process are clustered column, finance, marketing, strategy, analysis, business.
