Fiscal
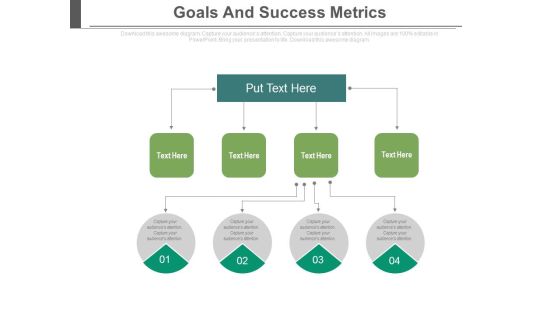
Goals And Success Metrics Ppt Slides
This is a goals and success metrics ppt slides. This is a four stage process. The stages in this process are process and flows, success, business.

PowerPoint Theme Ring Chart Diagram Growth Ppt Template
PowerPoint Theme Ring Chart Diagram Growth PPT Template-Use this graphical approach to represent global business issues such as financial data, stock market Exchange, increase in sales, corporate presentations and more.-PowerPoint Theme Ring Chart Diagram Growth PPT Template

Stock Photo Graphics For Business Reports And Charts PowerPoint Slide
This image contains graphics of business reports and charts. Download this image for business and sales presentations where you have to focus on financial growth. Dazzle the audience with your thoughts.
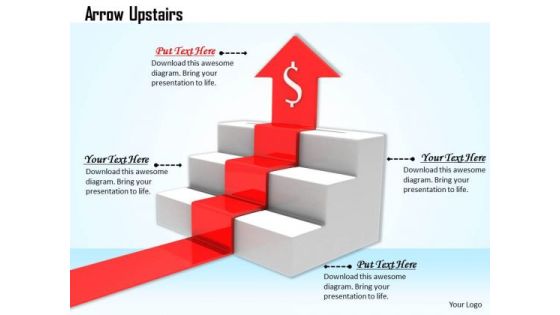
Stock Photo Red Arrow Moving Upwards In Stairs PowerPoint Slide
This image has been designed with red arrow moving upward on stairs with dollar symbol. This Image clearly relates to concept of financial growth. Use our image to drive the point to your audience and constantly attract their attention.

Stock Photo Red Growth Arrow With Percentage Symbol PowerPoint Slide
This image has been designed with red growth arrow with percentage symbol. This Image clearly relates to concept of financial growth. Use our image to drive the point to your audience and constantly attract their attention.

Consulting Slides 3 Stages Of Business Process Business Presentation
This Linear Flow diagram is a powerful tool for financial systems as well as business processed and marketing. Lay down the fundamentals to build upon and lead the way to spread good cheer to one and all.
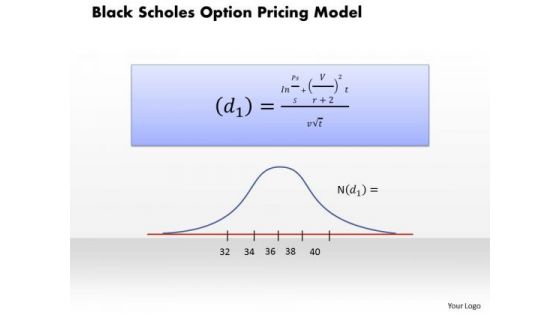
Business Framework Black Scholes Ption Pricing Model PowerPoint Presentation
This power point diagram has been crafted with graphic of black scholes ption pricing model. Use this model for various pricing valuation. Explain its graphical representation with our exclusive model. Use this diagram slide for financial presentation.

Business Framework Bond Prices And Yields PowerPoint Presentation
This power point diagram slide has been crafted with graphic of statistics of bond price and yields. Display the dependency in-between these two fields with this innovative diagram slide. This slide is very useful for financial presentations.
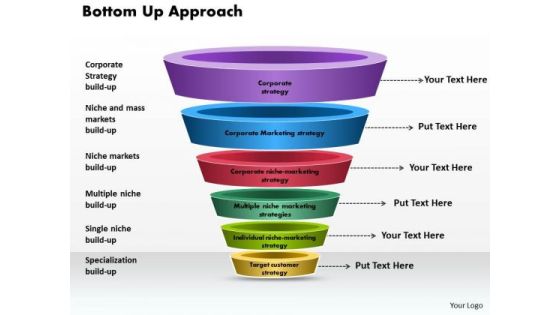
Business Framework Bottom Up Approach PowerPoint Presentation
This power point diagram slide has been crafted with bottom up approach. In this diagram, we have used multilevel funnel diagram with individual state. Use this diagram for your financial presentations and display bottom up approach in an graphical manner.
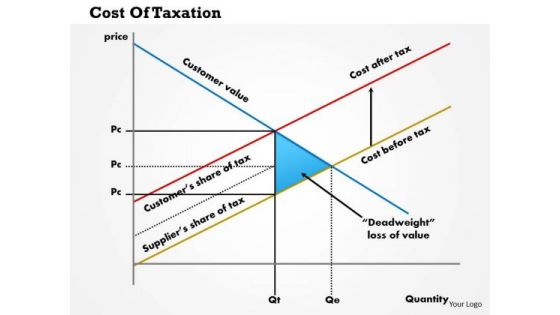
Business Framework Cost Of Taxation PowerPoint Presentation
This innovative image slide has been designed to display coat of taxation graph. This business framework template may be used to display financial ratios of taxation in your presentations. This image slide will impart professional appearance to your presentations.

Business Framework Marshall Lerner Condition Ju Curve PowerPoint Presentation
Explain the Marshall Lerner condition and J-curve with suitable graphics. This business framework has been crafted with j-curve graphics. Use this PPT in your financial presentation to explain the depreciation and devaluation of currency for any country.
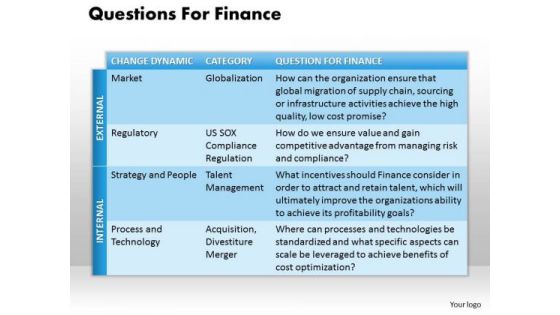
Business Framework Questions For Finance PowerPoint Presentation
This diagram depicts concepts of financial planning. Download this business diagram for your business and finance planning projects. This pre designed high quality business diagram will make your presentation simply the best.

Stock Photo Smart Phone With Downturn Arrow At Display PowerPoint Slide
This image displays yellow downward arrow on tablet. This image has been designed to display progress in your presentations. Use this image, in your presentations to express views on financial degradation and losses. Create eye-catching presentations using this image.

Stock Photo Smartphone With Red Upward Arrow PowerPoint Slide
This image displays red growth arrow on tablet. This image has been designed to display progress in your presentations. Use this image, in your presentations to express views on financial growth, success and marketing. Create eye-catching presentations using this image.
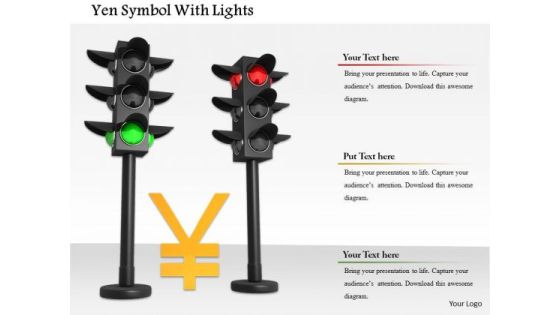
Stock Photo Yen Currency Symbol In Traffic Lights PowerPoint Slide
This image has been designed with Yen symbol along with two traffic lights. This conceptual image of yen currency symbol with traffic lights represents concepts of financial, warning and savings. This attractive image may be used to create powerful presentations.
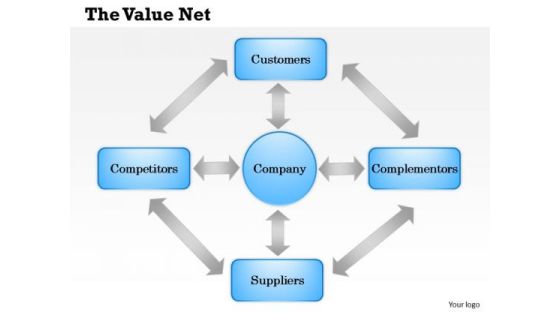
Business Framework The Value Net PowerPoint Presentation
This business power point diagram template has been designed with graphic of multiple staged. This diagram template can be used for value net calculation display in any financial and business presentations.
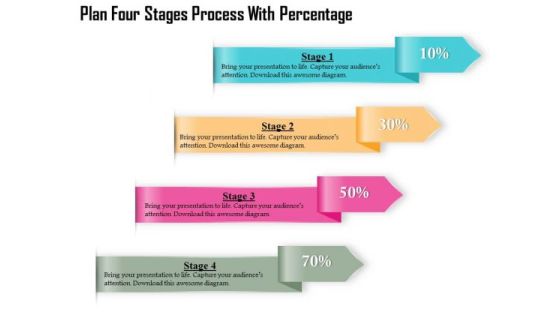
Business Diagram Four Stages Process With Percentage Presentation Template
Four multicolored tags in vertical order has been used to decorate this business diagram. This diagram contains the concept of financial data display with percent values. This diagram can be used for management and finance related presentations.

Business Diagram Three Stages Process Percentage Presentation Template
Three multicolored tags in vertical order has been used to decorate this business diagram. This diagram contains the concept of financial data display with percent values. This diagram can be used for management and finance related presentations.

Euro Currency In Puzzle Style For Finance Presentation Template
This Power Point template has been designed with graphic of euro and puzzle. This PPT contains the concept of financial problem resolving. Use this PPT for finance and business related presentation where you have to display euro currency related topics.
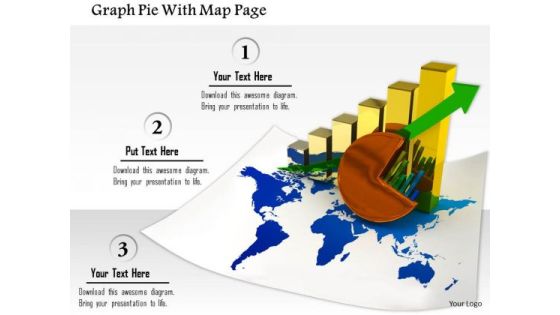
Stock Photo Graph Pie With Map Page PowerPoint Slide
This image slide contains business charts on world map. This image is designed with bar graph and pie chart on world map depicting global economy. Use this image slide to represent financial growth in any business presentation.

Business Diagram Mobile Applications Vector Illustration Concept Presentation Template
As mobile have become an indispensible part of our daily lives. This amazing mobile application icons will also add great value to your ideas and presentations in the fields of telecommunications, travelling, banks and financial institutions, e-Learning etc.
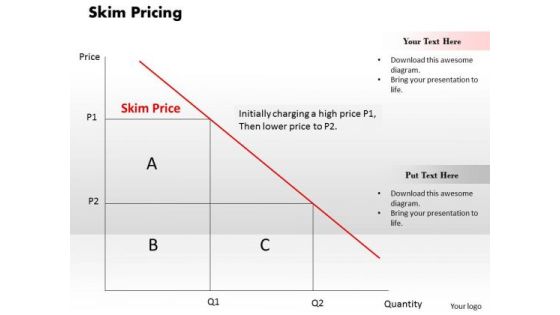
Business Framework Skim Pricing PowerPoint Presentation
This business framework power point template contains the graphic of graph. This PPT has been created with concept of skim pricing. Explain the skim pricing in your business and financial presentations by using this unique PPT.
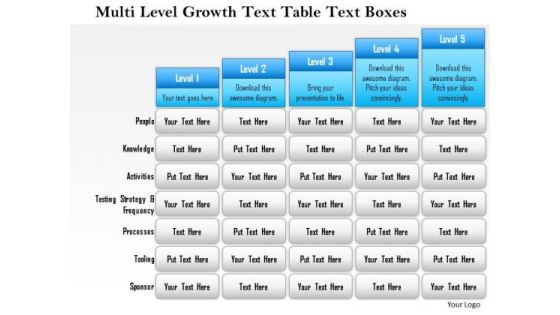
Business Framework Multi Level Growth Text Table Text Boxes 2 PowerPoint Presentation
Five staged text box style chart in bar graph design has been used to decorate this power point template slide. This diagram slide contains the multilevel growth concept. Use this PPT slide for financial growth and result analysis related topics.

Business Framework Phases Of The Credit Cycle PowerPoint Presentation
Four arrows with interconnection in circular design has been used to design this power Point template slide. This diagram slide contains the concept of credit phases. This PPT slide can be used for financial presentations.

Business Framework Poverty Index PowerPoint Presentation
A linear growth chart with text boxes has been used to decorate this Power Point template slide. This diagram slide contains the concept of poverty index. Use this index in your financial presentations to show poverty based calculation.

Business Framework Equity Valuation PowerPoint Presentation
This business framework Power Point template diagram has been crafted with graphic of three stage diagram. This PPT diagram contains the concept of equity valuation. Use this PPT diagram for your financial system related presentations.
Stock Photo Green Numbers Of 2015 On Dollars PowerPoint Slide
Green numbers of 2015 year and dollars has been used to decorate this power point template slide. This image slide contains the concept of year based financial planning. Display planning in your finance and business related presentations.
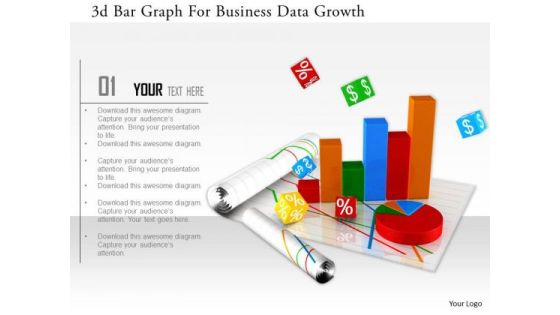
Stock Photo 3d Bar Graph For Business Data Growth Image Graphics For PowerPoint Slide
This image slide has graphics of financial charts and reports. This contains bar graph and pie chart to present business reports. Build an innovative presentations using this professional image slide.
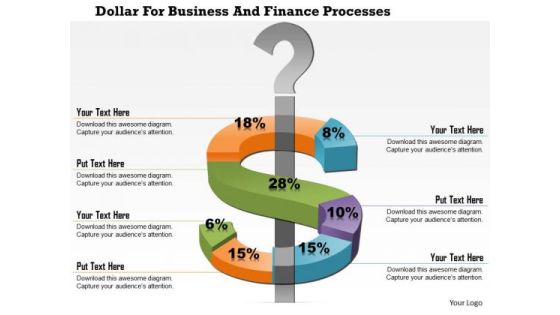
Business Diagram Dollar For Business And Finance Processes Presentation Template
This business diagram displays dollar symbol around a question mark. This diagram depicts change in dollar currency value. Use this slide to make financial and business reports and presentations.

Business Diagram Silver Capsule For Medication And Treatment Presentation Template
This business diagram displays graphics of capsule with currency symbol. It contains silver capsule with different currency signs inside it. Use this slide for health care and financial topics. Get professional with this exclusive business slide.
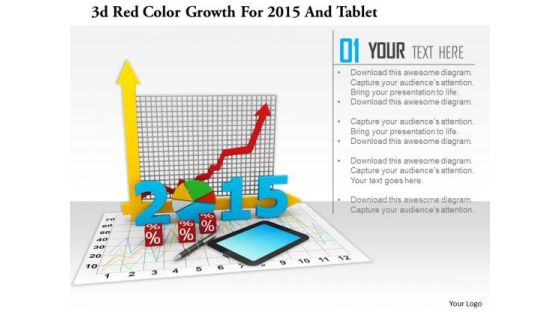
Stock Photo 3d Red Color Growth For 2015 And Tablet PowerPoint Slide
This image slide has graphics of financial charts and reports. This contains bar graph and pie chart to present business reports. Build an innovative presentation using this professional image slide.

Stock Photo Hundred Percentage Inside Lock Safety PowerPoint Slide
Concept of financial safety has been displayed in this image slide with suitable graphics. This slide has been designed with graphic of hundred percentage value and lock. Use this professional slide to make build innovative presentation on safety related topics.

Business Diagram Eight Staged Circular Puzzle Bar Graph Presentation Template
This Power Point template has been crafted with graphic of eight staged circular puzzle and bar graph. This PPT contains the financial result analysis related concept. Use this PPT for your business and success related presentations.
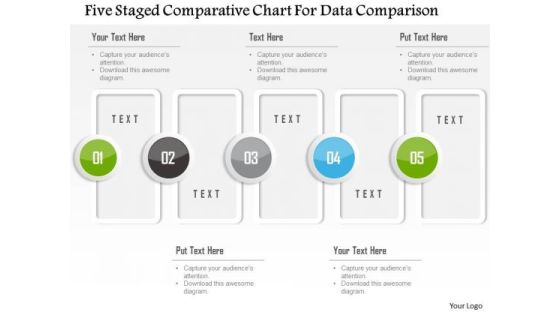
Business Diagram Five Staged Comparative Chart For Data Comparison Presentation Template
Five staged comparative chart has been used to design this power point template. This PPT contains the concept of data comparison. Use this PPT for your business and finance based data comparison in any financial presentation.
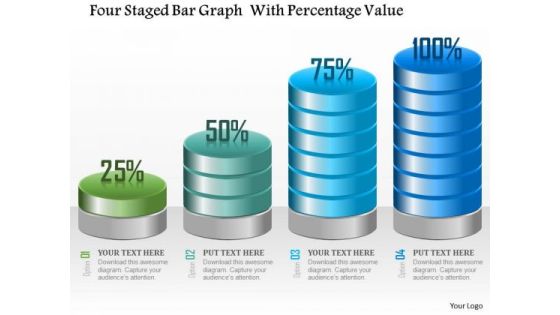
Business Diagram Four Staged Bar Graph With Percentage Value Presentation Template
Four staged bar graph with percentage value has been used to craft this power point template. This PPT contains the concept of making financial timeline and result analysis. This PPT can be used for business and finance related presentations.

Stock Photo Dollars Covered With Lock And Chain PowerPoint Slide
This Power Point image template has been designed with graphic of dollar and chain. In this image dollar is covered with chain which shows the concept of safety. Use this image template financial security related presentations.
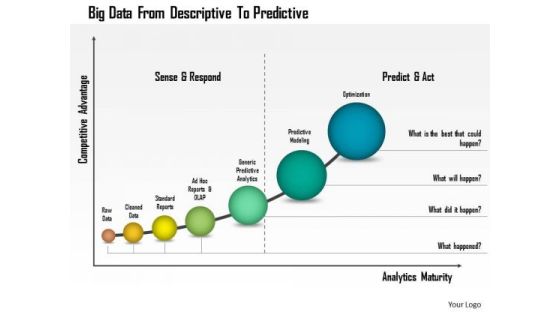
Business Diagram Big Data From Descriptive To Predictive Presentation Template
This business diagram has been designed with graphic of linear bar graph. This growing bar graph depicts the concept of big data analysis. Use this professional diagram for your financial and business analysis.

Business Diagram Diagram For Visual Data Display Presentation Template
Four colored cylindrical bars with percentage values are used to design this power point template. This diagram slide helps to display financial data analysis. Use this diagram for your business and finance related presentations.

3d Man On The Top Of Puzzle Bar Graph
This PPT has been designed with graphic of 3d man and puzzle are graph. This PPT displays the concept of result analysis and financial growth. Use this PPT for your business and finance related presentations.
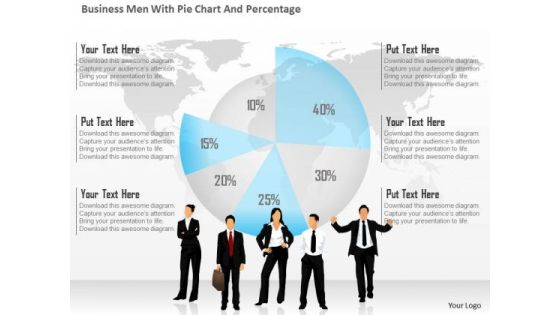
Business Diagram Business Men With Pie Chart And Percentage Presentation Template
This business diagram has been designed with graphic of business people and pie chart with percentage. This diagram is designed to depict team meeting on financial matter. This diagram offers a way for your audience to visually conceptualize the process.
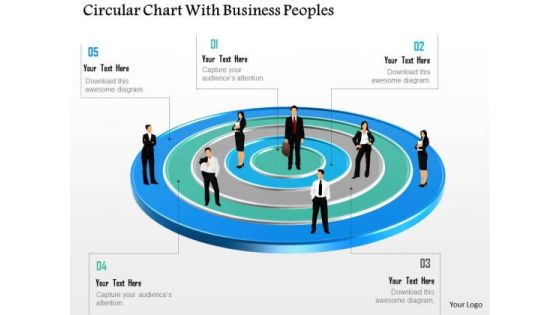
Business Diagram Circular Chart With Business Peoples Presentation Template
This business diagram has been designed with graphic of business people on circular chart. This diagram is designed to depict team meeting on financial matter. This diagram offers a way for your audience to visually conceptualize the process.
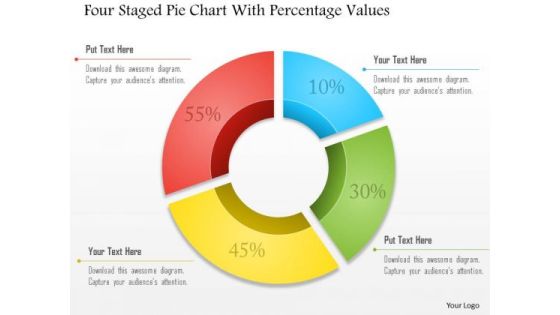
Business Diagram Four Staged Pie Chart With Percentage Values Presentation Template
Four staged pie chart and percentage values are used to design this business slide. Download this diagram to make business and financial reports. Use our above diagram to express information in a visual way.
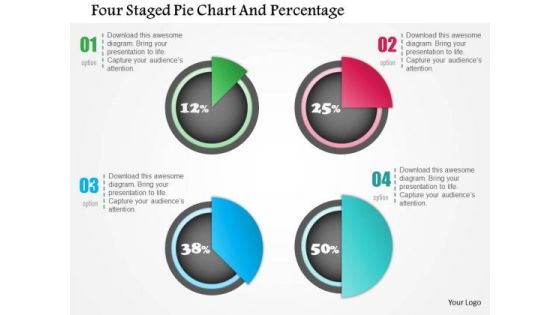
Business Diagram Four Staged Pie Chart And Percentage Presentation Template
Four staged pie chart and percentage values has been used to design this power point template. This PPT contains the concept of financial result analysis. Use this PPT for business and marketing related presentations.
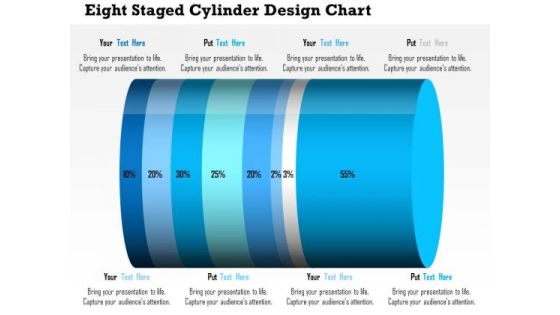
Business Daigram Eight Staged Cylinder Design Chart Presentation Templets
This business diagram contains eight staged cylinder design chart with percentage ratio. Download this diagram to display financial analysis. Use this diagram to make business and marketing related presentations.
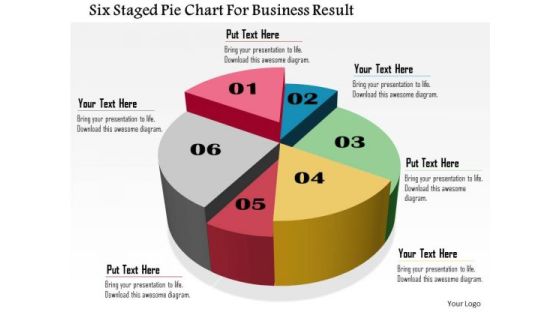
Business Daigram Six Staged Pie Chart For Business Result Presentation Templets
Six staged pie chart is used to design this business slide. Download this diagram to make business and financial reports. Use our above diagram to express information in a visual way.
Four Icons In Vertical Order PowerPoint Template
Concept of financial planning can be explained with this diagram. It contains graphics of four icons in vertical order. You can use this design to complement your business presentation.
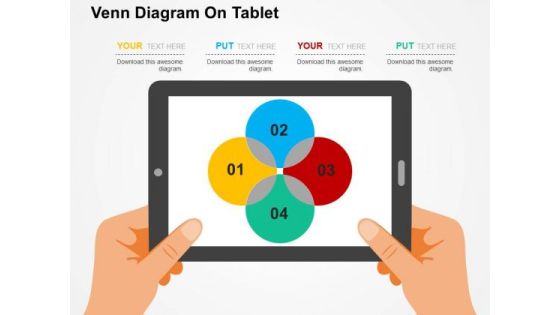
Venn Diagram On Tablet PowerPoint Template
Adjust the above image into your Presentations to visually support your content. This slide has been professionally designed with Venn diagram. This template offers an excellent background to display financial analysis.

People Thoughts For Business Planning PowerPoint Templates
This creative slide has been designed with graphics of team icons. Use this unique slide in presentations related to business and financial planning. This template adds value to your idea.

Illustration Of Dollar Growth Graph PowerPoint Template
This business slide contains graphics of dollar symbols on graph. This diagram helps to portray concept of financial planning. Present your views using this innovative slide and be assured of leaving a lasting impression.

Growth Graph With Design Elements PowerPoint Templates
The above template displays growth bar graph. This PowerPoint template signifies the concept of business and financial planning. Adjust the above diagram in your business presentations to visually support your content.

Dollar Infographic For Equity Accounting Powerpoint Template
Our professionally designed business diagram is as an effective tool for communicating concept of equity accounting. It contains dollar infographic diagram. Above slide is suitable to display financial planning and strategy.

Dollar Bulb With Idea Success Tags Powerpoint Template
Our above slide contains graphics of light bulb with dollars and idea success tags. It helps to display concepts of financial idea planning and success. Develop your strategy and communicate with your team with this professional slide design.

Dashboard Diagram For Finance And Strategic Analysis Powerpoint Slides
This PowerPoint template display graphics of clock with arrows around it and dollar symbol in center. You may use this PPT slide for financial and strategic analysis. This dashboard slide may useful for multilevel status report creation and approval process.

Four Companies With Web Services Powerpoint Slides
This PowerPoint template display graphics of four corporate buildings. You may use this PPT slide for financial and strategic analysis for web services companies. This dashboard slide may useful for multilevel status report creation and approval process.
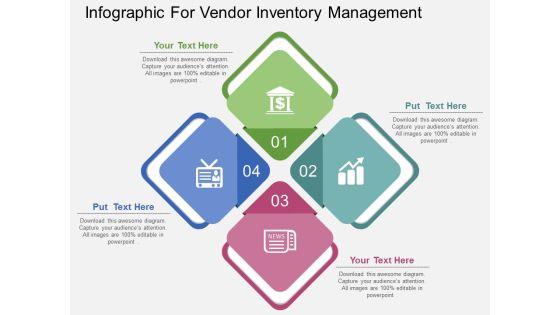
Infographic For Vendor Inventory Management Powerpoint Template
Our above slide display graphics of four connected steps with icons. Download this diagram slide to display financial management process. Adjust the above diagram in your business presentations to visually support your content.

Pie Chart Infographic Diagram Powerpoint Templates
This Power Point template has been designed with pie chart infographic. This business slide is useful to present financial ratio analysis. Use this diagram to make business presentation. Illustrate these thoughts with this slide.
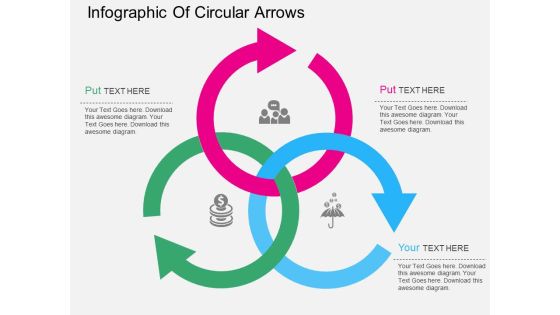
Infographic Of Circular Arrows Powerpoint Templates
This PPT slide has been designed with intersecting circular arrows. This PowerPoint template is suitable to present financial strategy for business. This professional slide helps in making an instant impact on viewers.

Four Directional Arrows Road Infographics Powerpoint Template
Download this exclusive business diagram to present four steps of financial reporting. This slide contains the four directional arrows road infographic. This PPT diagram slide is useful for business presentations.
Four Twisted Arrows With Creative Icons Powerpoint Template
This PowerPoint template has been designed with four twisted arrows and creative icons. This business diagram helps to exhibit financial accounting systems. Use this diagram to build an exclusive presentation.
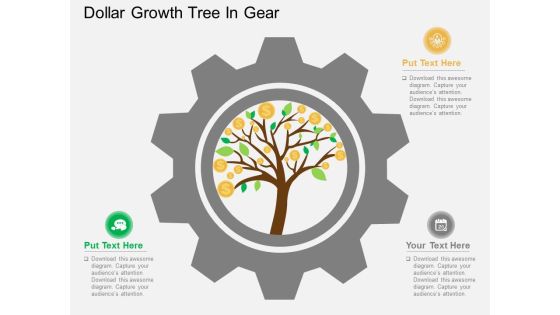
Dollar Growth Tree In Gear Powerpoint Templates
This PowerPoint slide has been designed with dollar growth tree. This diagram is designed to display financial growth planning. This professional slide helps in making an instant impact on viewers.
 Home
Home