Findings

Business Diagram Charts To Present Business Data PowerPoint Templates
Table of pie graphs has been used in this power point diagram. This business diagram contains the concept of result analysis. The template offers an excellent background to build up the various stages of your business process.

3d Happy Person With Dollars PowerPoint Templates
Concept of financial growth analysis with happiness has been defined in this PowerPoint template. This diagram slide contains the graphic of 3d man standing over the currency. Use this image for business and finance related topics in any presentation.

3d People On Pie Chart PowerPoint Templates
This power point diagram has been crafted with graphic of 3d team members on pie chart. This 3d diagram contains the concept of team management and result analysis. Use this diagram to create an impact on your viewers.

Three Graphs For Business PowerPoint Template
Adjust the above image into your Presentations to visually support your content. This slide has been professionally designed to exhibit business analysis. This template offers an excellent background to build impressive presentation.

Overlapping Circles For Market Research Design PowerPoint Template
Visually support your presentation with our above template showing overlapping circles. This slide has been professionally designed to emphasize the concept of market research and analysis. Deliver amazing presentations to mesmerize your audience.

Money Bags With Euro Growth Arrow PowerPoint Templates
The above PPT slide contains graphics of money bag with Euro growth graph. This professionally designed slide may be used to depict financial growth analysis. This slide will help your viewers automatically empathize with your thoughts
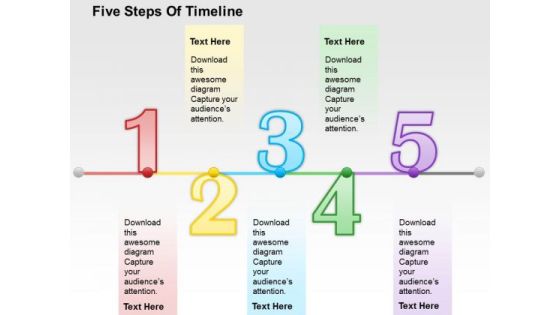
Five Steps Of Timeline PowerPoint Template
This business slide has been designed with graphics of business timeline. You may download this diagram to display timeline, planning and business analysis. Download this diagram slide to make impressive presentations.

Four Syringes In Linear Flow PowerPoint Template
Graphic of four syringes in linear flow has been used to design this business diagram. This diagram slide may be used to depict business steps in linear flow. Download this diagram for business research and analysis.
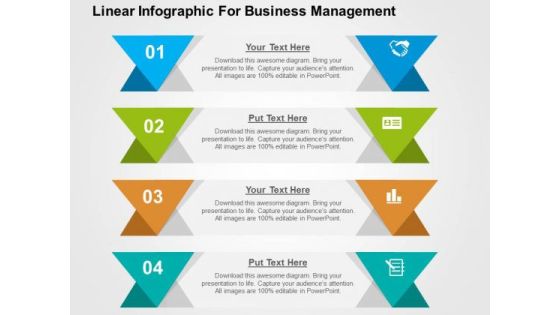
Linear Infographic For Business Management PowerPoint Template
Graphic of tags in linear flow has been used to design this business diagram. This diagram slide may be used to depict business steps in linear flow. Download this diagram for business research and analysis.
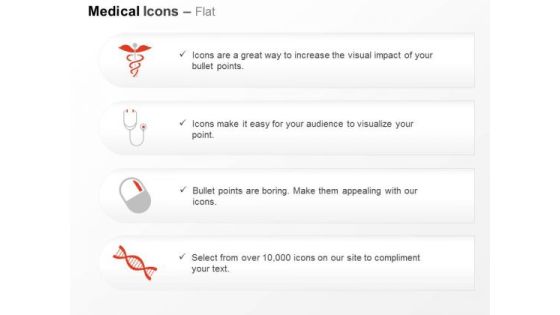
Medical Symbol Stethoscope Pill Dna Design Ppt Slides Graphics
Icons of medical symbol, stethoscope and pill with DNA have been displayed in this power point template. This icon slide relates to the concept of medical analysis and treatment. This slide is suitable for medical students and doctors.

Dashboard To Impact The Performance Powerpoint Slides
This PowerPoint template graphics of meter chart. Download this PPT chart for business performance analysis. This PowerPoint slide is of great help in the business sector to make realistic presentations and provides effective way of presenting your newer thoughts.

Four Companies With Web Services Powerpoint Slides
This PowerPoint template display graphics of four corporate buildings. You may use this PPT slide for financial and strategic analysis for web services companies. This dashboard slide may useful for multilevel status report creation and approval process.
Thumbs Up Text Tags With Finance Icons Powerpoint Template
Emphatically define your message with our above template containing thumbs up text tags with icons. This slide signifies business planning and analysis. Adjust the above diagram into your Presentations to visually support your contents.

Chart Of Four Business Steps Powerpoint Templates
This business diagram displays flow of four business steps. This editable slide is suitable to present growth management. Use this diagram for business and finance related topics and display complete data analysis in your presentation.

Pie Chart Infographic Diagram Powerpoint Templates
This Power Point template has been designed with pie chart infographic. This business slide is useful to present financial ratio analysis. Use this diagram to make business presentation. Illustrate these thoughts with this slide.

Flower Diagram For Educational Training Powerpoint Template
Colorful flowers have been used to design this PowerPoint diagram. This colorful PPT slide may be used for educational training. You can use this design for data analysis in business presentations

Four Tags For Strategy Planning Process Powerpoint Template
Steps for strategy planning can be explained with this diagram. This PowerPoint template contains diagram of four infographic tags. You can also use this design for data analysis in business presentations

Illustration Of Pencil Infographic Powerpoint Templates
The above PowerPoint template displays a pencil Infographic diagram. This PPT slide may be used to display target planning and analysis. Grab center stage with this slide and capture the attention of your audience.

Puzzle Pie Circular Infographic Diagram Powerpoint Templates
Our above PPT slide display puzzle pie circular Infographic. Download this diagram slide to display strategy and analysis. Adjust the above diagram in your business presentations to visually support your content.
Three Sections In Cube With Icons Powerpoint Template
Our above PowerPoint template has been designed with graphics of cube with icons. This PPT slide is designed for business strategy analysis. Add this diagram in your presentations to visually support your content.
Five Hexagons With Business Icons Powerpoint Templates
This PowerPoint template contains graphics of hexagons with business icons. This layout helps you to portray concepts teamwork, idea sharing and business analysis. Streamline the flow of information across the board using this diagram.
Test Tubes With Financial Data In Percentage Ratio Powerpoint Slides
This PowerPoint template contains graphics of test tubes with percentage values. You may download this PPT slide design to display financial ratio analysis. You can easily customize this template to make it more unique as per your need.
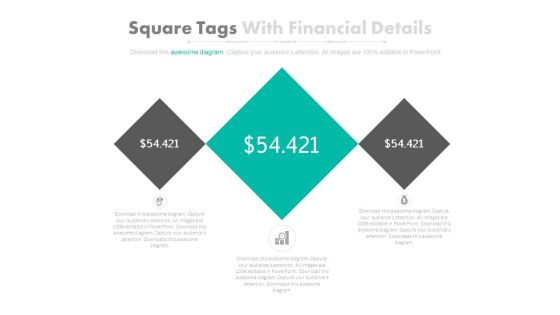
Three Square Tags With Dollars Value Powerpoint Slides
This PowerPoint template contains three square tags with dollar value. You may download this PPT slide design to display financial analysis. You can easily customize this template to make it more unique as per your need.

Tablet With Bar Graph And Pie Chart Powerpoint Templates
This business slide has been designed with business graphs on computer tablet. You may download this PPT slide to display statistical analysis. This slide will help you to sequence your thoughts.

DNA Design Infographics For Research Powerpoint Slides
This business slide contains four DNA infographic structure. This diagram is suitable to present business research and analysis. Visual effect of this diagram helps in maintaining the flow of the discussion and provides more clarity to the subject.

Human Thinking Business Process Diagram Powerpoint Slides
Our above PPT slide contains circles around human mind with icons. This PowerPoint template helps to display thinking process, business strategy and analysis. Use this diagram to impart more clarity to subject and to create more sound impact on viewers.
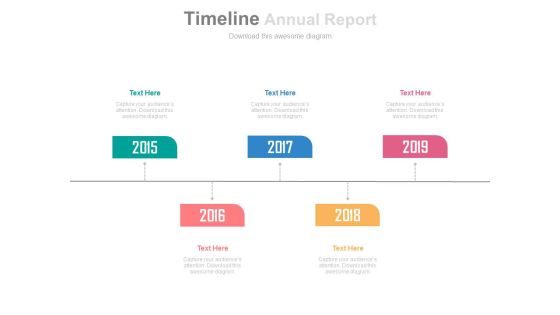
Five Staged Annual Report With Year Based Tags Powerpoint Slides
This PowerPoint timeline slide design can be used to display yearly business report. This timeline template can be used in presentations where you need to display a roadmap or it may be used for business target analysis.
Six Staged Infographics Square With Business Icons Powerpoint Templates
This business diagram displays circular puzzle infographic. This editable slide is suitable to present global communication. Use this diagram for business and finance related topics and display complete data analysis in your presentation.
Three Arrows With Icons Powerpoint Templates
This business diagram displays graphic of three arrows with icons. This power point template contains the concept of business analysis and research. Use this diagram to build unique presentation for your viewers.

Three Options Text Arrow Boxes Powerpoint Templates
This business diagram displays graphic of arrows with icons. This power point template contains the concept of business analysis and research. Use this diagram to build unique presentation for your viewers.
Hexagon With Six Business Icons Powerpoint Templates
Hexagonal layout with business icons has been displayed in this business slide. This business diagram helps to exhibit concepts of strategy, planning, communication, management and analysis. Use this diagram to build an exclusive presentation.
Hexagonal Layout With Business Icons Powerpoint Templates
Hexagonal layout with business icons has been displayed in this business slide. This business diagram helps to exhibit concepts of strategy, planning, communication, management and analysis. Use this diagram to build an exclusive presentation.
Hexagons With Seven Business Icons Powerpoint Templates
Hexagonal layout with business icons has been displayed in this business slide. This business diagram helps to exhibit concepts of strategy, planning, communication, management and analysis. Use this diagram to build an exclusive presentation.

Circular Arrows Design With Icons For Business Powerpoint Slides
Graphics of circular arrows design with icons have been displayed in this business slide. This business diagram helps to exhibit strategy analysis and management. Use this PowerPoint template to visually support your content.

Bar Graph For Marketing Research Data Powerpoint Slides
This PowerPoint template has been designed with diagram of bar graph. This PPT slide can be used to prepare presentations for profit growth report and also for financial data analysis. You can download finance PowerPoint template to prepare awesome presentations.

Bar Graph For Marketing Research Process Powerpoint Slides
This PowerPoint template has been designed with diagram of bar graph. This PPT slide can be used to prepare presentations for profit growth report and also for financial data analysis. You can download finance PowerPoint template to prepare awesome presentations.

Circle Diagram For Business Marketing Mix Powerpoint Slides
This PowerPoint template has been designed with nine steps circle chart. This PPT slide can be used to prepare presentations for profit growth report and also for financial data analysis. You can download finance PowerPoint template to prepare awesome presentations.
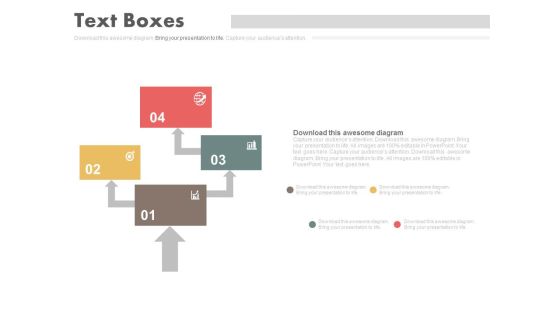
Four Steps Arrow Chart Design Powerpoint Slides
This PowerPoint template has been designed with four steps arrow chart. This PPT slide can be used to prepare presentations for marketing reports and also for financial data analysis. You can download finance PowerPoint template to prepare awesome presentations.

Pyramid For Financial Accounting Information Powerpoint Slides
This PowerPoint template has been designed with graphics of pyramid chart. This PPT slide can be used to prepare presentations for profit growth report and also for financial data analysis. You can download finance PowerPoint template to prepare awesome presentations.
Six Circular Arrows With Globe And Icons Powerpoint Template
This power point template contains graphics of six circular arrows with globe and icons. Download this PPT diagram slide to display global business analysis. Make outstanding presentation by using this creative diagram.
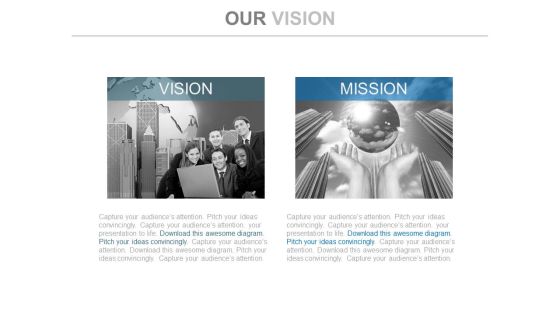
Future Vision And Mission Corporate Layout Powerpoint Slides
This PowerPoint template displays pictures of corporate team member and globe in open sky. You may download this PPT slide to depict corporate vision, mission and strategy analysis. Add this slide to your presentation and impress your superiors.
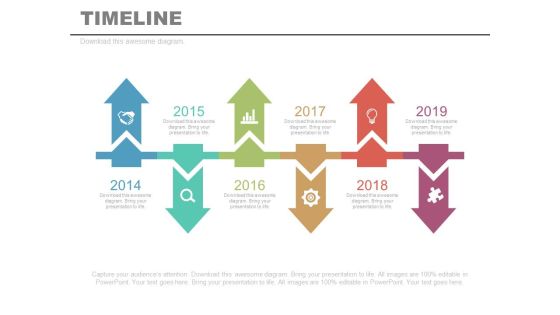
Six Linear Timeline Arrows Year Diagram Powerpoint Slides
This PowerPoint template has been designed with linear timeline steps. This PPT slide may be helpful to display year based business analysis. Download this PowerPoint timeline template to make impressive presentations.

Timeline Operations Managed As Group Powerpoint Slides
This PowerPoint timeline slide design can be used to display timeline operations. It contains sequential timeline diagram with business group. This timeline template can be used in presentations where you need to display team planning and analysis.

Two Table Charts For Business Data Powerpoint Slides
This PowerPoint template contains two tables chart. You may download this PPT slide to display statistical analysis. You can easily customize this template to make it more unique as per your need.
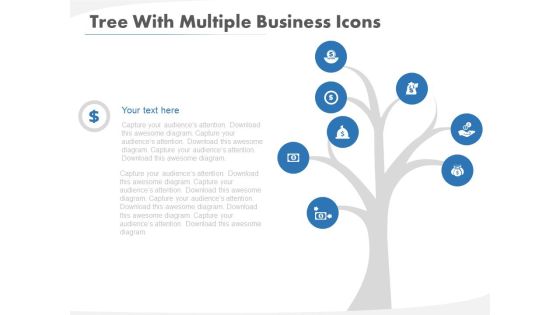
Tree Diagram For Strategic Planning Methods Powerpoint Template
This PowerPoint template has been designed with tree diagram and icons. This diagram slide may be used to depict strategic planning methods. Download this diagram for business research and analysis.
Four Icons Around Target Board For Business Powerpoint Slides
This PPT slide contains graphics of target board with four icons. You may download this PPT slide as tool for marketing target analysis. Impress your audiences by using this PPT slide.

Circular Chart With Icons For Value Chain Powerpoint Template
This PowerPoint template has been designed with circular chart and icons. This professional PPT slide is suitable to present value chain analysis. Capture the attention of your audience using this professional slide.

Checklist With Financial Planning Icons Powerpoint Slides
This PowerPoint template contains business checklist with icons. Download this diagram slide to display financial planning and analysis. Etch your views in the brains of your audience with this diagram slide.

Cost Comparison Table Chart Powerpoint Slides
Our above PPT slide displays cost comparison table chart. This diagram may be used to display cost comparison and financial analysis. Download this PowerPoint template to leave permanent impression on your audience.

Ecuador Map With Six Different Locations And Percentage Values Powerpoint Slides
This PowerPoint template displays graphics of Ecuador map with six different locations and percentage values. This Map template can be used in business presentations to depict economic analysis. This slide can also be used by school students for educational projects.

About Company Ceo Skills Profile Powerpoint Slides
This PowerPoint template contains picture of company CEO with performance analysis. You may use this as introduction slide for your presentation. Download this creative template to catch the attention of the people.

Chart For Employees Performance Measurement Powerpoint Slides
This PowerPoint template has been designed with graphics of compare chart. You may download this diagram slide for analysis of employee performance. Add this slide to your presentation and impress your superiors.

Circle Chart With Man And Woman Ratio Comparison Powerpoint Slides
This PowerPoint template has been designed with graphics of circle chart. You may download this PPT slide to depict man and woman ratio analysis. Add this slide to your presentation and impress your superiors.

Test Tubes With Percentage Data For Comparison Powerpoint Slides
This PowerPoint template has been designed with test tubes and percentage data. You may download this PPT slide to display data comparison and analysis. Add this slide to your presentation and impress your superiors.
Three Text Boxes With Percentage Values And Icons Powerpoint Slides
This PowerPoint template has been designed with text boxes and percentage data. You may download this PPT slide to display data comparison and analysis. Add this slide to your presentation and impress your superiors.
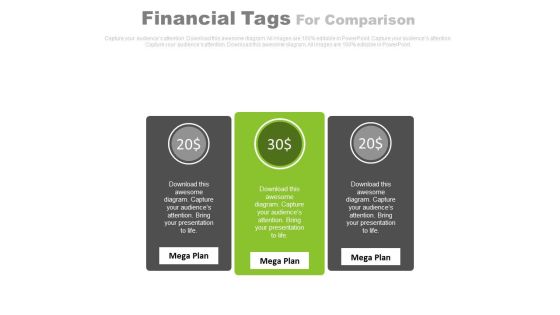
Three Text Tags Compare Chart Powerpoint Slides
This PowerPoint template has been designed with text tags and percentage data. You may download this PPT slide to display data comparison and analysis. Add this slide to your presentation and impress your superiors.
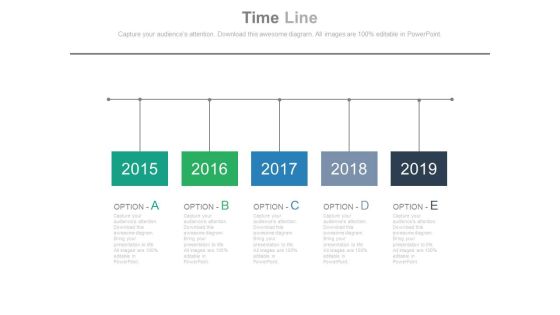
Five Options Timeline Diagram With Years Tags Powerpoint Slides
This PowerPoint template has been designed with five options timeline diagram with years tags. This PPT slide may be helpful to display year based business analysis. Download this PowerPoint timeline template to make impressive presentations.
Five Pointers Timeline Diagram With Icons Powerpoint Slides
This PowerPoint template has been designed with five pointers timeline diagram with icons. This PPT slide may be helpful to display business growth and analysis. Download this PowerPoint timeline template to make impressive presentations.

Five Steps Company Growth Timeline Powerpoint Slides
This PowerPoint timeline slide design can be used to display progress steps. It contains sequential timeline growth steps. This timeline template can be used in presentations where you need to display time planning and analysis.
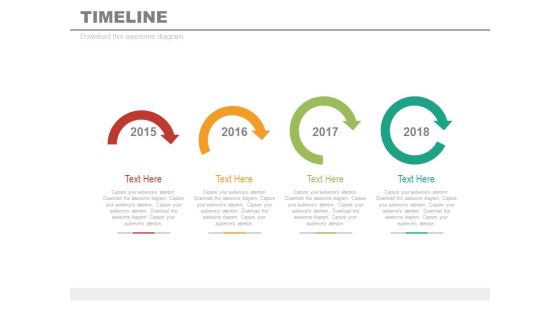
Four Sequential Arrows Timeline Diagram Powerpoint Slides
This PowerPoint timeline template can be used for multiple purposes including vision planning, new milestones and tasks. This PPT slide may be helpful to display timeline steps and year based analysis. Download this PowerPoint timeline template to make impressive presentations.
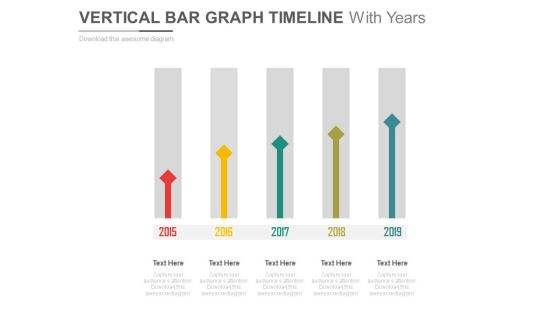
Vertical Arrows Timeline With Years Powerpoint Slides
This PowerPoint template has been designed with sequential arrows timeline diagram. This PPT slide may be helpful to display year based business analysis. Download this PowerPoint timeline template to make impressive presentations.

Year Based Timeline For Sales Planning Powerpoint Slides
This PowerPoint timeline slide design can be used to display progress steps. It contains sequential timeline tags. This timeline template can be used in presentations where you need to display sales planning and analysis.
Year Tags Sequential Timeline With Icons Powerpoint Slides
This PowerPoint timeline slide design can be used to display progress steps. It contains sequential timeline tags. This timeline template can be used in presentations where you need to display sales planning and analysis.
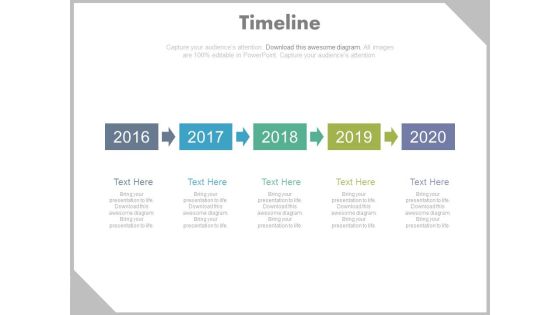
Year Tags Timeline Sequence Diagram Powerpoint Slides
This PowerPoint timeline slide design can be used to display progress steps. It contains sequential timeline tags. This timeline template can be used in presentations where you need to display sales planning and analysis.
Four Circles With Percentage Values And Icons Powerpoint Slides
This PowerPoint template displays info graphic diagram of linear circles. This diagram may be used to exhibit financial growth and analysis. Grab center stage with this slide and capture the attention of your audience.

Percentage Charts For Statistical Comparison Powerpoint Slides
This PowerPoint template has been chart of percentage values. You may download this diagram for statistical comparison and analysis. Add this PPT slide to your presentation and impress your superiors.

Four Options Circle Chart With Percentage Powerpoint Slides
This PowerPoint template has been designed with graphics of four options circle chart. This PowerPoint template may be used to display four steps of financial analysis. Prove the viability of your ideas using this impressive slide.

Four Pyramids With Growth Steps Powerpoint Slides
This business slide has been designed with four pyramids. This PowerPoint template may use to display sales growth and analysis. Prove the viability of your ideas using this impressive slide.
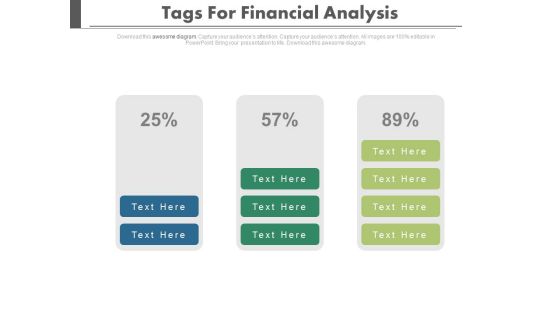
Three Stages Of Financial Growth Powerpoint Slides
Three stages of financial growth have been displayed in this power point template. This diagram helps to portray the concept of financial planning and analysis. Download this template to leave permanent impression on your audience.
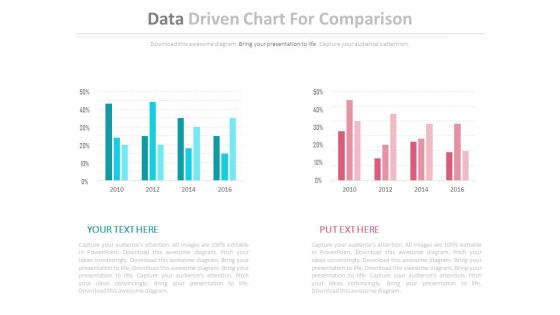
Two Data Driven Comparison Charts Powerpoint Slides
This PowerPoint template contains diagram of two data driven charts. You may use this PPT slide to depict strategic analysis for business. The color coding of this template is specifically designed to highlight you points.
Map Diagram With Bar Graph And Icons Powerpoint Slides
This PowerPoint template displays graphics of map diagram with bar graph and icons. This Map template can be used in business presentations to depict economic analysis. This slide can also be used by school students for educational projects.

Map Diagram With Four Locations Powerpoint Slides
This PowerPoint template displays graphics of map diagram with four locations and percentage values. This Map template can be used in business presentations to depict economic analysis. This slide can also be used by school students for educational projects.

Map Of Africa With Men And Women Gender Ratio Powerpoint Slides
This PowerPoint template displays graphics of Africa map with men women icons. This PPT template can be used to display gender ratio analysis. This slide can also be used by school students for educational projects.
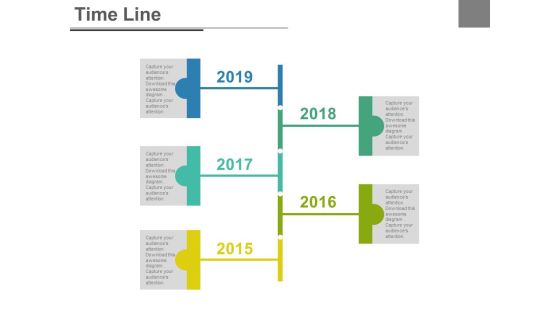
Five Staged Business Timeline Report Powerpoint Slides
This PowerPoint template has been designed with five staged business timeline report diagram. This PPT slide may be helpful to display year based business analysis. Download this PowerPoint timeline template to make impressive presentations.
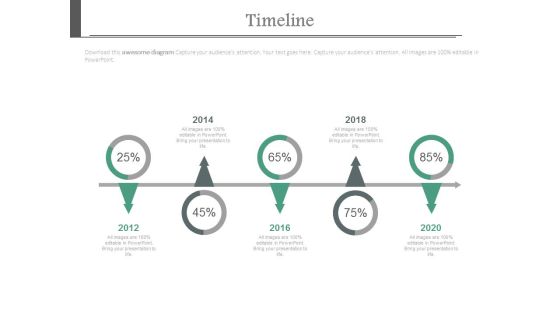
Five Yearly Sequential Timeline With Percentage Values Powerpoint Slides
This PowerPoint timeline slide design can be used to display timeline operations. It contains sequential timeline diagram with percentage values. This timeline template can be used in presentations where you need to display time planning and analysis.
Four Circles With Icons Timeline Design Powerpoint Slides
This PowerPoint timeline template can be used for multiple purposes including vision planning, new milestones and tasks. This PPT slide may be helpful to display timeline steps and year based analysis. Download this PowerPoint timeline template to make impressive presentations.

Three Arrows With Years For Timeline Planning Powerpoint Slides
This PowerPoint template has been designed with three arrows and years. This timeline template may be used to display business planning and analysis. Download this PowerPoint timeline template to make impressive presentations.
Five Circles Sequential Chart With Icons Powerpoint Slides
This PowerPoint template contains sequential chart of five circles with icons. You may download this PPT slide to depict corporate vision, mission and strategy analysis. Add this slide to your presentation and impress your superiors.
Market Trends Chart With Percentage And Icons Powerpoint Slides
This PowerPoint template has been designed with graphics of chart with percentage values and icons. This PowerPoint template may be used to market trends and financial analysis. Prove the viability of your ideas using this impressive slide.

Three Person Tags With Skill Percentage Charts Powerpoint Slides
This PowerPoint template has been designed with three person?s tags with percentage values. This Info graphic diagram may be used to display team skill analysis. Download this impressive diagram to build unique presentations.

Five Years Planning Timeline Chart Powerpoint Slides
This timeline diagram displays five sequential year steps. This PowerPoint template may be used to display when statistical analysis. This timeline design is most useful for showing important milestones and deadlines.

Timeline For Team Business Target Achievement Powerpoint Slides
This PowerPoint template contains circles around business team. It may be used to display analysis of team strategy. Download this PPT slide to demonstrate how you intend to navigate your steps towards the desired corporate goal.
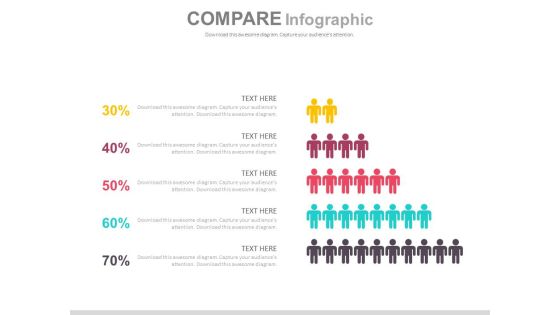
Pyramid Design For Employees Performance Powerpoint Slides
This PPT slide contains graphics of pyramid diagram. Download this PowerPoint template to depict employee?s performance and analysis. Deliver amazing presentations to mesmerize your audience by using this slide design.

Lego Blocks Design For Data Representation Powerpoint Slides
This PowerPoint template has been designed with Lego blocks diagram. You can use this ppt slide for statistical analysis or for data representation. Download this PPT slide to build impressive presentations.
Four Circles Venn Diagram With Icons Powerpoint Slides
Four circles Venn diagram has been used to design this power point template. This PPT helps to portray the concept of business data analysis. Use this PPT for your business and marketing related presentations.

Four Layered Venn Design For Business Powerpoint Slides
This power point template has been designed with graphic of four layered Venn diagram. Use this Venn diagram for business strategy and analysis. Illustrate your ideas and imprint them in the minds of your team with this template.
Three Overlapping Circles With Business Icons Powerpoint Slides
This power point template has been designed with three overlapping circles and business icons. Use this Venn diagram for business planning and strategy analysis. Illustrate your ideas and imprint them in the minds of your team with this template.
Three Steps Venn Diagram With Icons Powerpoint Slides
This power point template has been designed with graphic of Venn diagram. Use this Venn diagram for business result analysis. Illustrate your ideas and imprint them in the minds of your team with this template.
Two Circles Venn Diagram With Icons Powerpoint Slides
Venn diagram of two circles has been used to design this power point template. This PPT helps to portray the concept of business data analysis. Use this PPT for your business and marketing related presentations.
Two Layered Venn Diagram With Icons Powerpoint Slides
This power point template has been designed with graphic of two layered Venn diagram. Use this Venn diagram for business strategy and analysis. Illustrate your ideas and imprint them in the minds of your team with this template.
Magnifying Glass With Team And Icons Powerpoint Slides
This PPT slide contains graphics of magnifying glass with team and icons. You may use this PowerPoint template team strategy and analysis. Download this team slide design to deliver amazing presentations.

Curve Line Diagram With Icons Powerpoint Template
Our above slide contains diagram of curve line infographic. This infographic slide helps to exhibit business analysis. Use this diagram to impart more clarity to data and to create more sound impact on viewers.
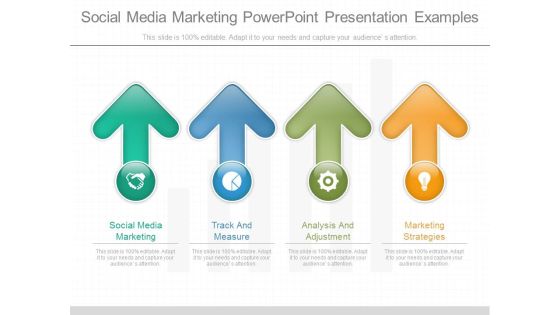
Social Media Marketing Power Point Presentation Examples
This is a social media marketing power point presentation examples. This is a four stage process. The stages in this process are social media marketing, track and measure, analysis and adjustment, marketing strategies.
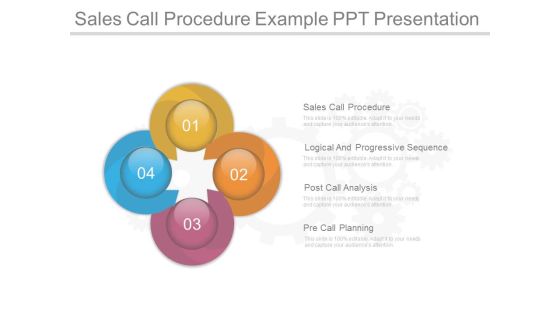
Sales Call Procedure Example Ppt Presentation
This is a sales call procedure example ppt presentation. This is a four stage process. The stages in this process are sales call procedure, logical and progressive sequence, post call analysis, pre call planning. \n \n
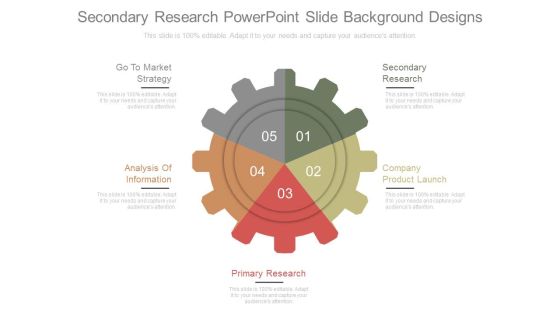
Secondary Research Powerpoint Slide Background Designs
This is a secondary research powerpoint slide background designs. This is a five stage process. The stages in this process are go to market strategy, analysis of information, secondary research, company product launch, primary research.

Strategic Plan Process Strategic Matrix Presentation Layouts
This is a strategic plan process strategic matrix presentation layouts. This is a four stage process. The stages in this process are strategic matrix, gather facts, review inputs, swot analysis, strategic plan process.
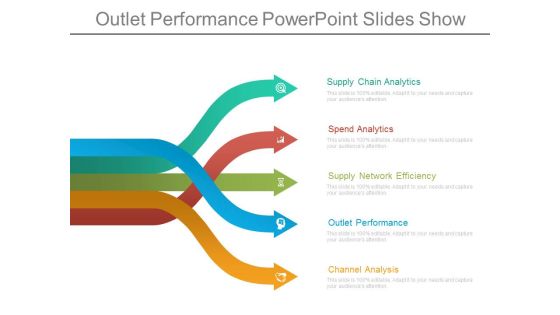
Outlet Performance Powerpoint Slides Show
This is an outlet performance powerpoint slides show. This is a five stage process. The stages in this process are supply chain analytics, spend analytics, supply network efficiency, outlet performance, channel analysis.
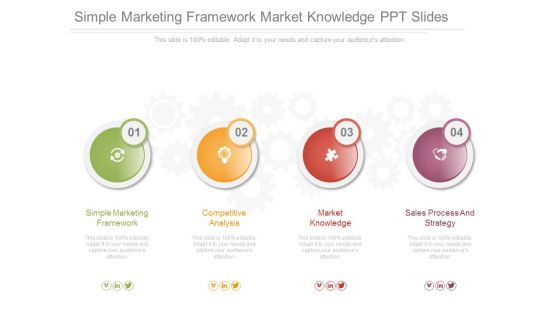
Simple Marketing Framework Market Knowledge Ppt Slides
This is a simple marketing framework market knowledge ppt slides. This is a four stage process. The stages in this process are simple marketing framework, competitive analysis, market knowledge, sales process and strategy.
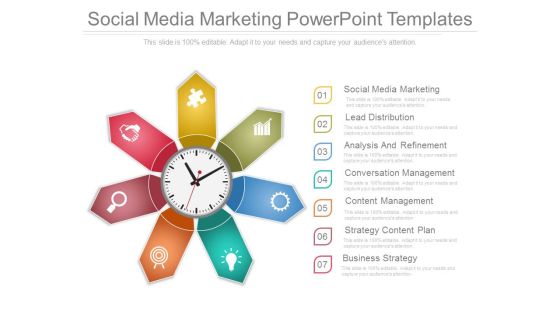
Social Media Marketing Powerpoint Templates
This is a social media marketing powerpoint templates. This is a seven stage process. The stages in this process are social media marketing, lead distribution, analysis and refinement, conversation management, content management, strategy content plan, business strategy.

Segmentation Integration Capability Sample Presentation Ppt
This is a segmentation integration capability sample presentation ppt. This is a six stage process. The stages in this process are segmentation integration capability, integration in culture, integration in processes, integration in planning, integration in infrastructure, segmentation analysis capability.

Integrated Product Management Powerpoint Slides
This is a integrated product management powerpoint slides. This is a six stage process. The stages in this process are integrated product management, organizational environment for integration, decision analysis and resolution, risk management, integrated teaming, integrated supplier management.
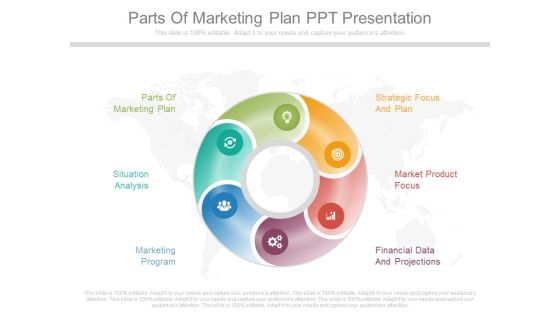
Parts Of Marketing Plan Ppt Presentation
This is a parts of marketing plan ppt presentation. This is a six stage process. The stages in this process are parts of marketing plan, strategic focus and plan, situation analysis, market product focus, marketing program, financial data and projections.

Research Meeting Powerpoint Slide Designs Download
This is a research meeting powerpoint slide designs download. This is a six stage process. The stages in this process are research meeting, sampling and questionnaire, strategy meeting, data collection, incentivising the respondents by client, data analysis and interpretation.
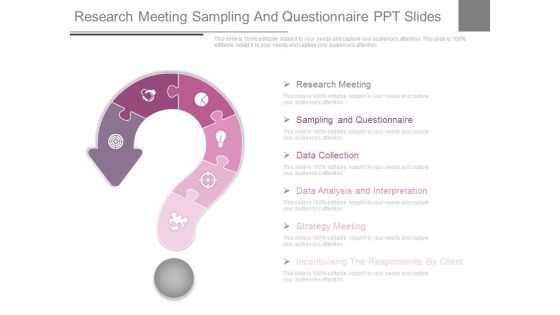
Research Meeting Sampling And Questionnaire Ppt Slides
This is a research meeting sampling and questionnaire ppt slides. This is a six stage process. The stages in this process are sampling and questionnaire, research meeting, data collection, data analysis and interpretation, strategy meeting, incentivising the respondents by client.
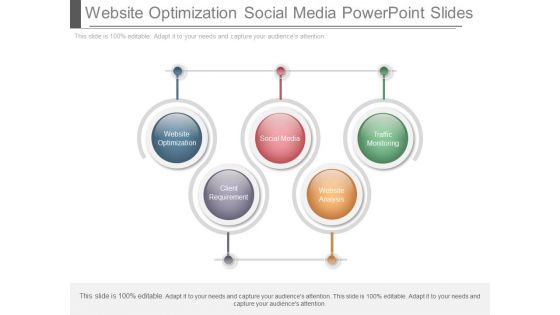
Website Optimization Social Media Powerpoint Slides
This is a website optimization social media powerpoint slides. This is a five stage process. The stages in this process are website optimization, social media, traffic monitoring, client requirement, website analysis.
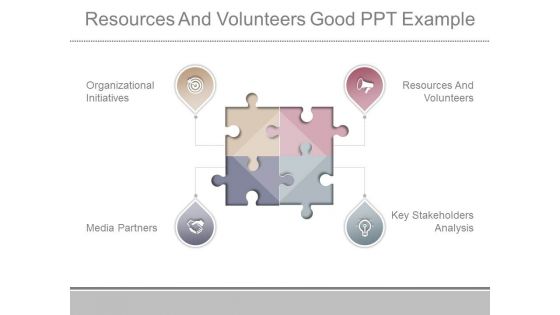
Resources And Volunteers Good Ppt Example
This is a resources and volunteers good ppt example. This is a four stage process. The stages in this process are organizational initiatives, media partners, resources and volunteers, key stakeholders analysis.

Customer Communication Testing Example Of Ppt
This is a customer communication testing example of ppt. This is a five stage process. The stages in this process are customer communication testing, market segmentation, customer experience, industry and competitive analysis, advertising research.
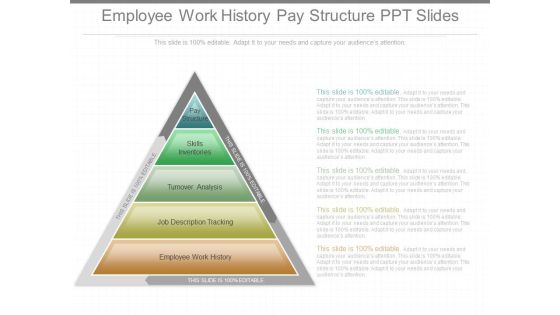
Employee Work History Pay Structure Ppt Slides
This is a employee work history pay structure ppt slides. This is a five stage process. The stages in this process are pay structure, skills inventories, turnover analysis, job description tracking, employee work history.
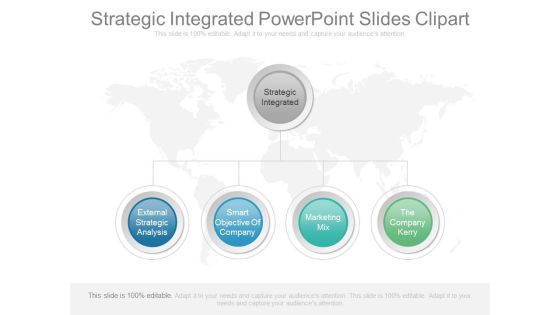
Strategic Integrated Powerpoint Slides Clipart
This is a strategic integrated powerpoint slides clipart. This is a five stage process. The stages in this process are external strategic analysis, smart objective of company, marketing mix, the company kerry, strategic integrated.

Identify Critical Threats Powerpoint Slides Background Designs
This is a identify critical threats powerpoint slides background designs. This is a five stage process. The stages in this time process are define initial team, complete situation analysis, identify critical threats, plan actions and monitoring, define scope vision targets.

Baseline Current State Powerpoint Slide Backgrounds
This is a baseline current state power point slide backgrounds. This is a five stage process. The stages in this process are baseline current state, gap analysis, benchmark target state, strategy execution, measure and control.
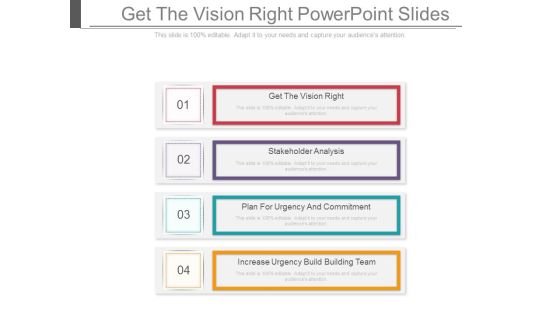
Get The Vision Right Powerpoint Slides
This is a get the vision right powerpoint slides. This is a four stage process. The stages in this process are get the vision right, stakeholder analysis, plan for urgency and commitment, increase urgency build building team.

Increase Urgency Build Building Team Presentation Powerpoint
This is a increase urgency build building team presentation powerpoint. This is a four stage process. The stages in this process are get the vision right, stakeholder analysis, increase urgency build building team, plan for urgency and commitment.
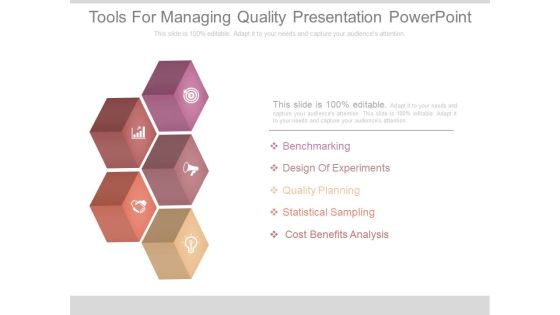
Tools For Managing Quality Presentation Powerpoint
This is a tools for managing quality presentation powerpoint. This is a five stage process. The stages in this process are benchmarking, design of experiments, quality planning, statistical sampling, cost benefits analysis.

Objectives Of Corporate Governance Ppt Diagrams
This is a objectives of corporate governance ppt diagrams. This is a five stage process. The stages in this process are legal and financial discipline, delivering values, accountability, transparency, stakeholder analysis.

Timeline Project Activity Ppt Inspiration
This is a timeline project activity ppt inspiration. This is a five stage process. The stages in this process are idea generation, evaluation control and review, feasibility analysis, environmental scanning, project report.

Strategic Issues Review Inputs Example Of Ppt Presentation
This is a strategic issues review inputs example of ppt presentation. This is a four stage process. The stages in this process are industry analysis, strategic issues, operational plans, review inputs.
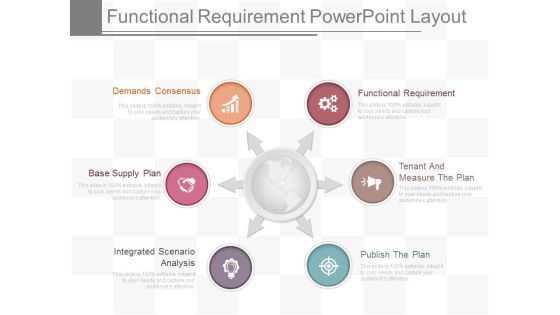
Functional Requirement Powerpoint Layout
This is a functional requirement powerpoint layout. This is a six stage process. The stages in this process are functional requirement, tenant and measure the plan, publish the plan, integrated scenario analysis, base supply plan, demands consensus.

Customer Touch Points Powerpoint Presentation Examples
This is a customer touch points powerpoint presentation examples. This is a four stage process. The stages in this process are customer touch points, social media, big data analysis, tariffs and pricing.

Sample Process Flow Tools Diagram Powerpoint Slides
This is a sample process flow tools diagram powerpoint slides. This is a seven stage process. The stages in this process are check sheet, process flow chart, pareto analysis, control chart, scatter diagram, cause and effect diagram, histogram.
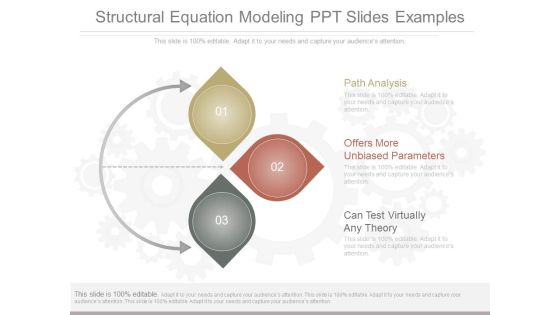
Structural Equation Modeling Ppt Slides Examples
This is a structural equation modeling ppt slides examples. This is a three stage process. The stages in this process are offers more unbiased parameters, can test virtually any theory, path analysis.
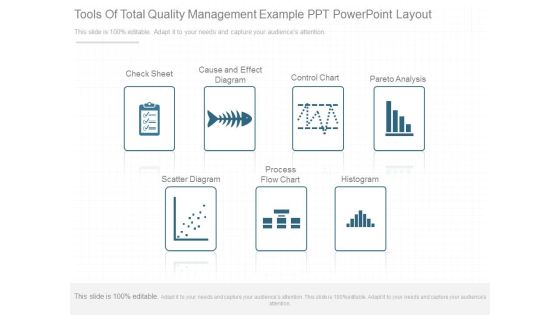
Tools Of Total Quality Management Example Ppt Powerpoint Layout
This is a tools of total quality management example ppt powerpoint layout. This is a seven stage process. The stages in this process are check sheet, cause and effect diagram, control chart, pareto analysis, scatter diagram, process flow chart, histogram.
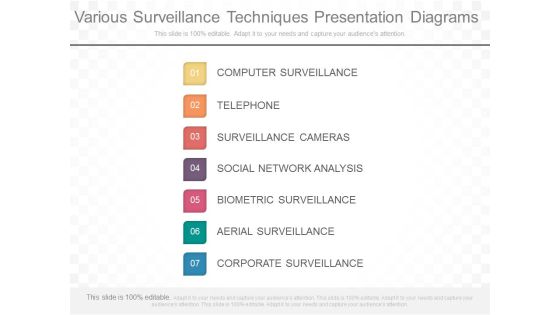
Various Surveillance Techniques Presentation Diagrams
This is a various surveillance techniques presentation diagrams. This is a seven stage process. The stages in this process are computer surveillance, telephone, surveillance cameras, social network analysis, biometric surveillance, aerial surveillance, corporate surveillance.

Corporate Performance Management Dashboard Ppt Powerpoint Topics
This is a corporate performance management dashboard ppt powerpoint topics. This is a eight stage process. The stages in this process are analysis, reporting, dashboards, financial consolidation, budgeting, forecasting, detailed planning, operational planning, corporate performance management.
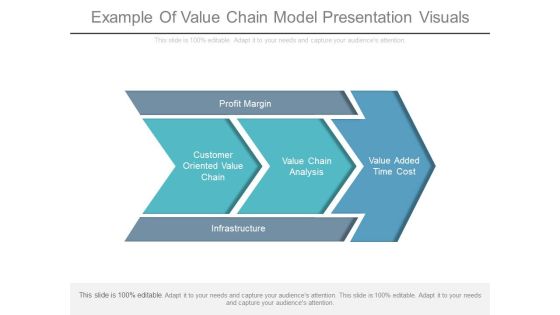
Example Of Value Chain Model Presentation Visuals
This is a example of value chain model presentation visuals. This is a five stage process. The stages in this process are profit margin, customer oriented value chain, value chain analysis, value added time cost, infrastructure.
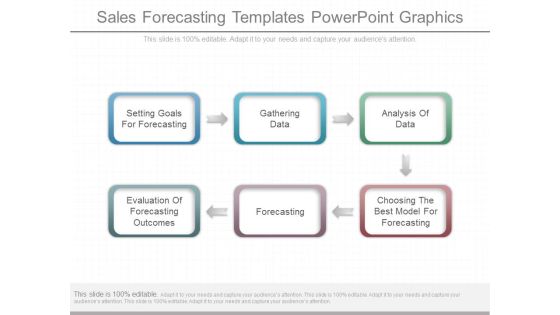
Sales Forecasting Templates Powerpoint Graphics
This is a sales forecasting templates powerpoint graphics. This is a six stage process. The stages in this process are setting goals for forecasting, gathering data, analysis of data, evaluation of forecasting outcomes, forecasting, choosing the best model for forecasting.
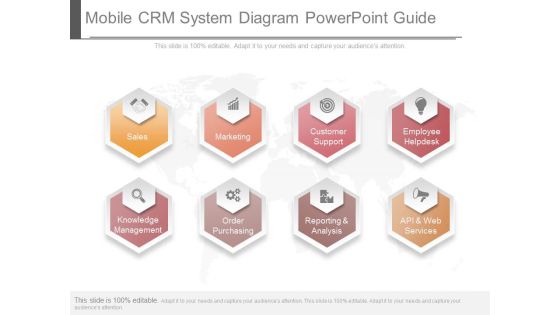
Mobile Crm System Diagram Powerpoint Guide
This is a mobile crm system diagram powerpoint guide. This is a eight stage process. The stages in this process are sales, marketing, customer support, employee helpdesk, knowledge management, order purchasing, reporting and analysis, api and web services.
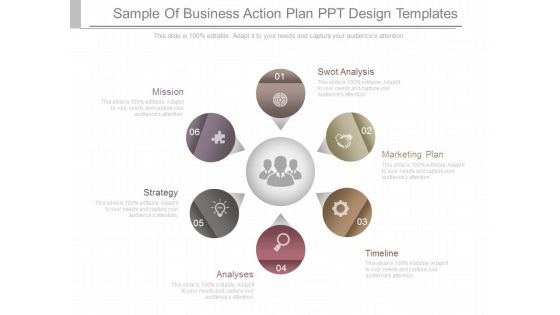
Sample Of Business Action Plan Ppt Design Templates
This is a sample of business action plan ppt design templates. This is a six stage process. The stages in this process are mission, strategy, analyses, swot analysis, marketing plan, timeline.

Sample Value Chain In Banking Industry Powerpoint Slide Backgrounds
This is a sample value chain in banking industry powerpoint slide backgrounds. This is a five stage process. The stages in this process are supplier, investment, buyer client, need analysis, divesture.

Seo Digital Marketing Example Ppt Slide Templates
This is a seo digital marketing example ppt slide templates. This is a seven stage process. The stages in this process are ranking, links, web, keyword research, analysis, content, engine.

Financial Marketing Plan Ppt Powerpoint Slide Backgrounds
This is a financial marketing plan ppt powerpoint slide backgrounds. This is a four stage process. The stages in this process are marketing plan, swot analysis, hr planning, risk management.

Important Steps In The Sales Process Diagram Presentation Ideas
This is a important steps in the sales process diagram presentation ideas. This is a seven stage process. The stages in this process are needs analysis, prospecting, leads, objections, closing, proposal, qualifying.

Basic Legal Forms Diagram Example Of Ppt Presentation
This is a basic legal forms diagram example of ppt presentation. This is a six stage process. The stages in this process are swot, plan, timeline, analysis, strategy, mission.
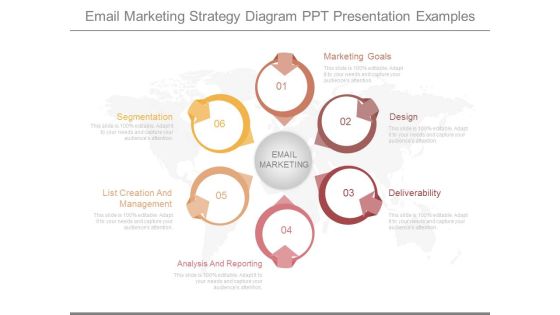
Email Marketing Strategy Diagram Ppt Presentation Examples
This is a email marketing strategy diagram ppt presentation examples. This is a six stage process. The stages in this process are segmentation, list creation and management, analysis and reporting, email marketing, marketing goals, design, deliverability.

Email Survey Service Diagram Ppt Slide Design
This is a email survey service diagram ppt slide design. This is a four stage process. The stages in this process are design, administration, data collection, report and analysis.

Leadership Strategy Formulation Powerpoint Slides Design Ideas
This is a leadership strategy formulation powerpoint slides design ideas. This is a four stage process. The stages in this process are establish identity, conduct situation analysis, set direction, work the strategy.

Mobile Marketing Business Plan Template Ppt Infographics
This is a mobile marketing business plan template ppt infographics. This is a one stage process. The stages in this process are coupons, banners, search, location based, proximity, apps, sms mms, mobile marketing, customer, strategy, analysis, rci, reliance.

Customer Effort Scorecard Template Ppt Example
This is a customer effort scorecard template ppt example. This is a four stage process. The stages in this process are customer satisfaction, demand analysis, channel analytics, repeat contact.
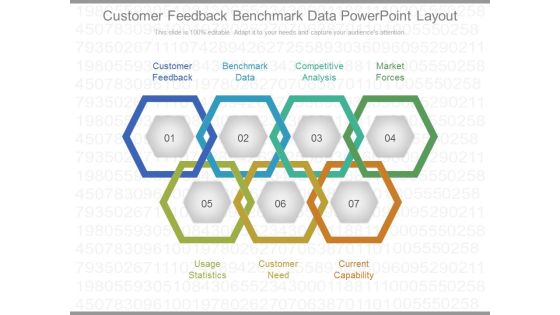
Customer Feedback Benchmark Data Powerpoint Layout
This is a customer feedback benchmark data powerpoint layout. This is a seven stage process. The stages in this process are customer feedback, benchmark data, competitive analysis, market forces, usage statistics, customer need, current capability.

Forecasting Demand For Services Example Of Ppt
This is a forecasting demand for services example of ppt. This is a seven stage process. The stages in this process are consumer, strategy and planning, manufacturer, analysis, retailer, execution, demand and supply management.
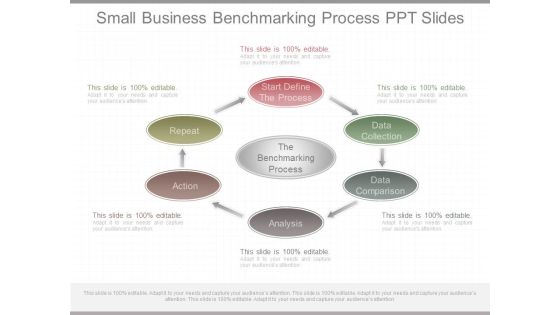
Small Business Benchmarking Process Ppt Slides
This is a small business benchmarking process ppt slides. This is a six stage process. The stages in this process are the benchmarking process, start define the process, data collection, data comparison, analysis, action, repeat.
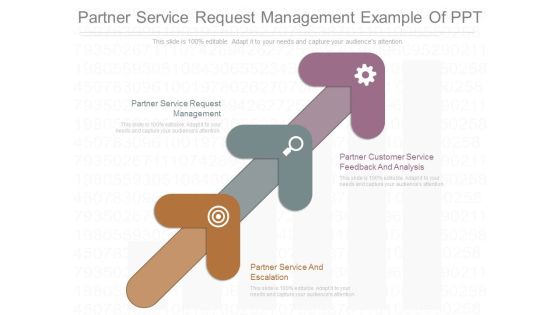
Partner Service Request Management Example Of Ppt
This is a partner service request management example of ppt. This is a three stage process. The stages in this process are partner service request management, partner customer service feedback and analysis, partner service and escalation.

Advertising Research Strategy Powerpoint Graphics
This is an advertising research strategy powerpoint graphics. This is a eight stage process. The stages in this process are understand customer, review and revise, analyze competition, research distribution, define marketing mix, financial analysis.

Competitive Position Ppt Example File
This is a competitive position ppt example file. This is a nine stage process. The stages in this process are competitive position, target segments, buying factors, core strengths, competitive analysis, market changes, cost reductions, technology apps, validation process.

Implementing Balanced Scorecard For Performance Ppt Design
This is a implementing balanced scorecard for performance ppt design. This is a eight stage process. The stages in this process are strategy, measures and targets, performance analysis, assessment, objectives, strategic initiatives, strategy map, evaluation.
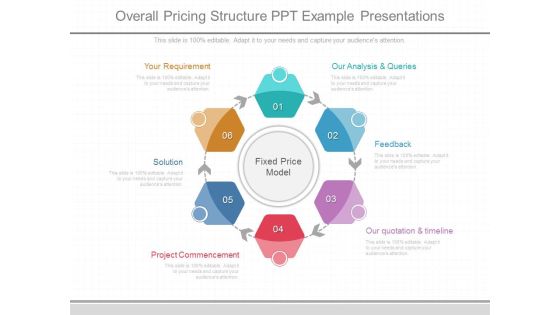
Overall Pricing Structure Ppt Example Presentations
This is a overall pricing structure ppt example presentations. This is a six stage process. The stages in this process are our analysis and queries, feedback, our quotation and timeline, project commencement, solution, your requirement.
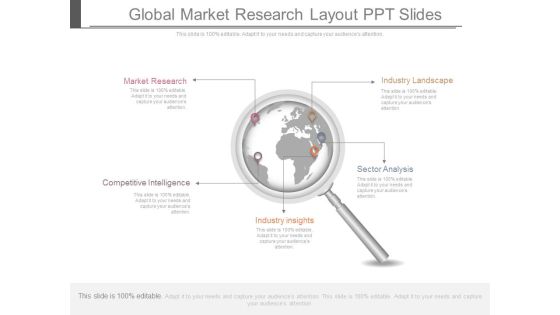
Global Market Research Layout Ppt Slides
This is a global market research layout ppt slides. This is a five stage process. The stages in this process are market research, industry landscape, competitive intelligence, sector analysis, industry insights.

Automated Medical Marketing Ppt Powerpoint Slide
This is an automated medical marketing ppt powerpoint slide. This is a nine stage process. The stages in this process are campaign automation, segmenting, business empowerment, social sharing, lead scoring, lead scoring, digital body language, campaign analysis, data integration.

Source Of Price Variation Ppt Slide Design
This is a source of price variation ppt slide design. This is a five stage process. The stages in this process are source of price variation, maximize profit, marketing analysis, services strategic, service planning.

Strategic Account Plan Template Presentation Visual Aids
This is a strategic account plan template presentation visual aids. This is a six stage process. The stages in this process are swot analysis, strategic matrix, review and adjust, gather facts, review inputs, define strategies.

Brand Valuation Method Ppt Presentation Examples
This is a brand valuation method ppt presentation examples. This is a four stage process. The stages in this process are target markets, financial analysis, demand drivers, competitive benchmarking, brand earnings, brand discount rate, competitive benchmarking.
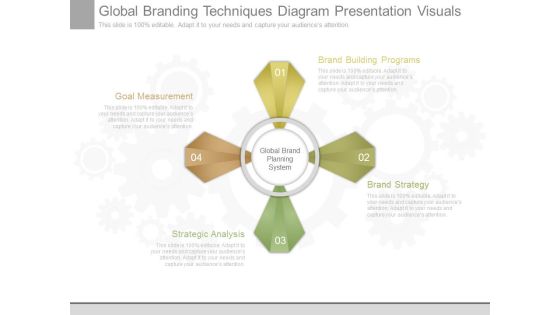
Global Branding Techniques Diagram Presentation Visuals
This is a global branding techniques diagram presentation visuals. This is a four stage process. The stages in this process are brand building programs, brand strategy, strategic analysis, goal measurement.

Anticipated Value Synergies Example Powerpoint Presentation
This is an anticipated value synergies example powerpoint presentation. This is a six stage process. The stages in this process are other techniques, discounted cash flows, leveraged buyout, public comparables, merger analysis, acquisition comparables.
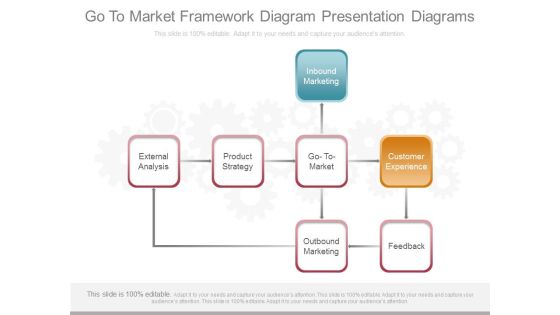
Go To Market Framework Diagram Presentation Diagrams
This is a go to market framework diagram presentation diagrams. This is a one stage process. The stages in this process are inbound marketing, external analysis, product strategy, go to market, customer experience, outbound marketing, feedback.

Pricing For New Products Ppt Example
This is a pricing for new products ppt example. This is a six stage process. The stages in this process are pricing objectives, determine demand, estimate costs, competitor analysis, price method, final price.

Essential Business Process Modeling Powerpoint Presentation Templates
This is a essential business process modeling powerpoint presentation templates. This is a six stage process. The stages in this process are management analysis, customer focus, operation focus, leadership, results, workforce solution.
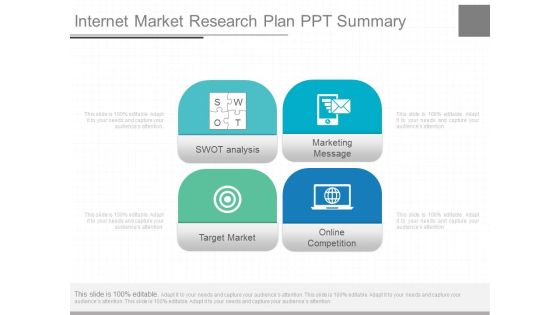
Internet Market Research Plan Ppt Summary
This is a internet market research plan ppt summary. This is a four stage process. The stages in this process are swot analysis, target market, marketing message, online competition.

Global Brand Consultancy Diagram Layout
This is a global brand consultancy diagram layout. This is a five stage process. The stages in this process are analysis and planning, application design, implementation planning, brand design, rollout.\n\n\n\n\n\n\n\n

Marketing Consumer Behavior Ppt Powerpoint Guide
This is a marketing consumer behavior ppt powerpoint guide. This is a five stage process. The stages in this process are market analysis, outcomes, consumer decision processes, market segmentation, marketing strategy.
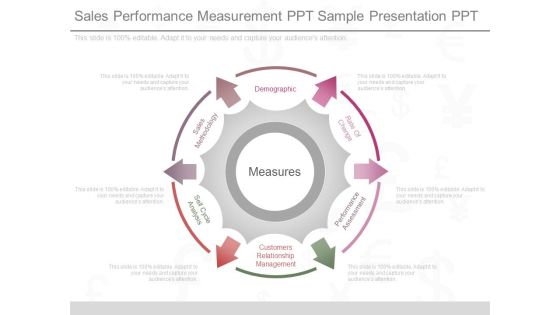
Sales Performance Measurement Ppt Sample Presentation Ppt
This is a sales performance measurement ppt sample presentation ppt. This is a six stage process. The stages in this process are measures, demographic, rate of change, performance assessment, customers relationship management, sell cycle analysis, sales methodology.
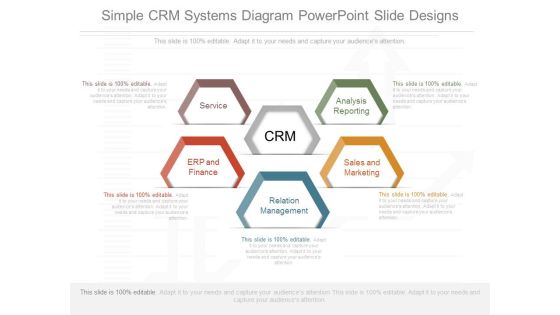
Simple Crm Systems Diagram Powerpoint Slide Designs
This is a simple crm systems diagram powerpoint slide designs. This is a five stage process. The stages in this process are service, erp and finance, analysis reporting, sales and marketing, relation management.
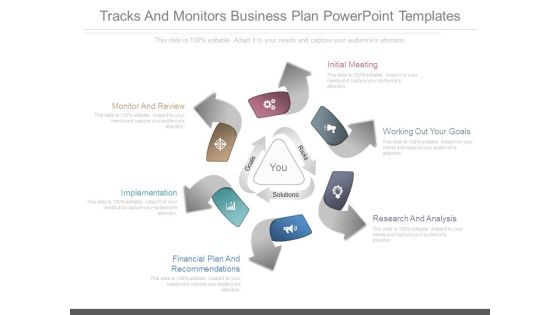
Tracks And Monitors Business Plan Powerpoint Templates
This is a Tracks And Monitors Business Plan Powerpoint Templates. This is a six stage process. The stages in this process are initial meeting, working out your goals, research and analysis, financial plan and recommendations, implementation, monitor and review.
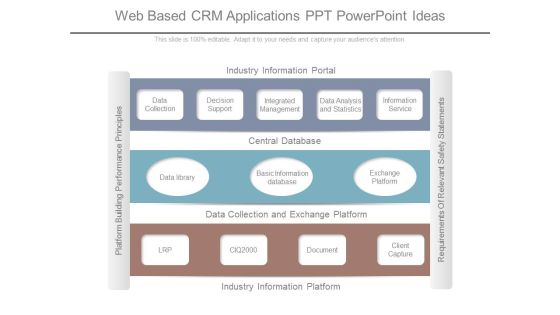
Web Based Crm Applications Ppt Powerpoint Ideas
This is a web based crm applications ppt powerpoint ideas. This is a three stage process. The stages in this process are industry information portal, data collection, decision support, integrated management, data analysis and statistics, information service, central database.
Automated Value Marketing Example Ppt Sample
This is a automated value marketing example ppt sample. This is a six stage process. The stages in this process are lead scoring, email marketing, lead nurturing, crm integration, online activity tracking, marketing analysis.

Marketing Timeline Circular Steps Example Ppt Presentation
This is a marketing timeline circular steps example ppt presentation. This is a seven stage process. The stages in this process are creation, plan, analysis, promotion, publication, research, goal.
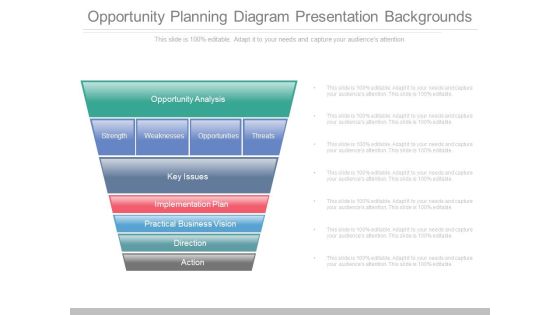
Opportunity Planning Diagram Presentation Backgrounds
This is a opportunity planning diagram presentation backgrounds. This is a seven stage process. The stages in this process are opportunity analysis, strength, weaknesses, opportunities, threats key issues, implementation plan, practical business vision.

Crm Strategy For Small Business Ppt Infographics
This is a crm strategy for small business ppt infographics. This is a four stage process. The stages in this process are sales and marketing, analysis reporting, relation management, service.

Data Integrator Designer Model Powerpoint Slide Information
This is a data integrator designer model powerpoint slide information. This is a three stage process. The stages in this process are reporting, query and analysis, performance management, analytic application, information infrastructure.

Business Management Learner Ship Techniques Diagram Example Of Ppt
This is a business management learner ship techniques diagram example of ppt. This is a seven stage process. The stages in this process are measure, execution, plan, strategy, insight, analysis, objectives.

Storage Resource Management Ppt Slides
This is a storage resource management ppt slides. This is a one stage process. The stages in this process are data collection, analysis report generation, qsm repository, threshold checker, presentation.\n\n\n\n\n\n

Business Management Learner Ship Techniques Diagram Presentation Examples
This is a business management learner ship techniques diagram presentation examples. This is a seven stage process. The stages in this process are insight, analysis, objectives, strategy, plan, execution, measure.

Search Engine Optimization Methods Ppt Slides
This is a search engine optimization methods ppt slides. This is a eight stage process. The stages in this process are analysis, site architecture, content, backlinks, indexing keywords, ranking, traffic, web, search engine optimization.

Search Engine Optimization For Blogs Ppt Slides
This is a search engine optimization for blogs ppt slides. This is a eight stage process. The stages in this process are website analysis, client requirements, keyword research, content writing, website optimization, seo submission, link building, reporting.

Seo Web Optimization Diagram Ppt Presentation
This is a seo web optimization diagram ppt presentation. This is a five stage process. The stages in this process are submission, site analysis, seo compliance, link building, strategy, seo process.

Ecommerce Flowchart Sample Diagram Powerpoint Slide Presentation
This is a ecommerce flowchart sample diagram powerpoint slide presentation. This is a seven stage process. The stages in this process are customer care service, analysis, target delivery, express shipping, shopping cart, shopping cart, purchase, saving.\n\n\n\n\n\n

Search Engine Optimization Objectives Ppt Slide
This is a search engine optimization objectives ppt slide. This is a seven stage process. The stages in this process are website traffic analysis, product awareness, reduced cost, increase site traffic, sales revenue, repeat visitors, sales leads.

Seo Process Diagram Powerpoint Presentation
This is a seo process diagram powerpoint presentation. This is a eight stage process. The stages in this process are reporting, link building, seo submission, website optimization, content writing, keyword research, client requirements, website analysis, seo process.

Web Marketing Importance Diagram Powerpoint Ideas
This is a web marketing importance diagram powerpoint ideas. This is a eleven stage process. The stages in this process are optimization, content, tag, media, blog, news feed rss, analysis, marketing, target, traffic monitoring, keywords.

Strategic Marketing Planning Process Diagram Ppt Background
This is a strategic marketing planning process diagram ppt background. This is a four stage process. The stages in this process are situation analysis, marketing tactics, marketing strategy, marketing objectives.
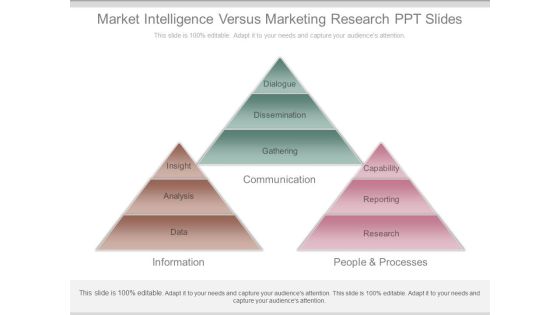
Market Intelligence Versus Marketing Research Ppt Slides
This is a market intelligence versus marketing research ppt slides. This is a three stage process. The stages in this process are dialogue, dissemination, gathering, communication, insight, analysis, data, information, capability, reporting, research, people and processes.
 Home
Home