Financial
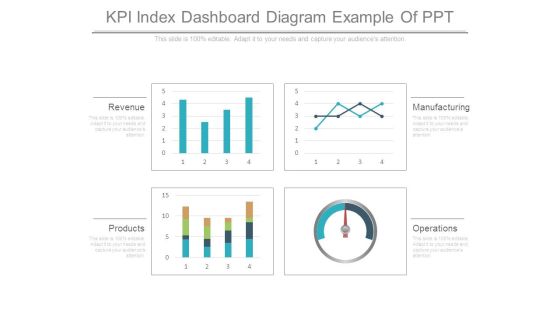
Kpi Index Dashboard Diagram Example Of Ppt
This is a kpi index dashboard diagram example of ppt. This is a four stage process. The stages in this process are revenue, products, operations, manufacturing.
Kpi Tracking Software Services Ppt Powerpoint Graphics
This is a kpi tracking software services ppt powerpoint graphics. This is a three stage process. The stages in this process are operations, revenue, manufacturing.

Pipeline Analysis Template Powerpoint Show
This is a pipeline analysis template powerpoint show. This is a five stage process. The stages in this process are revenue in thousands, pyramid, business.

Sales Kpis Monitor Dashboard Ppt Infographic Template
This is a sales kpis monitor dashboard ppt infographic template. This is a one stage process. The stages in this process are promotion, marketing, sales revenue, social channels.
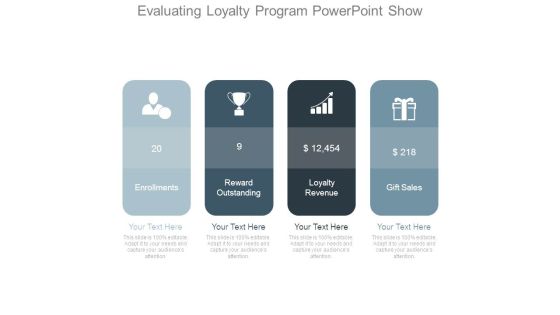
Evaluating Loyalty Program Powerpoint Show
This is a evaluating loyalty program powerpoint show. This is a four stage process. The stages in this process are enrollments, reward outstanding, loyalty revenue, gift sales.
Loyalty Program Metrics Ppt Icon
This is a loyalty program metrics ppt icon. This is a four stage process. The stages in this process are enrollments, reward outstanding, loyalty revenue, gift sales.

Loyalty Program Performance Metrics Ppt Background
This is a loyalty program performance metrics ppt background. This is a four stage process. The stages in this process are enrollments, reward outstanding, revenue, gift sales.

Competitors Analysis Marketing Report Ppt PowerPoint Presentation Tips
This is a competitors analysis marketing report ppt powerpoint presentation tips. This is a five stage process. The stages in this process are competitor, revenue, profit.

Crm Dashboard Kpis Ppt PowerPoint Presentation Pictures
This is a crm dashboard kpis ppt powerpoint presentation pictures. This is a five stage process. The stages in this process are revenue, acquisition, active subscribers.

Funnel Ppt PowerPoint Presentation Infographics
This is a funnel ppt powerpoint presentation infographics. This is a five stage process. The stages in this process are acquisition, activation, retention, revenue, referral.

Kpi Dashboard Ppt PowerPoint Presentation Good
This is a kpi dashboard ppt powerpoint presentation good. This is a one stage process. The stages in this process are outcasts, earned revenue, successful adverts, sold products.

Competitor Analysis Template Ppt PowerPoint Presentation Designs
This is a competitor analysis template ppt powerpoint presentation designs. This is a six stage process. The stages in this process are profit, revenue, criteria, market share.

Channel Marketing Planning Ppt PowerPoint Presentation Microsoft
This is a channel marketing planning ppt powerpoint presentation microsoft. This is a seven stage process. The stages in this process are target market, vendor relationships, revenue size.
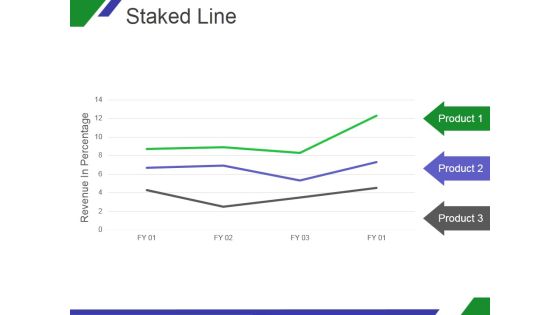
Staked Line Ppt PowerPoint Presentation Slide
This is a staked line ppt powerpoint presentation slide. This is a three stage process. The stages in this process are revenue in percentage, product, business.

Stacked Line Ppt PowerPoint Presentation Guide
This is a stacked line ppt powerpoint presentation guide. This is a three stage process. The stages in this process are revenue in percentage, product.

Competitor Analysis Template Ppt PowerPoint Presentation Inspiration
This is a competitor analysis template ppt powerpoint presentation inspiration. This is a six stage process. The stages in this process are revenue, profit, market share, competitor, criteria.
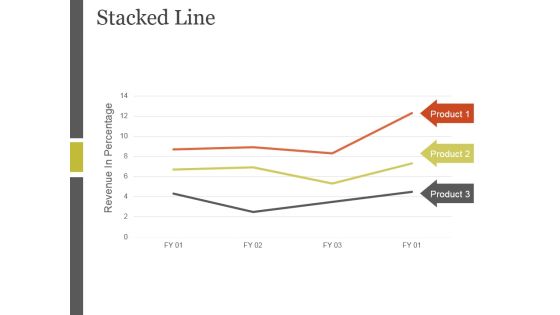
Stacked Line Ppt PowerPoint Presentation Inspiration
This is a stacked line ppt powerpoint presentation inspiration. This is a three stage process. The stages in this process are revenue in percentage, stacked line, product.

Stacked Line Ppt PowerPoint Presentation File Show
This is a stacked line ppt powerpoint presentation file show. This is a three stage process. The stages in this process are revenue in percentage, product.
Stacked Line Ppt PowerPoint Presentation Gallery Display
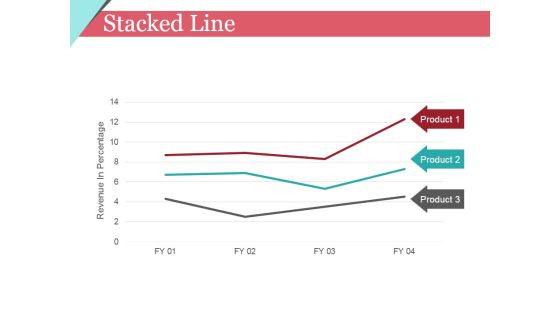
This is a stacked line ppt powerpoint presentation gallery display. This is a three stage process. The stages in this process are revenue in percentage, product, graph, finance.

Business Analysis Ppt PowerPoint Presentation Professional Templates
This is a business analysis ppt powerpoint presentation professional templates. This is a four stage process. The stages in this process are high, low, market share, revenue growth.

Crowdfunding Escalator Ppt PowerPoint Presentation Inspiration Design Ideas
This is a crowdfunding escalator ppt powerpoint presentation inspiration design ideas. This is a five stage process. The stages in this process are maturity, expansion, validation, revenue, idea.

Competitor Analysis Ppt Powerpoint Presentation Pictures Graphics
This is a competitor analysis ppt powerpoint presentation pictures graphics. This is a six stage process. The stages in this process are revenue, market share, profit, main activity.
Stacked Line Ppt PowerPoint Presentation Pictures Maker
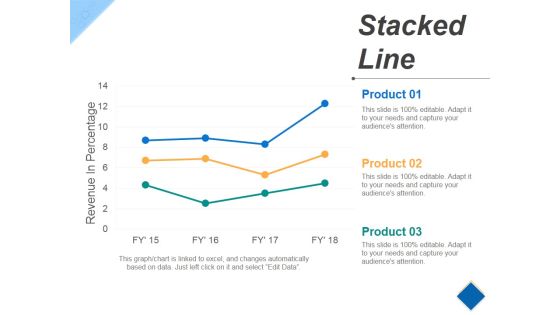
This is a stacked line ppt powerpoint presentation pictures maker. This is a three stage process. The stages in this process are revenue in percentage, growth, success, product.
Stacked Line Ppt PowerPoint Presentation Infographics Slideshow
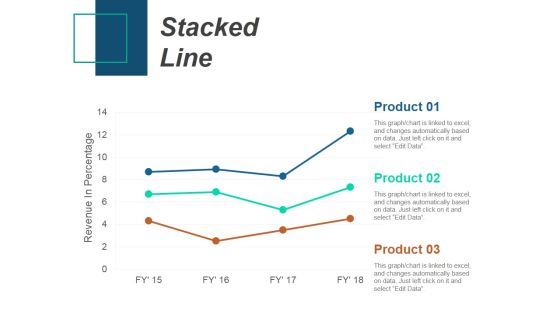
This is a stacked line ppt powerpoint presentation infographics slideshow. This is a three stage process. The stages in this process are stacked line, revenue in percentage, product.

Campaign Report Ppt PowerPoint Presentation Show Tips
This is a campaign report ppt powerpoint presentation show tips. This is a five stage process. The stages in this process are spam, open, delivered, transactions, revenue.

Forecast And Projection Ppt PowerPoint Presentation Inspiration Ideas
This is a forecast and projection ppt powerpoint presentation inspiration ideas. This is a three stage process. The stages in this process are revenue, expenses, purchases.
Forecast And Projection Ppt PowerPoint Presentation Portfolio Show
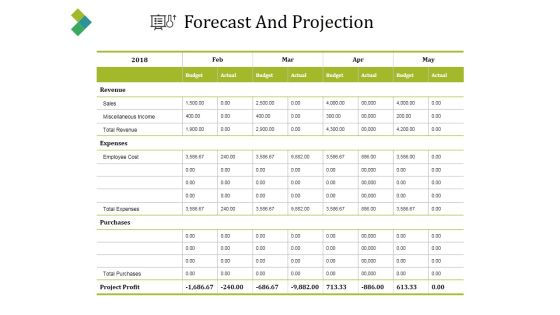
This is a forecast and projection ppt powerpoint presentation portfolio show. This is a four stage process. The stages in this process are revenue, sales, budget, actual, expenses.

Competitor Comparison Template 1 Ppt PowerPoint Presentation Pictures Infographics
This is a competitor comparison template 1 ppt powerpoint presentation pictures infographics. This is a five stage process. The stages in this process are competitor, profit, revenue.

Competitor Comparison Template 2 Ppt PowerPoint Presentation Show Design Ideas
This is a competitor comparison template 2 ppt powerpoint presentation show design ideas. This is a four stage process. The stages in this process are competitor, profit, revenue.

Business Model Framework Ppt PowerPoint Presentation Infographics Deck
This is a business model framework ppt powerpoint presentation infographics deck. This is a eight stage process. The stages in this process are services, revenue, customers, competencies, costs.

Evaluating Rank Prospects Impact Analysis Lead Scoring On Return On Investment Ppt Professional Skills PDF
After successful implementation of effective lead scoring mechanism, the lead prioritization results helps sales representatives in addressing more profitable leads at right time. It improves number leads converted to opportunities revenue generated per deal, etc. Deliver an awe-inspiring pitch with this creative evaluating rank prospects impact analysis lead scoring on return on investment ppt professional skills pdf bundle. Topics like metric, leads sent to sales, opportunity win rate, revenue per deal, revenues generated, revenue per sales representative can be discussed with this completely editable template. It is available for immediate download depending on the needs and requirements of the user.

Investor Pitch Deck Collect Funding Spot Market Where The Company Has Presence Demonstration PDF
The slide provides the key facts related to geographic presence of the company. Additionally, it provides the revenue split by geography and top 10 countries which has highest contribution in the companys revenue in the year 2020. Deliver and pitch your topic in the best possible manner with this investor pitch deck collect funding spot market where the company has presence demonstration pdf. Use them to share invaluable insights on revenue split by geographic regions, 10 countries by revenue generation in 2020 and impress your audience. This template can be altered and modified as per your expectations. So, grab it now.
How Aviation Industry Coping With COVID 19 Pandemic Estimated Airlines Loss On Implementing 3 Months Lockdown Icons PDF
Mentioned slide portrays estimated airlines loss on three months lockdown implementation. It also includes the details about region, Revenue passenger kilometers and gross passenger revenue for complete 2020.Deliver an awe inspiring pitch with this creative how aviation industry coping with COVID 19 pandemic estimated airlines loss on implementing 3 months lockdown icons pdf. bundle. Topics like region of airline registration, gross passenger revenue, revenue passenger kilometers can be discussed with this completely editable template. It is available for immediate download depending on the needs and requirements of the user.

Internal And External Logistics Management Procedure Key Players Of Logistic Industry Introduction PDF
This slide covers the key players of logistic industry along with their rank in 2021 and 2020, net revenues, gross revenues and number of employees. Presenting internal and external logistics management procedure key players of logistic industry introduction pdf to provide visual cues and insights. Share and navigate important information on one stage that need your due attention. This template can be used to pitch topics like net revenue, gross revenue, employees. In addtion, this PPT design contains high resolution images, graphics, etc, that are easily editable and available for immediate download.
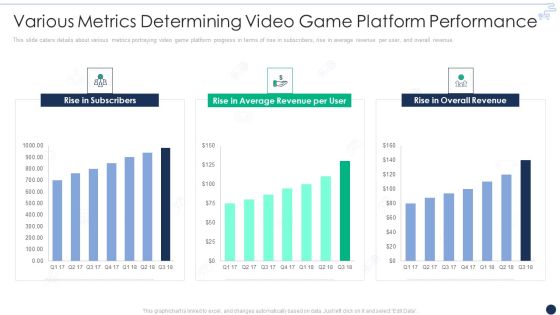
Online Gaming Funding Pitch Deck Various Metrics Determining Video Game Platform Performance Brochure PDF
This slide caters details about various metrics portraying video game platform progress in terms of rise in subscribers, rise in average revenue per user, and overall revenue. Deliver an awe inspiring pitch with this creative online gaming funding pitch deck various metrics determining video game platform performance brochure pdf bundle. Topics like rise in subscribers, rise in average revenue per user, rise in overall revenue can be discussed with this completely editable template. It is available for immediate download depending on the needs and requirements of the user.

Virtual Adventure Gaming Investor Elevator Pitch Deck Various Metrics Determining Video Professional PDF
This slide caters details about various metrics portraying video game platform progress in terms of rise in subscribers, rise in average revenue per user, and overall revenue. Deliver an awe inspiring pitch with this creative virtual adventure gaming investor elevator pitch deck various metrics determining video professional pdf bundle. Topics like rise in subscribers, rise in average revenue per user, rise in overall revenue can be discussed with this completely editable template. It is available for immediate download depending on the needs and requirements of the user.

Computerized Game Pitch Deck Various Metrics Determining Video Game Platform Performance Information PDF
This slide caters details about various metrics portraying video game platform progress in terms of rise in subscribers, rise in average revenue per user, and overall revenue. Deliver an awe inspiring pitch with this creative computerized game pitch deck various metrics determining video game platform performance information pdf bundle. Topics like rise in subscribers, rise in average revenue per user, rise in overall revenue can be discussed with this completely editable template. It is available for immediate download depending on the needs and requirements of the user.

Online Gaming Fundraising Pitch Deck Various Metrics Determining Video Game Platform Performance Structure PDF
This slide caters details about various metrics portraying video game platform progress in terms of rise in subscribers, rise in average revenue per user, and overall revenue. Deliver an awe inspiring pitch with this creative online gaming fundraising pitch deck various metrics determining video game platform performance structure pdf bundle. Topics like rise in subscribers, rise in average revenue per user, rise in overall revenue can be discussed with this completely editable template. It is available for immediate download depending on the needs and requirements of the user.

Multiplayer Gameplay System Venture Capitalist PPT Various Metrics Determining Video Game Platform Performance Infographics PDF
This slide caters details about various metrics portraying video game platform progress in terms of rise in subscribers, rise in average revenue per user, and overall revenue.Deliver an awe inspiring pitch with this creative multiplayer gameplay system venture capitalist ppt various metrics determining video game platform performance infographics pdf bundle. Topics like rise in subscribers, rise in average revenue, rise in overall revenue can be discussed with this completely editable template. It is available for immediate download depending on the needs and requirements of the user.

Best Techniques To Enhance New Product Management Efficiency Metrics To Measure Company Professional PDF
This slide shows the metrics to measure company revenues and customers that covers actual revenues with target revenues, average revenue per customer, customer acquisition cost and lifetime value, etc. Deliver and pitch your topic in the best possible manner with this best techniques to enhance new product management efficiency metrics to measure company professional pdf. Use them to share invaluable insights on measuring affect of development strategy on product metrics and impress your audience. This template can be altered and modified as per your expectations. So, grab it now.
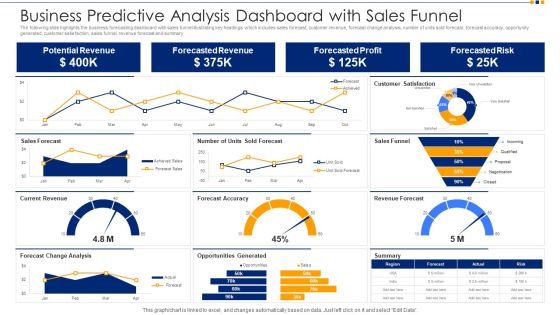
Business Predictive Analysis Dashboard With Sales Funnel Ppt Show Images PDF
The following slide highlights the business forecasting dashboard with sales funnel illustrating key headings which includes sales forecast, customer revenue, forecast change analysis, number of units sold forecast, forecast accuracy, opportunity generated, customer satisfaction, sales funnel, revenue forecast and summary. Pitch your topic with ease and precision using this business predictive analysis dashboard with sales funnel ppt show images pdf. This layout presents information on potential revenue, forecasted revenue, forecasted profit, forecasted risk. It is also available for immediate download and adjustment. So, changes can be made in the color, design, graphics or any other component to create a unique layout.
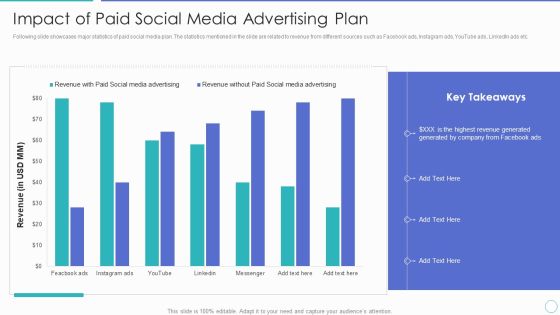
Impact Of Paid Social Media Advertising Plan Ppt PowerPoint Presentation Gallery Template PDF
Following slide showcases major statistics of paid social media plan. The statistics mentioned in the slide are related to revenue from different sources such as Facebook ads, Instagram ads, YouTube ads, LinkedIn ads etc. Pitch your topic with ease and precision using this impact of paid social media advertising plan ppt powerpoint presentation gallery template pdf. This layout presents information on highest revenue generated, revenue with paid social media advertising, revenue without paid social media advertising. It is also available for immediate download and adjustment. So, changes can be made in the color, design, graphics or any other component to create a unique layout.

Sales Data Requirements For Analytics For Business Growth Information PDF
This slide provides information about sales data requirement analysis for business growth which contains different KPIs such as total revenue, revenue by product, percentage of revenue from existing customers and new business. Pitch your topic with ease and precision using this sales data requirements for analytics for business growth information pdf. This layout presents information on customers, revenue, business. It is also available for immediate download and adjustment. So, changes can be made in the color, design, graphics or any other component to create a unique layout.

E Commerce Project Campaign Planning And Management Dashboard Structure PDF
The following slide highlights the ecommerce project campaign planning and management dashboard illustrating key headings which includes revenue, onsite behaviour, mobile revenue and average order value, revenue by channel, top performing campaigns, high bounce mobile devices and mobile vs site revenue Showcasing this set of slides titled E Commerce Project Campaign Planning And Management Dashboard Structure PDF. The topics addressed in these templates are E Commerce Project Campaign Planning And Management Dashboard. All the content presented in this PPT design is completely editable. Download it and make adjustments in color, background, font etc. as per your unique business setting.

Business To Business Account B2B Sales Representatives Performance Tracking Dashboard Demonstration PDF
This slide provides information regarding B2B sales representatives performance tracking dashboard to measure leads by region, revenue breakdown, top performers by leads, revenues, etc. Deliver and pitch your topic in the best possible manner with this Business To Business Account B2B Sales Representatives Performance Tracking Dashboard Demonstration PDF. Use them to share invaluable insights on Top 5 Sales Reps By Revenue Pace, Top 5 Sales Reps By Revenue, Top 5 Sales Reps By Leads and impress your audience. This template can be altered and modified as per your expectations. So, grab it now.
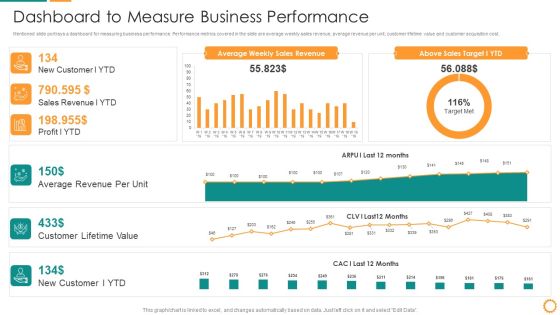
IT Consolidation Post Mergers And Acquisition Dashboard To Measure Business Performance Clipart PDF
Mentioned slide portrays a dashboard for measuring business performance. Performance metrics covered in the slide are average weekly sales revenue, average revenue per unit, customer lifetime value and customer acquisition cost. Deliver and pitch your topic in the best possible manner with this IT Consolidation Post Mergers And Acquisition Dashboard To Measure Business Performance Clipart PDF. Use them to share invaluable insights on Average Revenue, Customer Lifetime Value, Sales Revenue, Sales Target and impress your audience. This template can be altered and modified as per your expectations. So, grab it now.

Restaurant Promotion Marketing Analysis Dashboard For Hospitality Company Microsoft PDF
This slide shows the dashboard to be used by the hospitality company for analyzing the restaurant marketing. It includes details related to revenue, cost of revenue, net income, food and beverage revenue by location and type etc.Showcasing this set of slides titled Restaurant Promotion Marketing Analysis Dashboard For Hospitality Company Microsoft PDF The topics addressed in these templates are Beverage Revenue, Food Beverage, Expenses Account All the content presented in this PPT design is completely editable. Download it and make adjustments in color, background, font etc. as per your unique business setting.
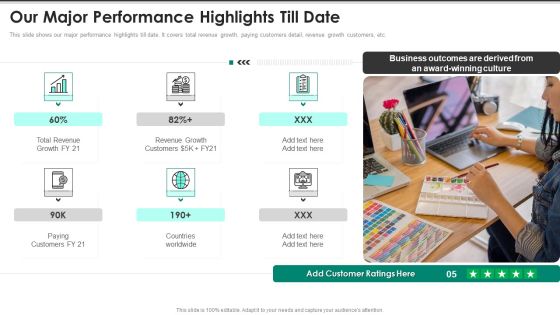
Website Interface And Application Development Firm Our Major Performance Highlights Inspiration PDF
This slide shows our major performance highlights till date. It covers total revenue growth, paying customers detail, revenue growth customers, etc. Presenting Website Interface And Application Development Firm Our Major Performance Highlights Inspiration PDF to provide visual cues and insights. Share and navigate important information on six stages that need your due attention. This template can be used to pitch topics like Total Revenue Growth, Revenue Growth Customers, Paying Customers Countries. In addtion, this PPT design contains high resolution images, graphics, etc, that are easily editable and available for immediate download.

Strategies To Implement B2b Income Generation Strategy Guidelines PDF
This slide covers techniques to implement new B2B revenue model. It includes change existing revenue model, sell upside, concept testing, multi revenue models and provide adequate resources. Persuade your audience using this Strategies To Implement B2b Income Generation Strategy Guidelines PDF. This PPT design covers five stages, thus making it a great tool to use. It also caters to a variety of topics including Change Existing Revenue Model, Adequate Resources, Concept Testing. Download this PPT design now to present a convincing pitch that not only emphasizes the topic but also showcases your presentation skills.

Automobile Company Actual And Forecasted Monthly Sales Dashboard Ppt Infographic Template Aids PDF
This slide shows the dashboard for forecasting the sales of an automobile company for the current month. It represents details related to revenue by pipeline, new deals, sales forecast, revenue goal attainment by owner for the current month and pipeline coverage by next month. Showcasing this set of slides titled Automobile Company Actual And Forecasted Monthly Sales Dashboard Ppt Infographic Template Aids PDF. The topics addressed in these templates are Forecast Month, Revenue Goal Attainment, Revenue Goal Attainment. All the content presented in this PPT design is completely editable. Download it and make adjustments in color, background, font etc. as per your unique business setting.

Business Newsletter Referral Marketing Program Performance KPI Dashboard Formats PDF
This slide represents KPI dashboard designed to track performance of the program conducted to attract new leads at lower cost with the help of existing customers to generate leads that best fit the organization. It includes key metrics such as total revenue generated, monthly recurring revenue, paying customers etc. Showcasing this set of slides titled Business Newsletter Referral Marketing Program Performance KPI Dashboard Formats PDF. The topics addressed in these templates are Dashboard, Paying Customers, Monthly Recurring Revenue, Total Revenue Generated. All the content presented in this PPT design is completely editable. Download it and make adjustments in color, background, font etc. as per your unique business setting.

Monthly Profit And Loss Statement Reports Of A Hospital Background PDF
This slide contains month wise profit and loss statement of a hospital. The major elements included herein are operational revenue, total revenue, expenditure, total expenses, and surplus deficit.Showcasing this set of slides titled Monthly Profit And Loss Statement Reports Of A Hospital Background PDF. The topics addressed in these templates are Operational Revenue, Operational Revenue, Water Sanitation. All the content presented in this PPT design is completely editable. Download it and make adjustments in color, background, font etc. as per your unique business setting.

Music Streaming Application Freemium Business Pricing Model Microsoft PDF
This slide covers freemium revenue model of music streaming application. It includes block diagram of revenue generation from multiple platforms such displaying ads to free users, fees from premium users, ad revenues, etc. Pitch your topic with ease and precision using this Music Streaming Application Freemium Business Pricing Model Microsoft PDF. This layout presents information on Revenue Advertisements, Royalty Fees, Listening Experience. It is also available for immediate download and adjustment. So, changes can be made in the color, design, graphics or any other component to create a unique layout.
Executive Dashboards For Tracking Key Performance Icons PDF
This slide represents the dashboard for the CEO to track the companys performance. It includes key performance indicators such as no. of deals, open deals, revenue, expected revenue and win percentage. Showcasing this set of slides titled Executive Dashboards For Tracking Key Performance Icons PDF. The topics addressed in these templates are Pen Deals, Revenue, Expected Revenue. All the content presented in this PPT design is completely editable. Download it and make adjustments in color, background, font etc. as per your unique business setting.

Dashboard For Tracking Sales Target Metrics Introduction PDF
This slide presents KPI dashboard for tracking Sales Target Metrics achievement monthly and region wise helpful in adjusting activities as per ongoing performance. It includes average weekly sales revenue, average sales target, annual sales growth, regional sales performance and average revenue per unit that should be regularly tracked. Showcasing this set of slides titled Dashboard For Tracking Sales Target Metrics Introduction PDF. The topics addressed in these templates are Average Revenue, Per Unit, Average Weekly, Sales Revenue. All the content presented in this PPT design is completely editable. Download it and make adjustments in color, background, font etc. as per your unique business setting.

Actual Vs Budgeted Earning Breakup Dashboard Inspiration PDF
This style showcases revenue breakdown dashboard that can help organization to compare the actual vs budgeted amount and calculate the variance in target achievements. Its key components are product revenue, services revenue and total revenues. Showcasing this set of slides titled Actual Vs Budgeted Earning Breakup Dashboard Inspiration PDF. The topics addressed in these templates are Actual Vs Budgeted, Earning Breakup Dashboard. All the content presented in this PPT design is completely editable. Download it and make adjustments in color, background, font etc. as per your unique business setting.
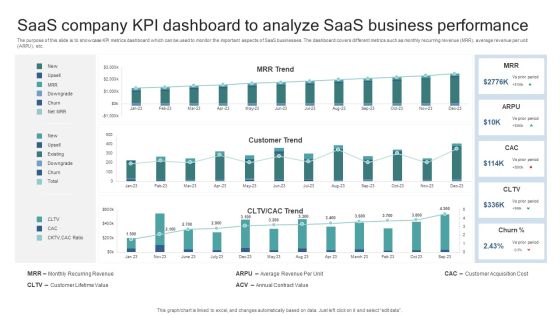
Saas Company KPI Dashboard To Analyze Saas Business Performance Elements PDF
The purpose of this slide is to showcase KPI metrics dashboard which can be used to monitor the important aspects of SaaS businesses. The dashboard covers different metrics such as monthly recurring revenue MRR, average revenue per unit ARPU, etc. Pitch your topic with ease and precision using this Saas Company KPI Dashboard To Analyze Saas Business Performance Elements PDF. This layout presents information on Monthly Recurring Revenue, Customer Lifetime Value, Average Revenue Per Unit, Annual Contract Value, Customer Acquisition Cost. It is also available for immediate download and adjustment. So, changes can be made in the color, design, graphics or any other component to create a unique layout.

Company Payout Dashboard For Subscription Based Startup Designs PDF
The slide carries different metrics to evaluate and record payments of subscription-based business start-up. Various KPIs included are net revenue, MRR, customers, current day revenue, failed and successful payments, live feed- subscription and payments. Pitch your topic with ease and precision using this Company Payout Dashboard For Subscription Based Startup Designs PDF. This layout presents information on Net Revenue, MRR, Customers, Current Day Revenue. It is also available for immediate download and adjustment. So, changes can be made in the color, design, graphics or any other component to create a unique layout.
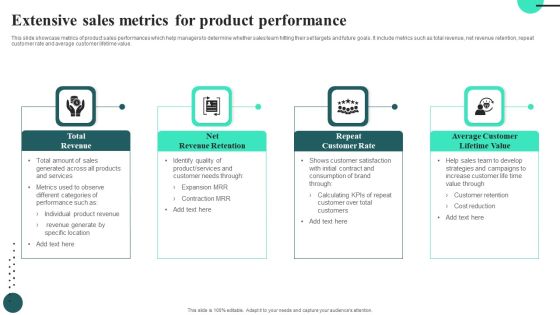
Extensive Sales Metrics For Product Performance Summary PDF
This slide showcase metrics of product sales performances which help managers to determine whether sales team hitting their set targets and future goals. It include metrics such as total revenue, net revenue retention, repeat customer rate and average customer lifetime value.Persuade your audience using this Extensive Sales Metrics For Product Performance Summary PDF. This PPT design covers four stages, thus making it a great tool to use. It also caters to a variety of topics including Total Revenue, Net Revenue Retention. Download this PPT design now to present a convincing pitch that not only emphasizes the topic but also showcases your presentation skills.
KPI Dashboard To Track Services Company Strategy Business Marketing Performance Guidelines PDF
Following slide demonstrates dashboard for monitoring services company sales strategy impact on maximizing business profits. It includes elements such as number of sales, revenue, profit, cost, monthly sales revenue, cost breakdown, up and cross sell, revenue collected and sales by communication channel. Showcasing this set of slides titled KPI Dashboard To Track Services Company Strategy Business Marketing Performance Guidelines PDF. The topics addressed in these templates are Revenue, Profit, Cost. All the content presented in this PPT design is completely editable. Download it and make adjustments in color, background, font etc. as per your unique business setting.
 Home
Home