Financial
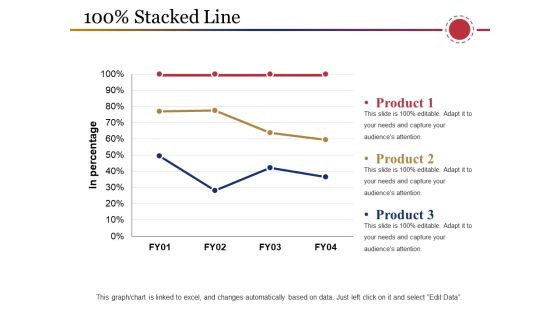
Stacked Line Ppt PowerPoint Presentation Portfolio Layout
This is a stacked line ppt powerpoint presentation portfolio layout. This is a three stage process. The stages in this process are product, percentage, business, marketing, finance.

Demand Forecasting Ppt PowerPoint Presentation Outline Model
This is a demand forecasting ppt powerpoint presentation outline model. This is a one stage process. The stages in this process are demand quality, dynamic demand, stable demand, trend, finance.
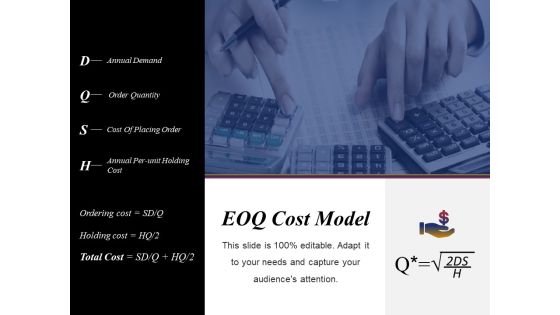
Eoq Cost Model Ppt PowerPoint Presentation Infographics Graphics Pictures
This is a eoq cost model ppt powerpoint presentation infographics graphics pictures. This is a one stage process. The stages in this process are business, marketing, finance, management.
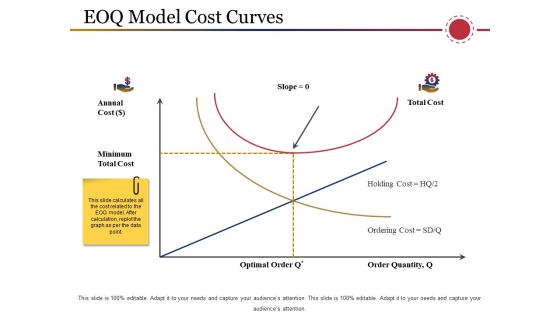
Eoq Model Cost Curves Ppt PowerPoint Presentation Infographics Background Image
This is a eoq model cost curves ppt powerpoint presentation infographics background image. This is a four stage process. The stages in this process are annual cost , minimum, optimal order , order quantity, business, finance.
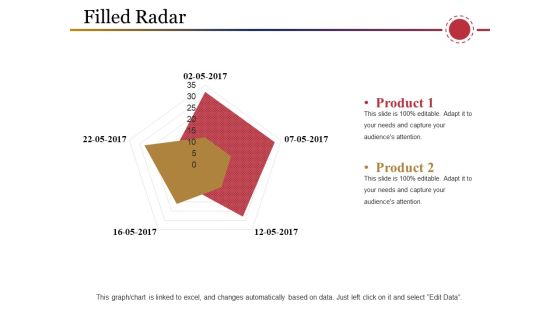
Filled Radar Ppt PowerPoint Presentation model Brochure
This is a filled radar ppt powerpoint presentation model brochure. This is a two stage process. The stages in this process are product, business, marketing, finance, filled radar.
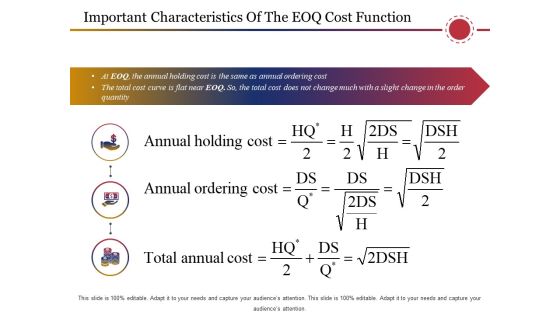
Important Characteristics Of The Eoq Cost Function Ppt PowerPoint Presentation Infographic Template Maker
This is a important characteristics of the eoq cost function ppt powerpoint presentation infographic template maker. This is a three stage process. The stages in this process are icons, business, marketing, finance.
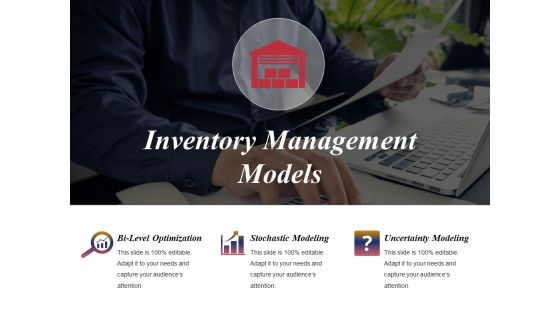
Inventory Management Models Ppt PowerPoint Presentation Background Image
This is a inventory management models ppt powerpoint presentation background image. This is a three stage process. The stages in this process are bi level optimization, stochastic modeling, uncertainty modeling, business, marketing.

Logistics And It Ppt PowerPoint Presentation Show Vector
This is a logistics and it ppt powerpoint presentation show vector. This is a three stage process. The stages in this process are transportation medium, transportation challenges, finance, business, marketing.

Sales Forecasting Template 2 Ppt PowerPoint Presentation Diagram Ppt
This is a sales forecasting template 2 ppt powerpoint presentation diagram ppt. This is a tweleve stage process. The stages in this process are finance, marketing, graph, business.

Demand Forecasting Ppt PowerPoint Presentation Examples
This is a demand forecasting ppt powerpoint presentation examples. This is a one stage process. The stages in this process are demand quality, months, finance, business, marketing.
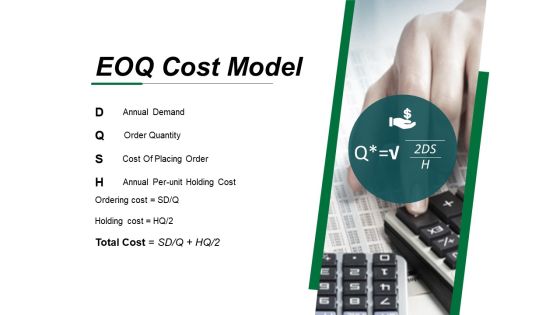
Eoq Cost Model Ppt PowerPoint Presentation Inspiration Picture
This is a eoq cost model ppt powerpoint presentation inspiration picture. This is a one stage process. The stages in this process are business, marketing, finance, model, icons.
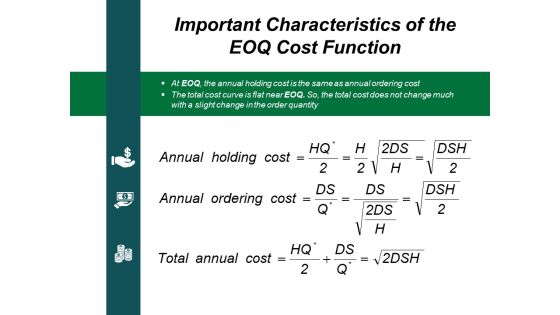
Important Characteristics Of The Eoq Cost Function Ppt PowerPoint Presentation Gallery Slide Download
This is a important characteristics of the eoq cost function ppt powerpoint presentation gallery slide download. This is a three stage process. The stages in this process are icons, business, marketing, finance, strategy.
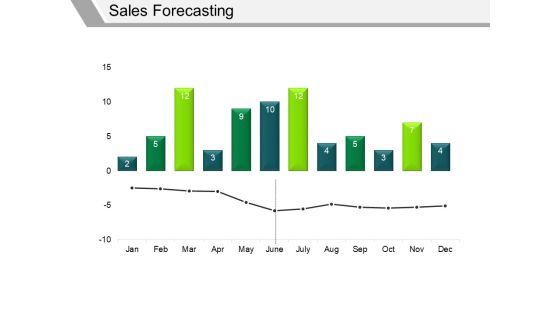
Sales Forecasting Template 2 Ppt PowerPoint Presentation File Graphics
This is a sales forecasting template 2 ppt powerpoint presentation file graphics. This is a two stage process. The stages in this process are finance, marketing, graph, business.
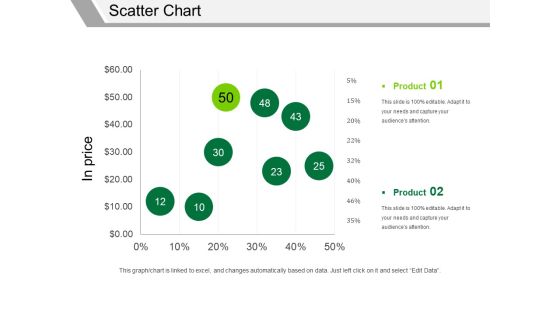
Scatter Chart Ppt PowerPoint Presentation Pictures Elements
This is a scatter chart ppt powerpoint presentation pictures elements. This is a two stage process. The stages in this process are in price, product, finance, business, marketing.

Stacked Column Ppt PowerPoint Presentation Infographics Samples
This is a stacked column ppt powerpoint presentation infographics samples. This is a two stage process. The stages in this process are product, sales in percentage, business, marketing, graph.
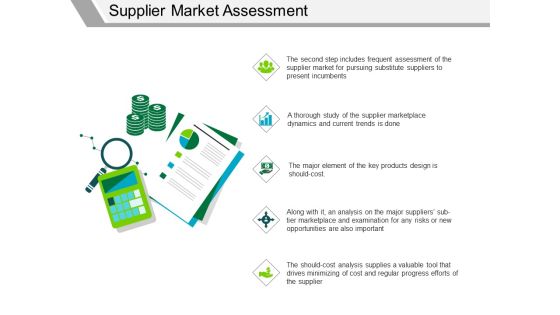
Supplier Market Assessment Ppt PowerPoint Presentation Visual Aids Slides
This is a supplier market assessment ppt powerpoint presentation visual aids slides. This is a five stage process. The stages in this process are finance, marketing, icons, business, strategy.
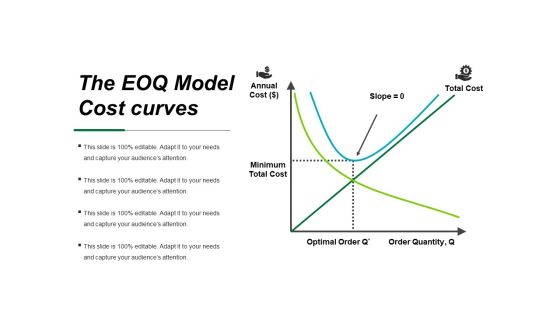
The Eoq Model Cost Curves Ppt PowerPoint Presentation Layouts Portfolio
This is a the eoq model cost curves ppt powerpoint presentation layouts portfolio. This is a two stage process. The stages in this process are minimum, annual, lope, total cost, order, optimal.

Donut Pie Chart Ppt PowerPoint Presentation Show Topics
This is a donut pie chart ppt powerpoint presentation show topics. This is a three stage process. The stages in this process are percentage, finance, donut, business.
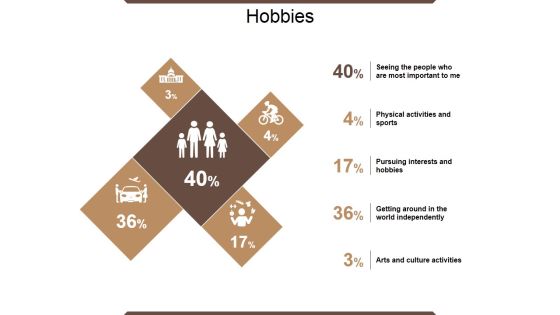
Hobbies Ppt PowerPoint Presentation Styles Designs
This is a hobbies ppt powerpoint presentation styles designs. This is a five stage process. The stages in this process are percentage, finance, icons, strategy, business.
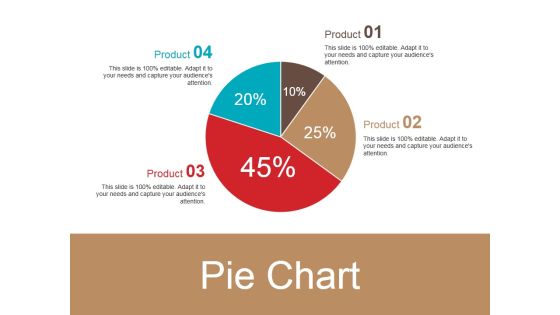
Pie Chart Ppt PowerPoint Presentation Ideas Slideshow
This is a pie chart ppt powerpoint presentation ideas slideshow. This is a four stage process. The stages in this process are pie, process, percentage, finance, business.

Stock Chart Ppt PowerPoint Presentation Outline Graphics Example
This is a stock chart ppt powerpoint presentation outline graphics example. This is a five stage process. The stages in this process are close, volume, low, high, open, product.

Clustered Column Ppt PowerPoint Presentation Outline Visuals
This is a clustered column ppt powerpoint presentation outline visuals. This is a two stage process. The stages in this process are profit, business, product, marketing, graph.

Line Chart Ppt PowerPoint Presentation Portfolio Shapes
This is a line chart ppt powerpoint presentation portfolio shapes. This is a two stage process. The stages in this process are profit, product, business, marketing, graph.

Bar Chart Ppt PowerPoint Presentation Pictures Inspiration
This is a bar chart ppt powerpoint presentation pictures inspiration. This is a seven stage process. The stages in this process are in percentage, business, marketing, finance, graph.

Eoq Cost Model Ppt PowerPoint Presentation Layouts Styles
This is a eoq cost model ppt powerpoint presentation layouts styles. This is a one stage process. The stages in this process are icons, business, marketing, finance.
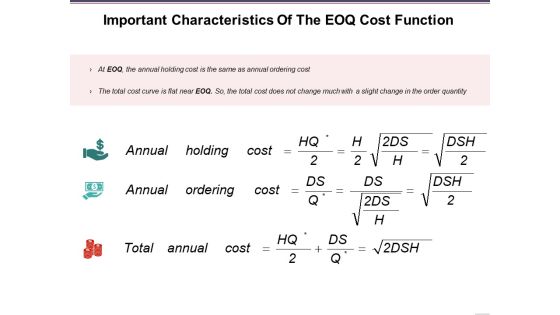
Important Characteristics Of The Eoq Cost Function Ppt PowerPoint Presentation Show Slides
This is a important characteristics of the eoq cost function ppt powerpoint presentation show slides. This is a three stage process. The stages in this process are icons, business, marketing, finance, strategy.

Inventory Management Models Ppt PowerPoint Presentation File Format
This is a inventory management models ppt powerpoint presentation file format. This is a three stage process. The stages in this process are bi level optimization, stochastic modeling, uncertainty modeling, finance, marketing.

Sales Forecasting Template 2 Ppt PowerPoint Presentation Infographic Template Examples
This is a sales forecasting template 2 ppt powerpoint presentation infographic template examples. This is a two stage process. The stages in this process are forecasting, business, marketing, finance, graph.
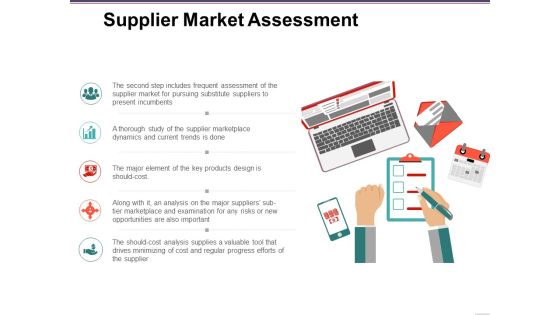
Supplier Market Assessment Ppt PowerPoint Presentation Pictures Portfolio
This is a supplier market assessment ppt powerpoint presentation pictures portfolio. This is a five stage process. The stages in this process are business, marketing, finance, icons, strategy.

Scatter With Smooth Lines And Markers Ppt PowerPoint Presentation Visual Aids Ideas
This is a scatter with smooth lines and markers ppt powerpoint presentation visual aids ideas. This is a nine stage process. The stages in this process are product, profit, dollar, business, finance.

Area Chart Ppt PowerPoint Presentation Model Example Topics
This is a area chart ppt powerpoint presentation model example topics. This is a two stage process. The stages in this process are product, percentage, business, marketing, finance.

Bar Chart Ppt PowerPoint Presentation Show Example File
This is a bar chart ppt powerpoint presentation show example file. This is a two stage process. The stages in this process are product, business, marketing, graph, percentage.

Clustered Bar Ppt PowerPoint Presentation Outline Model
This is a clustered bar ppt powerpoint presentation outline model. This is a five stage process. The stages in this process are years, business, marketing, graph, finance.

Column Chart Ppt PowerPoint Presentation Inspiration Deck
This is a column chart ppt powerpoint presentation inspiration deck. This is a two stage process. The stages in this process are years, business, marketing, graph, finance, product.

Combo Chart Ppt PowerPoint Presentation Ideas Portrait
This is a combo chart ppt powerpoint presentation ideas portrait. This is a three stage process. The stages in this process are product, business, finance, growth.
Experience Projects Ppt PowerPoint Presentation Slides Rules
This is a experience projects ppt powerpoint presentation slides rules. This is a four stage process. The stages in this process are project, business, marketing, finance.
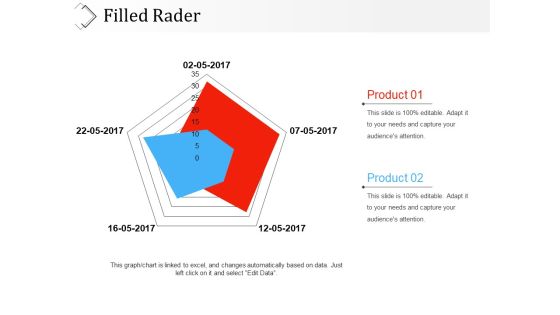
Filled Rader Ppt PowerPoint Presentation Summary Themes
This is a filled rader ppt powerpoint presentation summary themes. This is a two stage process. The stages in this process are product, business, marketing, finance.
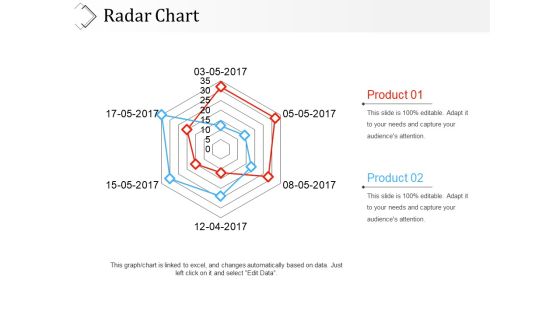
Radar Chart Ppt PowerPoint Presentation File Graphic Tips
This is a radar chart ppt powerpoint presentation file graphic tips. This is a two stage process. The stages in this process are product, finance, marketing, business.

Scatter Bubble Chart Ppt PowerPoint Presentation Infographic Template Examples
This is a scatter bubble chart ppt powerpoint presentation infographic template examples. This is a two stage process. The stages in this process are highest sale, product, in price, finance, business.
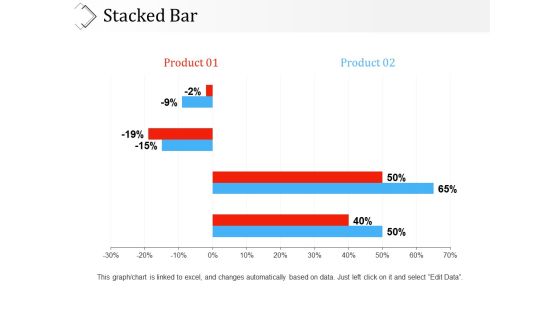
Stacked Bar Ppt PowerPoint Presentation Infographic Template Clipart
This is a stacked bar ppt powerpoint presentation infographic template clipart. This is a two stage process. The stages in this process are product, percentage, business, marketing, graph.
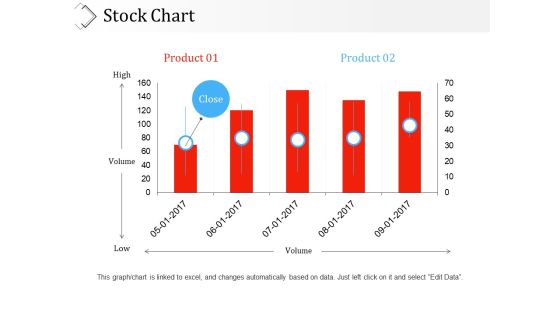
Stock Chart Ppt PowerPoint Presentation Ideas Sample
This is a stock chart ppt powerpoint presentation ideas sample. This is a five stage process. The stages in this process are product, high, low, volume, business.

Brand Mentions Ppt PowerPoint Presentation Model Objects
This is a brand mentions ppt powerpoint presentation model objects. This is a six stage process. The stages in this process are business, finance, marketing, strategy, analysis.

Competitor Analysis Graph Ppt PowerPoint Presentation Slides Elements
This is a competitor analysis graph ppt powerpoint presentation slides elements. This is a five stage process. The stages in this process are bar graph, finance, marketing, strategy, business.
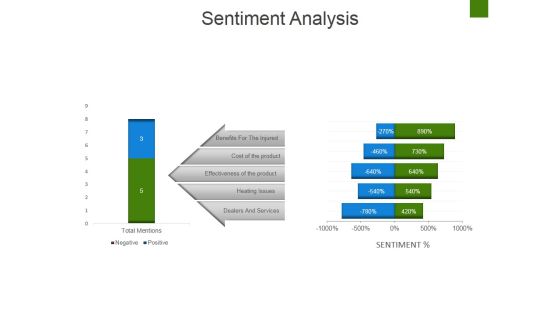
Sentiment Analysis Ppt PowerPoint Presentation Diagram Ppt
This is a sentiment analysis ppt powerpoint presentation diagram ppt. This is a two stage process. The stages in this process are benefits for the injured, cost of the product, effectiveness of the product, heating issues, dealers and services.

Area Chart Ppt PowerPoint Presentation Summary Objects
This is a area chart ppt powerpoint presentation summary objects. This is a two stage process. The stages in this process are product, sales in percentage, finance, business, marketing.

Bar Graph Template 2 Ppt PowerPoint Presentation Ideas Files
This is a bar graph template 2 ppt powerpoint presentation ideas files. This is a five stage process. The stages in this process are in percentage, business, marketing, finance, graph.

High Low Close Chart Ppt PowerPoint Presentation Portfolio Gridlines
This is a high low close chart ppt powerpoint presentation portfolio gridlines. This is a one stage process. The stages in this process are high, product, volume, low.
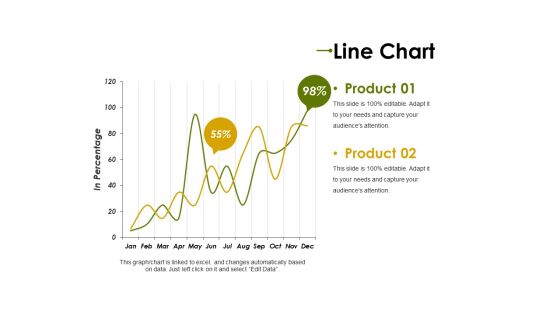
Line Chart Ppt PowerPoint Presentation Professional Clipart Images
This is a line chart ppt powerpoint presentation professional clipart images. This is a two stage process. The stages in this process are product, in percentage, graph, percentage, finance, business.

Radar Chart Ppt PowerPoint Presentation Styles Guide
This is a radar chart ppt powerpoint presentation styles guide. This is a two stage process. The stages in this process are product, graph, business, marketing, finance.
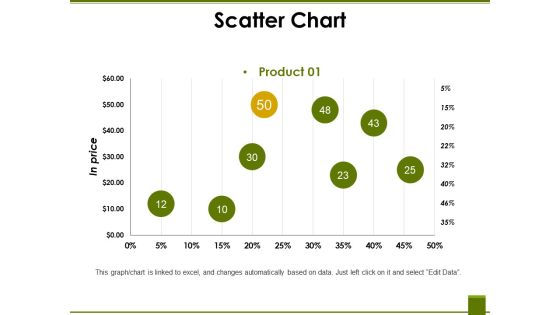
Scatter Chart Ppt PowerPoint Presentation File Display
This is a scatter chart ppt powerpoint presentation file display. This is a eight stage process. The stages in this process are product, business, marketing, finance, in price.

Stacked Bar Ppt PowerPoint Presentation Summary Infographics
This is a stacked bar ppt powerpoint presentation summary infographics. This is a four stage process. The stages in this process are product, unit count, business, marketing, graph.
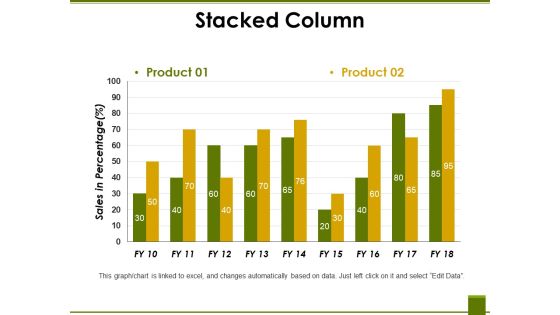
Stacked Column Ppt PowerPoint Presentation Professional Vector
This is a stacked column ppt powerpoint presentation professional vector. This is a two stage process. The stages in this process are product, sales in percentage, business, marketing, graph.

Stacked Line Ppt PowerPoint Presentation Infographic Template Graphics Template
This is a stacked line ppt powerpoint presentation infographic template graphics template. This is a three stage process. The stages in this process are product, in percentage, business, marketing, finance.
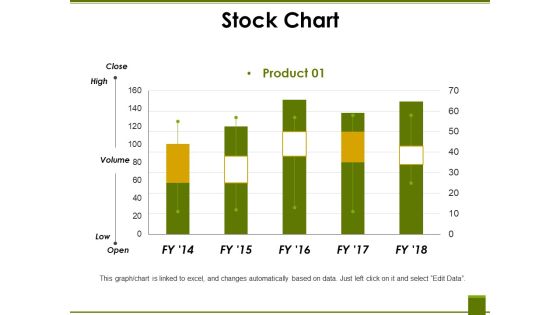
Stock Chart Ppt PowerPoint Presentation Summary Pictures
This is a stock chart ppt powerpoint presentation summary pictures. This is a five stage process. The stages in this process are high, volume, low, product, graph.

Bar Chart Ppt PowerPoint Presentation Layouts Pictures
This is a bar chart ppt powerpoint presentation layouts pictures. This is a three stage process. The stages in this process are bar graph, product, sales in percentage, business, marketing.

Bar Graph Ppt PowerPoint Presentation Gallery Grid
This is a bar graph ppt powerpoint presentation gallery grid. This is a three stage process. The stages in this process are sales in percentage, product, finance, business, marketing.
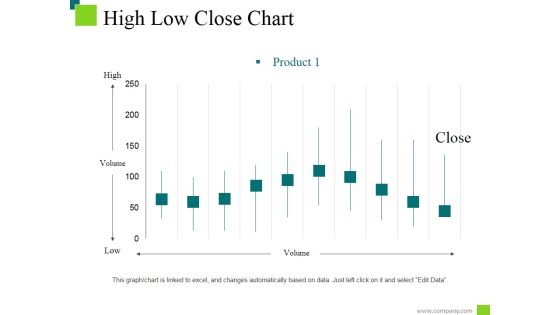
High Low Close Chart Ppt PowerPoint Presentation Styles Information
This is a high low close chart ppt powerpoint presentation styles information. This is a ten stage process. The stages in this process are low, high, product, volume, close.

Market Segmentation Evaluation Segment Size And Growth Potential Ppt PowerPoint Presentation Model
This is a market segmentation evaluation segment size and growth potential ppt powerpoint presentation model. This is a two stage process. The stages in this process are net profit, market sales, milk products, confectionary.
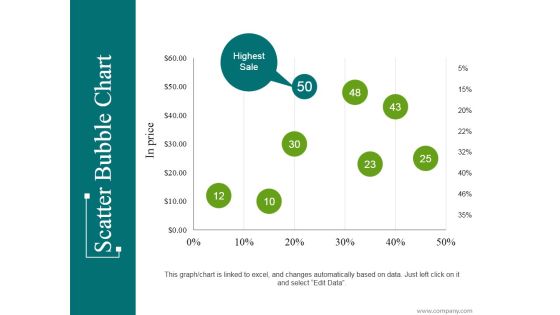
Scatter Bubble Chart Ppt PowerPoint Presentation Infographic Template Introduction
This is a scatter bubble chart ppt powerpoint presentation infographic template introduction. This is a eight stage process. The stages in this process are highest sale, business, marketing, percentage, finance.
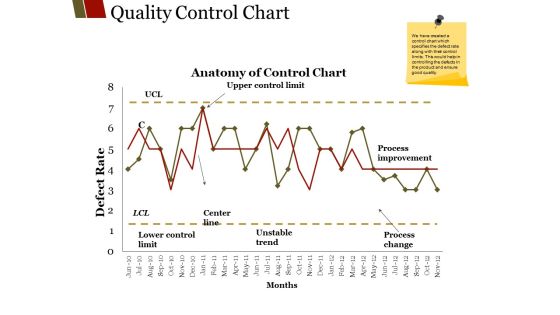
Quality Control Chart Ppt PowerPoint Presentation File Graphics Design
This is a quality control chart ppt powerpoint presentation file graphics design. This is a two stage process. The stages in this process are unstable trend, months center line, lower control limit, process improvement.
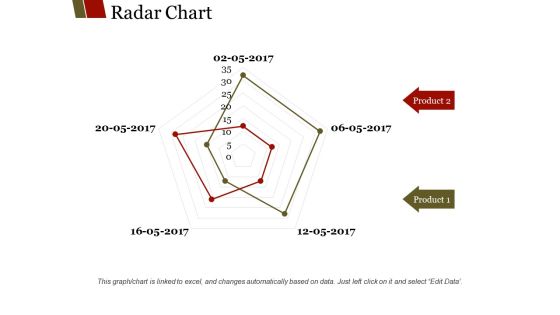
Radar Chart Ppt PowerPoint Presentation Summary Slide Portrait
This is a radar chart ppt powerpoint presentation summary slide portrait. This is a two stage process. The stages in this process are product, business, marketing, finance.
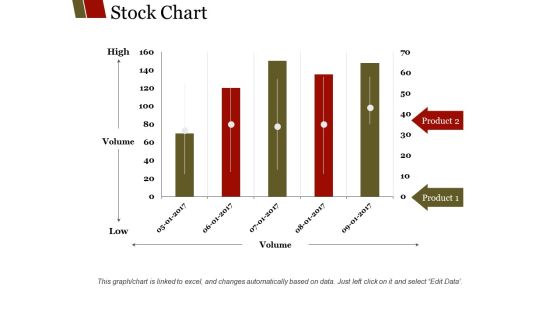
Stock Chart Ppt PowerPoint Presentation Outline Slideshow
This is a stock chart ppt powerpoint presentation outline slideshow. This is a five stage process. The stages in this process are high, volume, low, product, finance.

Area Chart Ppt PowerPoint Presentation Show Templates
This is a area chart ppt powerpoint presentation show templates. This is a two stage process. The stages in this process are product, in percentage, in years, finance, graph.

Bar Chart Ppt PowerPoint Presentation Outline Guidelines
This is a bar chart ppt powerpoint presentation outline guidelines. This is a four stage process. The stages in this process are product, unit count, in years, graph, finance, business.
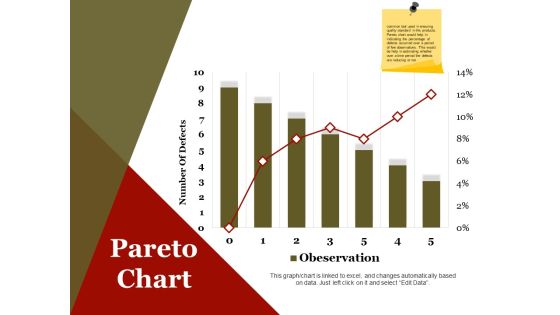
Pareto Chart Ppt PowerPoint Presentation Infographics Design Inspiration
This is a pareto chart ppt powerpoint presentation infographics design inspiration. This is a seven stage process. The stages in this process are number of defects, business, marketing, finance.
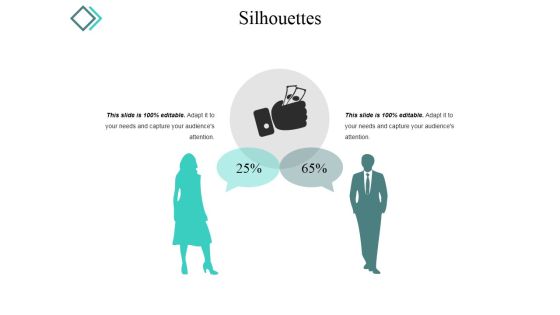
Silhouettes Ppt PowerPoint Presentation Styles Display
This is a silhouettes ppt powerpoint presentation styles display. This is a two stage process. The stages in this process are silhouette, people, communication, business, marketing.

4 Quarter Track Record Template Ppt PowerPoint Presentation Model Graphics Download
This is a 4 quarter track record template ppt powerpoint presentation model graphics download. This is a four stage process. The stages in this process are business, marketing, strategy, planning, finance.

Comparison Ppt PowerPoint Presentation Diagram Lists
This is a comparison ppt powerpoint presentation diagram lists. This is a two stage process. The stages in this process are business, marketing, strategy, finance, planning.

Competitive Analysis Ppt PowerPoint Presentation Summary Model
This is a competitive analysis ppt powerpoint presentation summary model. This is a six stage process. The stages in this process are business, marketing, strategy, bar, finance.

Current Quarter Portfolio Ppt PowerPoint Presentation Summary Ideas
This is a current quarter portfolio ppt powerpoint presentation summary ideas. This is a two stage process. The stages in this process are business, marketing, bar, finance, strategy.
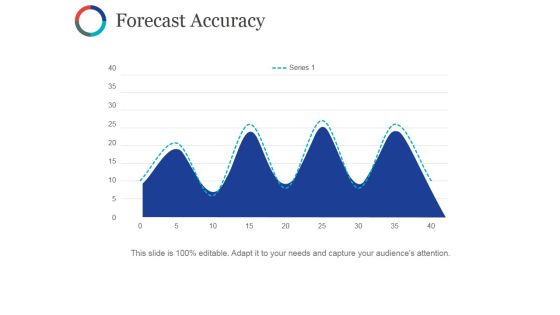
Forecast Accuracy Template Ppt PowerPoint Presentation Styles Format Ideas
This is a forecast accuracy template ppt powerpoint presentation styles format ideas. This is a four stage process. The stages in this process are business, marketing, strategy, graph, planning.

Forecast Accuracy Ppt PowerPoint Presentation Professional Graphics Template
This is a forecast accuracy ppt powerpoint presentation professional graphics template. This is a four stage process. The stages in this process are business, marketing, strategy, graph, planning.

Partner Score Card Ppt PowerPoint Presentation Summary Guide
This is a partner score card ppt powerpoint presentation summary guide. This is a seven stage process. The stages in this process are opportunity, business, marketing, strategy, finance.

Pipeline Quality Ppt PowerPoint Presentation Portfolio Diagrams
This is a pipeline quality ppt powerpoint presentation portfolio diagrams. This is a five stage process. The stages in this process are business, marketing, finance, graph, plan.
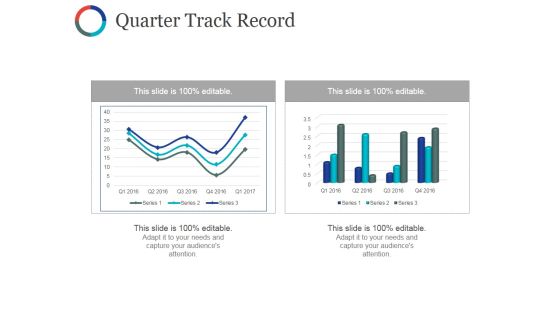
Quarter Track Record Ppt PowerPoint Presentation Professional Layout Ideas
This is a quarter track record ppt powerpoint presentation professional layout ideas. This is a two stage process. The stages in this process are business, marketing, finance, graph, plan.

Dashboard Ppt PowerPoint Presentation Icon Model
This is a dashboard ppt powerpoint presentation icon model. This is a four stage process. The stages in this process are percentage, finance, business, donut.
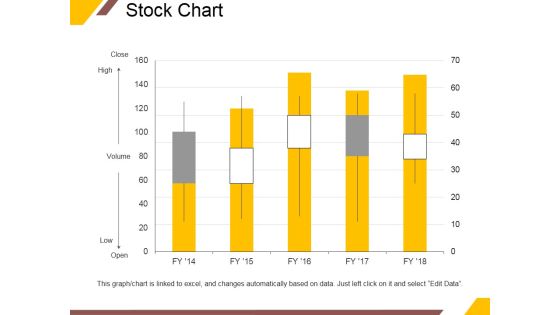
Stock Chart Ppt PowerPoint Presentation Professional Pictures
This is a stock chart ppt powerpoint presentation professional pictures. This is a five stage process. The stages in this process are close, high, volume, low, open.
Scatter Bubble Chart Ppt PowerPoint Presentation Gallery Icons
This is a scatter bubble chart ppt powerpoint presentation gallery icons. This is a three stage process. The stages in this process are product, finance, business, marketing.
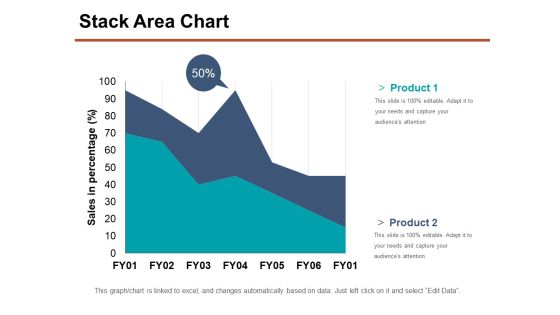
Stack Area Chart Ppt PowerPoint Presentation Show Samples
This is a stack area chart ppt powerpoint presentation show samples. This is a two stage process. The stages in this process are product, sales in percentage, business, marketing, percentage.
Stacked Bar Ppt PowerPoint Presentation Icon Background Image
This is a stacked bar ppt powerpoint presentation icon background image. This is a four stage process. The stages in this process are product, percentage, finance, business, marketing.

Stacked Line Ppt PowerPoint Presentation Portfolio Deck
This is a stacked line ppt powerpoint presentation portfolio deck. This is a three stage process. The stages in this process are in percentage, product, business, marketing, finance.

Clustered Bar Ppt PowerPoint Presentation File Maker
This is a clustered bar ppt powerpoint presentation file maker. This is a five stage process. The stages in this process are product, business, marketing, graph, finance.
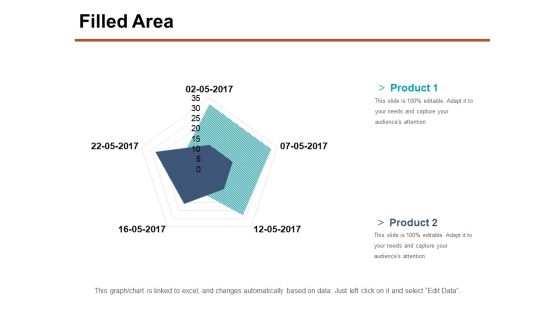
Filled Area Ppt PowerPoint Presentation File Inspiration
This is a filled area ppt powerpoint presentation file inspiration. This is a two stage process. The stages in this process are product, finance, marketing, graph, business.

High Low Close Chart Ppt PowerPoint Presentation Layouts Objects
This is a high low close chart ppt powerpoint presentation layouts objects. This is a five stage process. The stages in this process are high, volume, low, business, marketing.

Bubble Chart Ppt PowerPoint Presentation Pictures Slide Download
This is a bubble chart ppt powerpoint presentation pictures slide download. This is a three stage process. The stages in this process are product, business, graph, finance.

Cost Of Quality Template 2 Ppt PowerPoint Presentation Slides Design Inspiration
This is a cost of quality template 2 ppt powerpoint presentation slides design inspiration. This is a four stage process. The stages in this process are prevention cost, appraisal cost, internal failure cost, external failure cost.
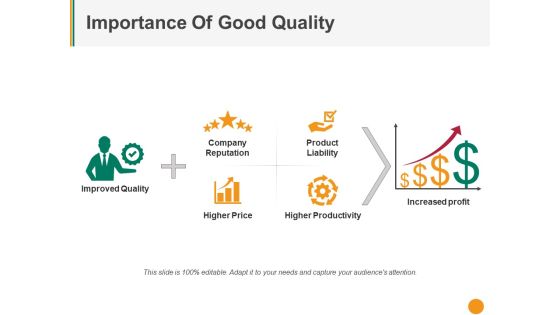
Importance Of Good Quality Ppt PowerPoint Presentation Example 2015
This is a importance of good quality ppt powerpoint presentation example 2015. This is a six stage process. The stages in this process are company reputation, product liability, higher productivity, higher price, improved quality.
Open High Low Close Ppt PowerPoint Presentation Icon Model
This is a open high low close ppt powerpoint presentation icon model. This is a five stage process. The stages in this process are high, low, product, business, finance.
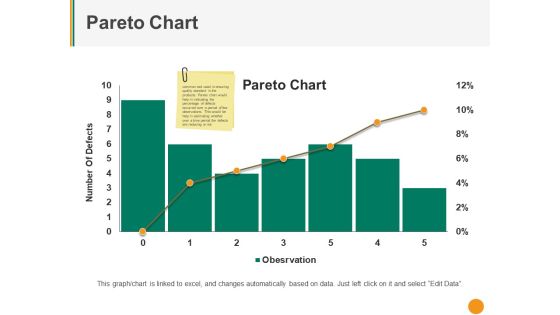
Pareto Chart Ppt PowerPoint Presentation Inspiration Master Slide
This is a pareto chart ppt powerpoint presentation inspiration master slide. This is a six stage process. The stages in this process are number of defects, pareto chart, finance, business, graph.
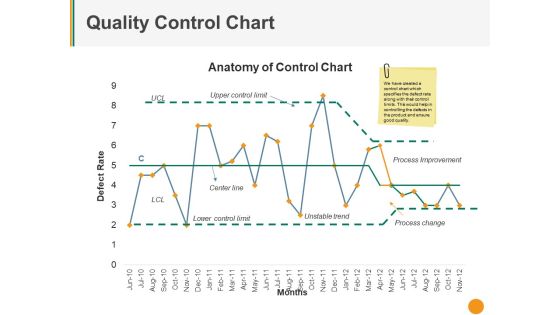
Quality Control Chart Ppt PowerPoint Presentation Pictures Deck
This is a quality control chart ppt powerpoint presentation pictures deck. This is a one stage process. The stages in this process are upper control limit, center line, unstable trend, process improvement, process change.
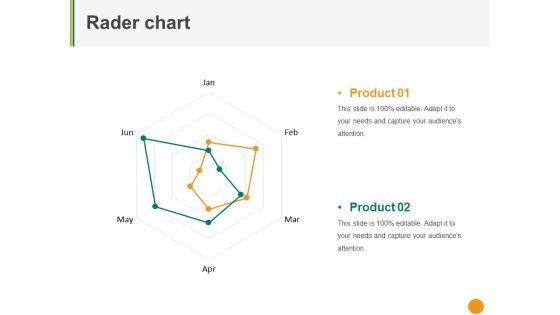
Rader Chart Ppt PowerPoint Presentation Professional Pictures
This is a rader chart ppt powerpoint presentation professional pictures. This is a two stage process. The stages in this process are product, finance, business, marketing.
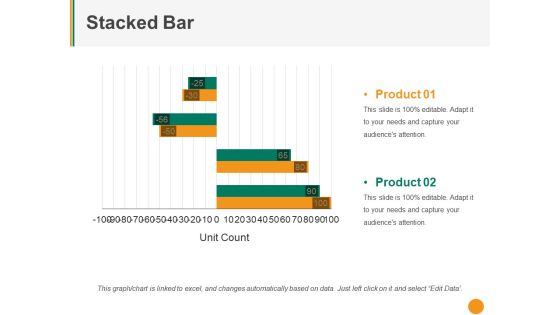
Stacked Bar Ppt PowerPoint Presentation Templates
This is a stacked bar ppt powerpoint presentation templates. This is a two stage process. The stages in this process are product, unit count, graph, business, marketing.

Bar Diagram Ppt PowerPoint Presentation File Graphics
This is a bar diagram ppt powerpoint presentation file graphics. This is a five stage process. The stages in this process are bar diagram, business, years, marketing, management.

Bar Graph Ppt PowerPoint Presentation Infographics Graphics Design
This is a bar graph ppt powerpoint presentation infographics graphics design. This is a five stage process. The stages in this process are bar graph, business, years, marketing, management.

Clustered Bar Ppt PowerPoint Presentation Show Slide Portrait
This is a clustered bar ppt powerpoint presentation show slide portrait. This is a four stage process. The stages in this process are product, unit count, graph, business, marketing.

Clustered Column Ppt PowerPoint Presentation Professional Graphic Tips
This is a clustered column ppt powerpoint presentation professional graphic tips. This is a two stage process. The stages in this process are product, profit in percentage, graph, business, marketing.
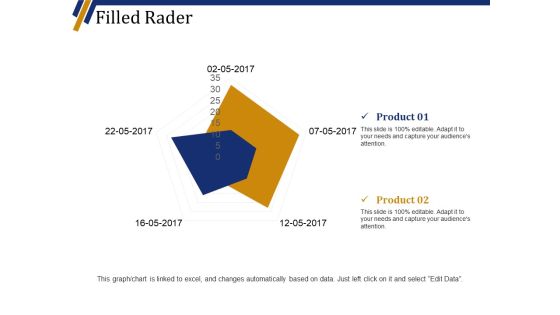
Filled Rader Ppt PowerPoint Presentation Show Brochure
This is a filled rader ppt powerpoint presentation show brochure. This is a two stage process. The stages in this process are product, finance, marketing, graph, business.
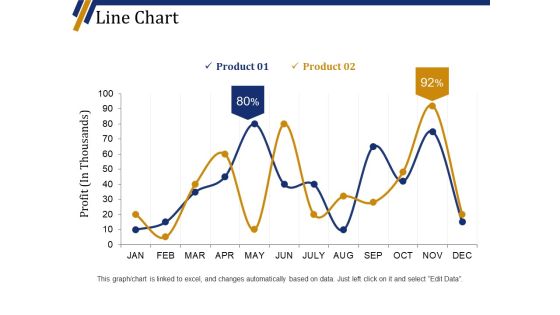
Line Chart Ppt PowerPoint Presentation Portfolio Background Designs
This is a line chart ppt powerpoint presentation portfolio background designs. This is a two stage process. The stages in this process are product, business, finance, marketing, profit in thousands.

Pareto Chart Ppt PowerPoint Presentation File Infographic Template
This is a pareto chart ppt powerpoint presentation file infographic template. This is a six stage process. The stages in this process are number of defects, business, marketing, graph.
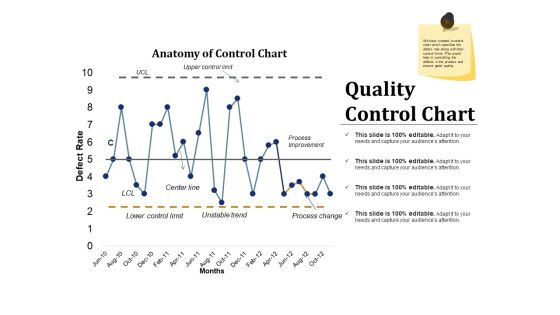
Quality Control Chart Ppt PowerPoint Presentation Inspiration Example Introduction
This is a quality control chart ppt powerpoint presentation inspiration example introduction. This is a two stage process. The stages in this process are process improvement, process change, unstable trend, lower control limit, center line.

Scatter Chart Ppt PowerPoint Presentation Summary Visuals
This is a scatter chart ppt powerpoint presentation summary visuals. This is a eight stage process. The stages in this process are product, profit in sales, in percentage, finance, business.
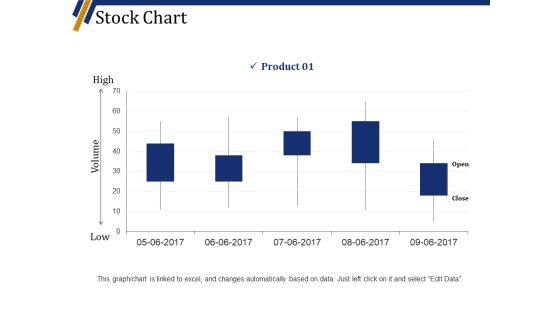
Stock Chart Ppt PowerPoint Presentation Slides Maker
This is a stock chart ppt powerpoint presentation slides maker. This is a five stage process. The stages in this process are high, volume, low, product, business, graph.

Bar Chart Ppt PowerPoint Presentation Summary Pictures
This is a bar chart ppt powerpoint presentation summary pictures. This is a four stage process. The stages in this process are product, unit count, finance, percentage, business.
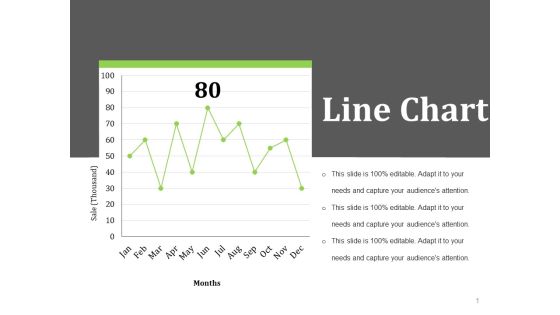
Line Chart Ppt PowerPoint Presentation Slides Template
This is a line chart ppt powerpoint presentation slides template. This is a one stage process. The stages in this process are months, sale thousand, business, marketing, finance.
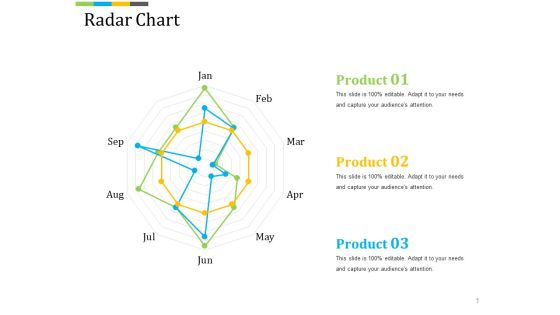
Radar Chart Ppt PowerPoint Presentation Summary Master Slide
This is a radar chart ppt powerpoint presentation summary master slide. This is a three stage process. The stages in this process are product, business, marketing, finance.
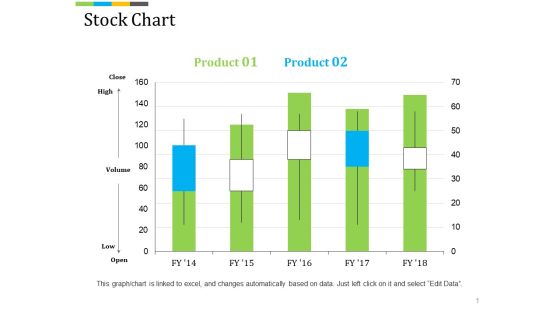
Stock Chart Ppt PowerPoint Presentation Professional Background Image
This is a stock chart ppt powerpoint presentation professional background image. This is a five stage process. The stages in this process are high, volume, low, finance, business, marketing.

Area Stacked Ppt PowerPoint Presentation Portfolio Icons
This is a area stacked ppt powerpoint presentation portfolio icons. This is a two stage process. The stages in this process are finance, business, marketing, strategy, planning.

Clustered Column Ppt PowerPoint Presentation Infographic Template Background Designs
This is a clustered column ppt powerpoint presentation infographic template background designs. This is a two stage process. The stages in this process are sales in percentage, bar, business, marketing, planning.
Rader With Markers Ppt PowerPoint Presentation Icon Professional
This is a rader with markers ppt powerpoint presentation icon professional. This is a two stage process. The stages in this process are business, marketing, strategy, planning, radar.
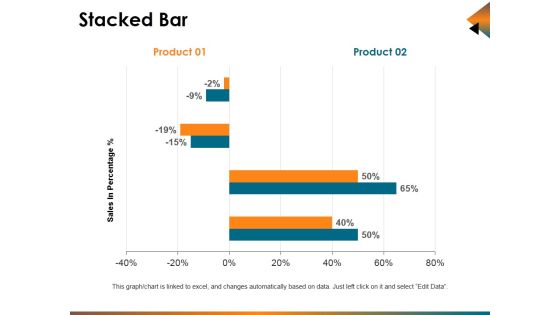
Stacked Bar Ppt PowerPoint Presentation Summary File Formats
This is a stacked bar ppt powerpoint presentation summary file formats. This is a four stage process. The stages in this process are business, marketing, finance, bar, analysis.

Volume Open High Low Close Chart Ppt PowerPoint Presentation Ideas Graphics Example
This is a volume open high low close chart ppt powerpoint presentation ideas graphics example. This is a five stage process. The stages in this process are business, bar graph, stock, cost, market.

Clustered Bar Ppt PowerPoint Presentation Background Designs
This is a clustered bar ppt powerpoint presentation background designs. This is a four stage process. The stages in this process are unit count, business, marketing, graph, finance.

Clustered Column Ppt PowerPoint Presentation Inspiration Shapes
This is a clustered column ppt powerpoint presentation inspiration shapes. This is a two stage process. The stages in this process are profit in percentage, business, marketing, graph, finance.
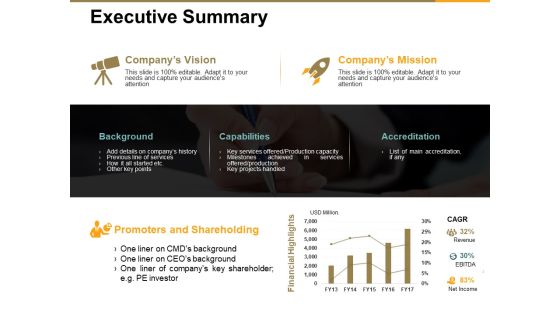
Executive Summary Ppt PowerPoint Presentation Inspiration Maker
This is a executive summary ppt powerpoint presentation inspiration maker. This is a four stage process. The stages in this process are company s vision, promoters and shareholding, company s mission, background, capabilities.

Filled Radar Chart Ppt PowerPoint Presentation File Information
This is a filled radar chart ppt powerpoint presentation file information. This is a two stage process. The stages in this process are chart, business, marketing, finance, strategy.
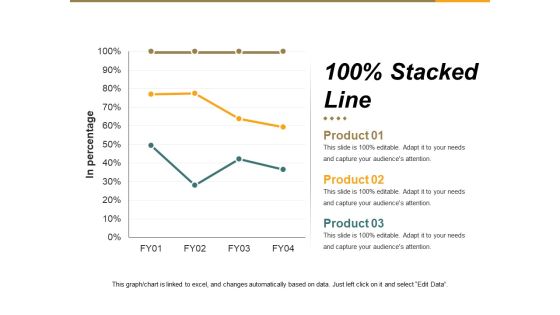
Stacked Line Ppt PowerPoint Presentation Ideas Outfit
This is a stacked line ppt powerpoint presentation ideas outfit. This is a three stage process. The stages in this process are in percentage, business, finance, marketing, strategy.
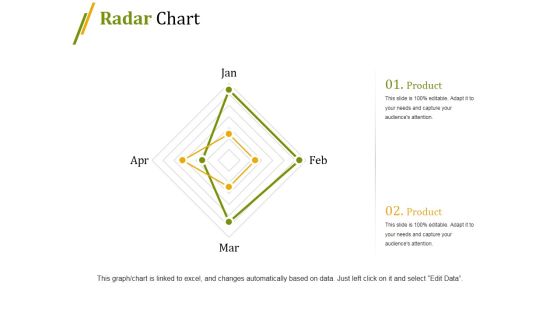
Radar Chart Ppt PowerPoint Presentation Infographic Template Professional
This is a radar chart ppt powerpoint presentation infographic template professional. This is a four stage process. The stages in this process are chart, finance, marketing, business, strategy.

Stock Chart Ppt PowerPoint Presentation Summary File Formats
This is a stock chart ppt powerpoint presentation summary file formats. This is a five stage process. The stages in this process are high, volume, low, business, graph, finance.

Pie Chart Ppt PowerPoint Presentation Layouts Topics
This is a pie chart ppt powerpoint presentation layouts topics. This is a three stage process. The stages in this process are pie, process, percentage, finance, business.

Stacked Bar Ppt PowerPoint Presentation Layouts Inspiration
This is a stacked bar ppt powerpoint presentation layouts inspiration. This is a four stage process. The stages in this process are finance, business, marketing, percentage, graph.
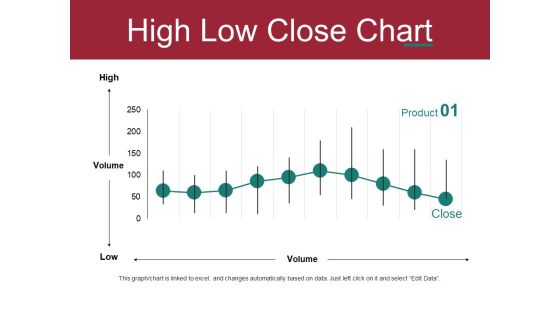
High Low Close Chart Ppt PowerPoint Presentation Deck
This is a high low close chart ppt powerpoint presentation deck. This is a one stage process. The stages in this process are high, volume, low, business, finance.

Radar Chart Ppt PowerPoint Presentation Gallery Example File
This is a radar chart ppt powerpoint presentation gallery example file. This is a three stage process. The stages in this process are radar chart, business, marketing, finance.

Sponsorship Opportunities Template 4 Ppt PowerPoint Presentation Design Ideas
This is a sponsorship opportunities template 4 ppt powerpoint presentation design ideas. This is a one stage process. The stages in this process are benefits, presenting sponsor, business, planning.

Stacked Area Clustered Column Ppt PowerPoint Presentation Ideas Show
This is a stacked area clustered column ppt powerpoint presentation ideas show. This is a three stage process. The stages in this process are in percentage, business, marketing, finance, graph.
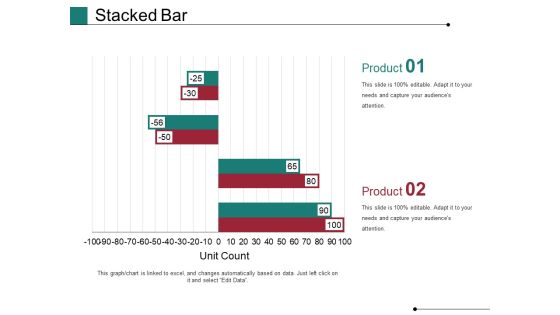
Stacked Bar Template 1 Ppt PowerPoint Presentation Show Slides
This is a stacked bar template 1 ppt powerpoint presentation show slides. This is a two stage process. The stages in this process are Unit Count, Business, Marketing, Graph, Finance.
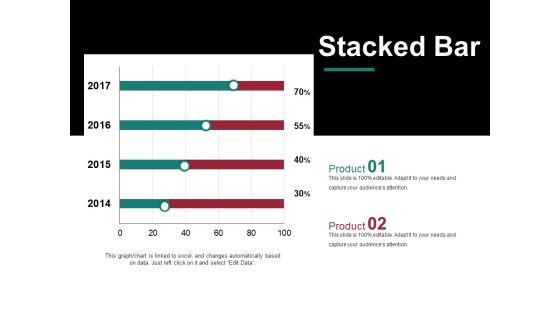
Stacked Bar Template 2 Ppt PowerPoint Presentation Model Graphic Images
This is a stacked bar template 2 ppt powerpoint presentation model graphic images. This is a two stage process. The stages in this process are business, years, marketing, percentage, finance.
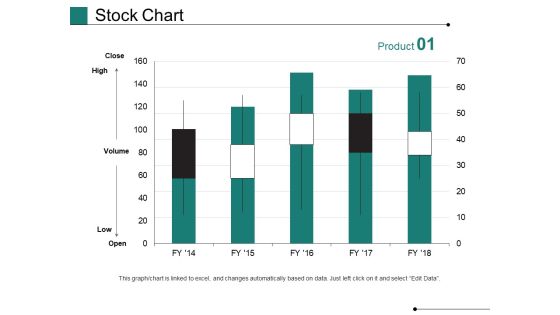
Stock Chart Ppt PowerPoint Presentation Pictures Graphics Design
This is a stock chart ppt powerpoint presentation pictures graphics design. This is a five stage process. The stages in this process are high, volume, low, business, marketing, graph.

Comparison Ppt PowerPoint Presentation Layouts Gridlines
This is a comparison ppt powerpoint presentation layouts gridlines. This is a three stage process. The stages in this process are year, growth, success, percentage, finance.
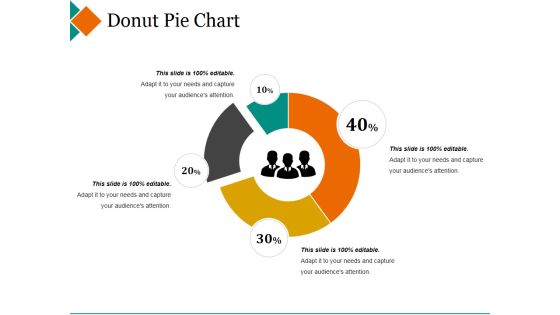
Donut Pie Chart Ppt PowerPoint Presentation Pictures Design Inspiration
This is a donut pie chart ppt powerpoint presentation pictures design inspiration. This is a four stage process. The stages in this process are maximum, donut, minimum, percentage, finance.
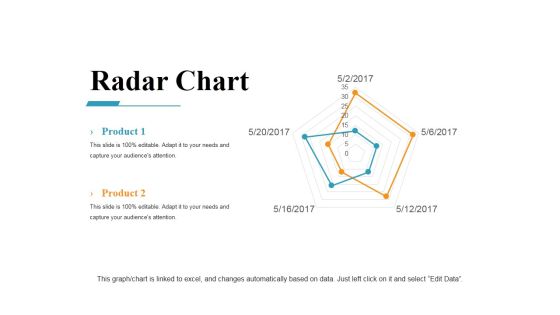
Radar Chart Ppt PowerPoint Presentation Ideas Master Slide
This is a radar chart ppt powerpoint presentation ideas master slide. This is a five stage process. The stages in this process are radar, business, marketing, strategy, finance.

Scatter Bubble Chart Ppt PowerPoint Presentation Gallery Example Introduction
This is a scatter bubble chart ppt powerpoint presentation gallery example introduction. This is a eight stage process. The stages in this process are business, marketing, finance, bubble, scatter.
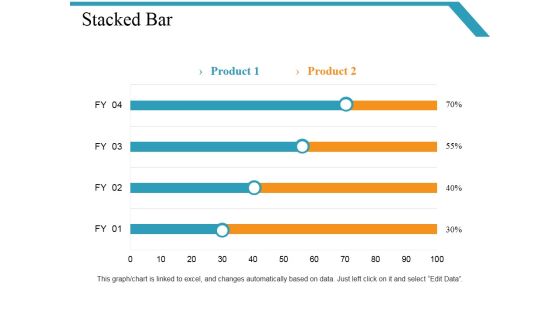
Stacked Bar Template Ppt PowerPoint Presentation Styles Show
This is a stacked bar template ppt powerpoint presentation styles show. This is a four stage process. The stages in this process are business, marketing, finance, bar, graph.

Stacked Bar Ppt PowerPoint Presentation Infographic Template Infographic Template
This is a stacked bar ppt powerpoint presentation infographic template infographic template. This is a four stage process. The stages in this process are business, marketing, finance, slide bar, graph.
Stacked Area Clustered Column Ppt PowerPoint Presentation Icon Aids
This is a stacked area clustered column ppt powerpoint presentation icon aids. This is a three stage process. The stages in this process are business, marketing, finance, bar, graph.

Column Chart Ppt PowerPoint Presentation Outline Themes
This is a column chart ppt powerpoint presentation outline themes. This is a two stage process. The stages in this process are years, business, graph, marketing, finance.

Customer Acquisition Cost By Channel Template 1 Ppt PowerPoint Presentation Portfolio Mockup
This is a customer acquisition cost by channel template 1 ppt powerpoint presentation portfolio mockup. This is a five stage process. The stages in this process are finance, business, graph, online, marketing.

Customer Acquisition Cost Template 1 Ppt PowerPoint Presentation Infographic Template Skills
This is a customer acquisition cost template 1 ppt powerpoint presentation infographic template skills. This is a six stage process. The stages in this process are total web visitors, sem cost per click, conversion to trial, cost per employee per month, input variables.
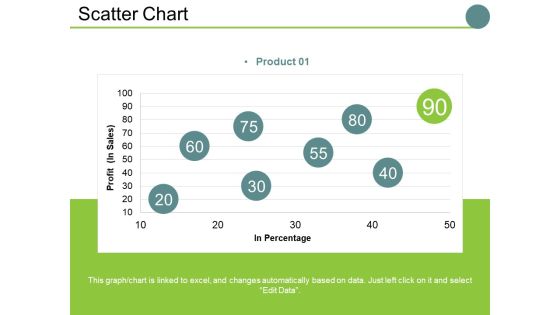
Scatter Chart Ppt PowerPoint Presentation Slides Examples
This is a scatter chart ppt powerpoint presentation slides examples. This is a one stage process. The stages in this process are profit , in percentage, business, marketing, finance, graph.
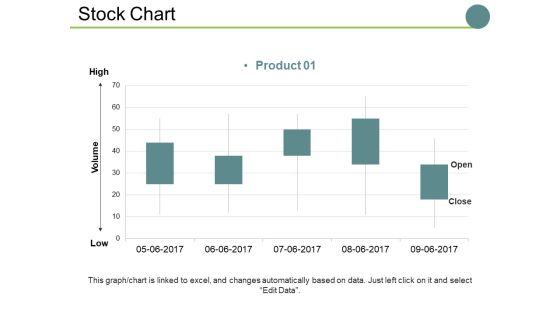
Stock Chart Ppt PowerPoint Presentation Show Sample
This is a stock chart ppt powerpoint presentation show sample. This is a one stage process. The stages in this process are high, volume, low, business, graph, marketing.

Customer Acquisition Cost By Channel Template 1 Ppt PowerPoint Presentation Show Graphic Tips
This is a customer acquisition cost by channel template 1 ppt powerpoint presentation show graphic tips. This is a five stage process. The stages in this process are business, finance, growth, analysis, strategy.

Radar Chart Ppt PowerPoint Presentation Portfolio Design Templates
This is a radar chart ppt powerpoint presentation portfolio design templates. This is a two stage process. The stages in this process are radar chart, product, finance, marketing, strategy, business.

Stock Chart Ppt PowerPoint Presentation Styles Deck
This is a stock chart ppt powerpoint presentation styles deck. This is a two stage process. The stages in this process are high, volume, low.

Dashboard Ppt PowerPoint Presentation Infographics Images
This is a dashboard ppt powerpoint presentation infographics images. This is a two stage process. The stages in this process are low, medium, high, dashboard, measurement.
Stacked Line Ppt PowerPoint Presentation Icon Format Ideas
This is a stacked line ppt powerpoint presentation icon format ideas. This is a three stage process. The stages in this process are product, in percentage, stacked line, finance.
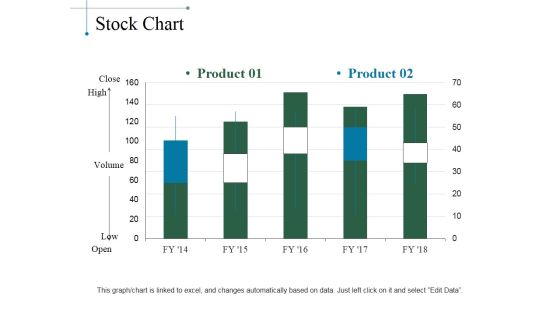
Stock Chart Ppt PowerPoint Presentation Layouts Designs Download
This is a stock chart ppt powerpoint presentation layouts designs download. This is a five stage process. The stages in this process are product, close, high, volume, low, open.

Clustered Bar Ppt PowerPoint Presentation Outline Demonstration
This is a clustered bar ppt powerpoint presentation outline demonstration. This is a three stage process. The stages in this process are unit count, graph, business, marketing, finance.
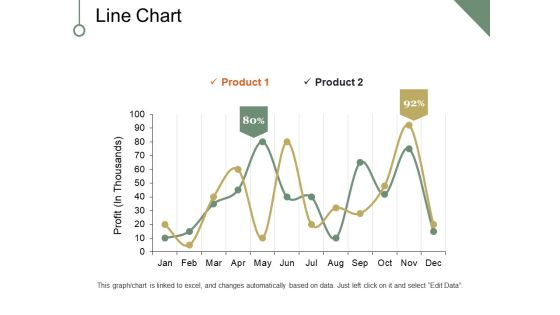
Line Chart Ppt PowerPoint Presentation Pictures Portfolio
This is a line chart ppt powerpoint presentation pictures portfolio. This is a two stage process. The stages in this process are profit, business, marketing, finance, chart.
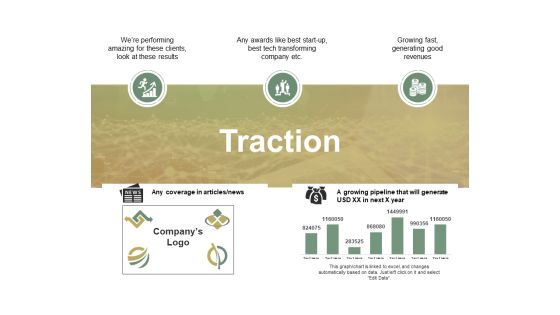
Traction Ppt PowerPoint Presentation Layouts Portrait
This is a traction ppt powerpoint presentation layouts portrait. This is a five stage process. The stages in this process are any coverage in articles news, growing pipeline that will generate usd xx in next x year, business, finance, marketing.

Bar Chart Ppt PowerPoint Presentation Infographics Icon
This is a bar chart ppt powerpoint presentation infographics icon. This is a three stage process. The stages in this process are product, bar graph, success, business, growth.
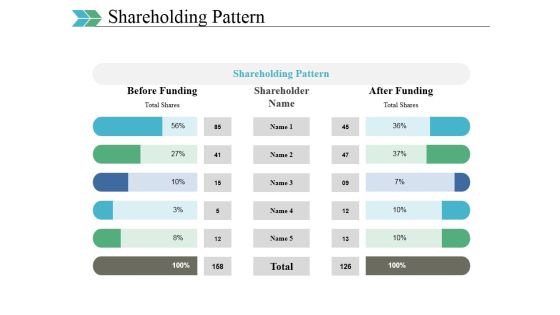
Shareholding Pattern Ppt PowerPoint Presentation Infographic Template Grid
This is a shareholding pattern ppt powerpoint presentation infographic template grid. This is a five stage process. The stages in this process are before funding, shareholder name, after funding, shareholding pattern.
Radar Chart Ppt PowerPoint Presentation Icon Picture
This is a radar chart ppt powerpoint presentation icon picture. This is a two stage process. The stages in this process are chart, finance, marketing, business, strategy.
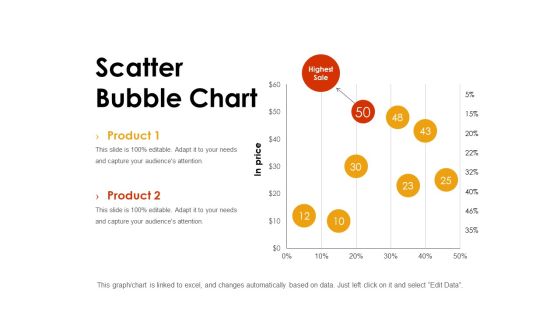
Scatter Bubble Chart Ppt PowerPoint Presentation Styles Background
This is a scatter bubble chart ppt powerpoint presentation styles background. This is a two stage process. The stages in this process are chart, in price, highest sale, finance, marketing.
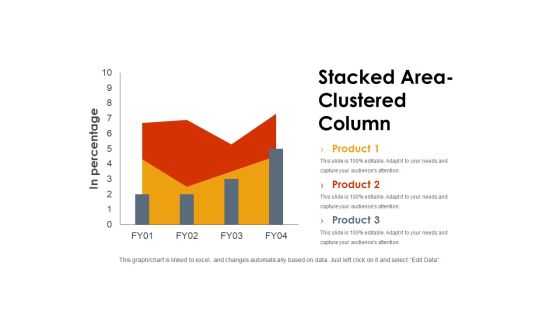
Stacked Area Clustered Column Ppt PowerPoint Presentation Styles Background Image
This is a stacked area clustered column ppt powerpoint presentation styles background image. This is a three stage process. The stages in this process are in percentage, graph, business, marketing, finance.
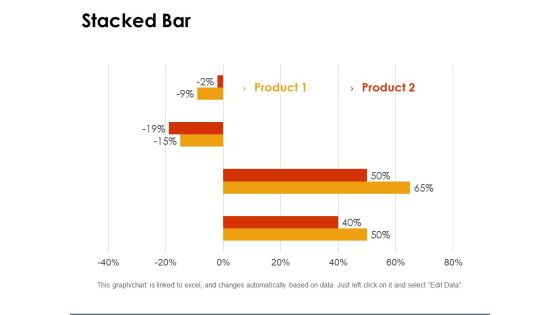
Stacked Bar Template 1 Ppt PowerPoint Presentation Gallery Clipart
This is a stacked bar template 1 ppt powerpoint presentation gallery clipart. This is a two stage process. The stages in this process are percentage, graph, business, marketing, finance.
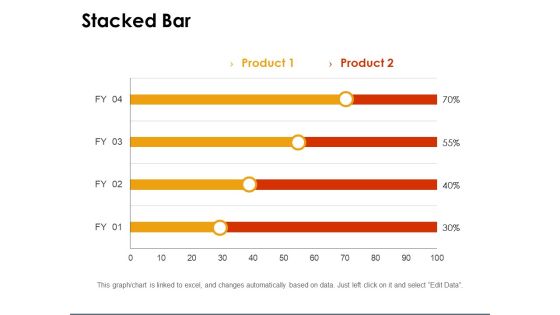
Stacked Bar Template 2 Ppt PowerPoint Presentation Infographics Graphics Design
This is a stacked bar template 2 ppt powerpoint presentation infographics graphics design. This is a two stage process. The stages in this process are percentage, business, marketing, finance.

Column Chart Ppt PowerPoint Presentation Gallery Styles
This is a column chart ppt powerpoint presentation gallery styles. This is a two stage process. The stages in this process are years, graph, business, marketing, finance.
Radar Chart Ppt PowerPoint Presentation Icon Files
This is a radar chart ppt powerpoint presentation icon files. This is a three stage process. The stages in this process are chart, business, marketing, finance, strategy.

Clustered Column Ppt PowerPoint Presentation File Guidelines
This is a clustered column ppt powerpoint presentation file guidelines. This is a two stage process. The stages in this process are profit, business, marketing, graph, finance.

Clustered Column Ppt PowerPoint Presentation Pictures Objects
This is a clustered column ppt powerpoint presentation pictures objects. This is a two stage process. The stages in this process are profit, business, marketing, finance graph.

Financing Ppt PowerPoint Presentation Ideas Format Ideas
This is a financing ppt powerpoint presentation ideas format ideas. This is a two stage process. The stages in this process are investment terms, business, marketing, strategy, finance.
Shareholding Pattern Ppt PowerPoint Presentation Icon Layouts
This is a shareholding pattern ppt powerpoint presentation icon layouts. This is a five stage process. The stages in this process are before funding, shareholder, after funding, business, percentage.
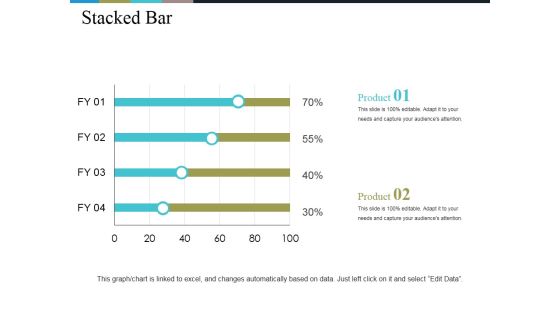
Stacked Bar Ppt PowerPoint Presentation Gallery Example Introduction
This is a stacked bar ppt powerpoint presentation gallery example introduction. This is a two stage process. The stages in this process are bar, percentage, business, marketing, finance.

Area Chart Ppt PowerPoint Presentation Professional Brochure
This is a area chart ppt powerpoint presentation professional brochure. This is a two stage process. The stages in this process are sales in percentage, business, marketing, finance, graph.

Nurturing Ppt PowerPoint Presentation Infographic Template Background
This is a nurturing ppt powerpoint presentation infographic template background. This is a seven stage process. The stages in this process are creating relevant content, personalizing campaigns, targeting by prospect persona, targeting by decision stage, segmenting lead data.

Radar Chart Ppt PowerPoint Presentation Layouts Outfit
This is a radar chart ppt powerpoint presentation layouts outfit. This is a two stage process. The stages in this process are finance, business, marketing, chart, strategy.

Bar Chart Ppt PowerPoint Presentation Portfolio Diagrams
This is a bar chart ppt powerpoint presentation portfolio diagrams. This is a three stage process. The stages in this process are sales in percentage, business, marketing, graph, finance.

Bubble Chart Ppt PowerPoint Presentation Show Graphics
This is a bubble chart ppt powerpoint presentation show graphics. This is a four stage process. The stages in this process are business, marketing, graph, finance, strategy.
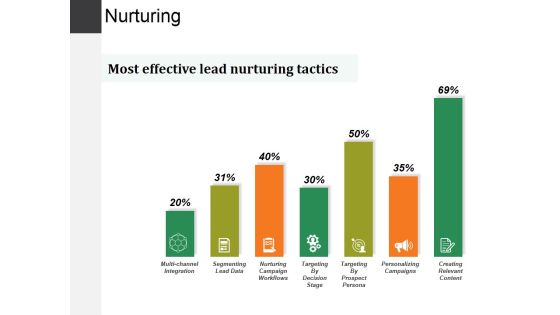
Nurturing Ppt PowerPoint Presentation Summary Brochure
This is a nurturing ppt powerpoint presentation summary brochure. This is a seven stage process. The stages in this process are segmenting lead data, nurturing campaign workflows, targeting by prospect persona, personalizing campaigns, creating relevant content.
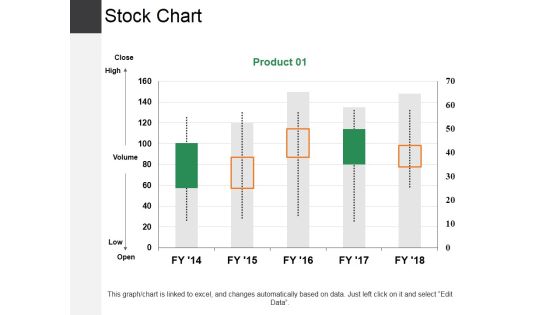
Stock Chart Ppt PowerPoint Presentation Slides Outline
This is a stock chart ppt powerpoint presentation slides outline. This is a one stage process. The stages in this process are high, low, business, marketing, graph.

Stacked Line With Markers Ppt PowerPoint Presentation Infographic Template Graphics Example
This is a stacked line with markers ppt powerpoint presentation infographic template graphics example. This is a one stage process. The stages in this process are in million, task, product, finance, line graph.

Brand Tracking Info Graphics Ppt PowerPoint Presentation Infographic Template Graphics Download
This is a brand tracking info graphics ppt powerpoint presentation infographic template graphics download. This is a four stage process. The stages in this process are business, marketing, finance, strategy, icons.

Bubble Chart Ppt PowerPoint Presentation Styles Objects
This is a bubble chart ppt powerpoint presentation styles objects. This is a two stage process. The stages in this process are profit, business, marketing, finance, chart.

Clustered Bar Ppt PowerPoint Presentation Icon Slides
This is a clustered bar ppt powerpoint presentation icon slides. This is a two stage process. The stages in this process are profit, business, marketing, finance, chart.
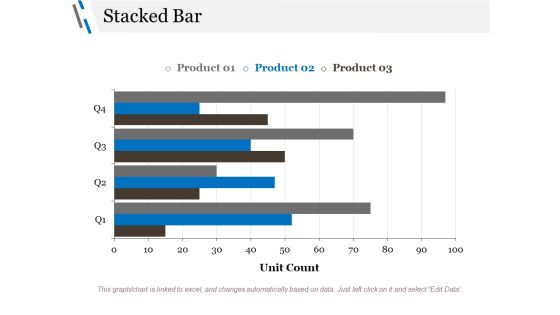
Stacked Bar Ppt PowerPoint Presentation File Backgrounds
This is a stacked bar ppt powerpoint presentation file backgrounds. This is a three stage process. The stages in this process are unit count, finance, business, marketing, graph.
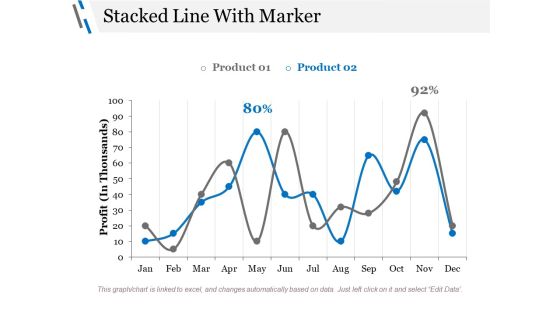
Stacked Line With Marker Ppt PowerPoint Presentation Styles Graphics Design
This is a stacked line with marker ppt powerpoint presentation styles graphics design. This is a three stage process. The stages in this process are profit, business, marketing, finance, percentage.

Brand Distribution Ppt PowerPoint Presentation File Graphics Example
This is a brand distribution ppt powerpoint presentation file graphics example. This is a six stage process. The stages in this process are business, marketing, strategy, finance, distribution.

Area Chart Ppt PowerPoint Presentation Model Influencers
This is a area chart ppt powerpoint presentation model influencers. This is a two stage process. The stages in this process are sales in percentage, chart, business, marketing, finance.

Brand Distribution Ppt PowerPoint Presentation Outline Example
This is a brand distribution ppt powerpoint presentation outline example. This is a six stage process. The stages in this process are finance, business, marketing, percentage, strategy.

Brand Tracking Info Graphics Ppt PowerPoint Presentation Slides Inspiration
This is a brand tracking info graphics ppt powerpoint presentation slides inspiration. This is a four stage process. The stages in this process are finance, marketing, percentage, business, strategy.

Radar Chart Ppt PowerPoint Presentation Summary Background Images
This is a radar chart ppt powerpoint presentation summary background images. This is a two stage process. The stages in this process are chart, business, marketing, finance, strategy.
 Home
Home