AI PPT Maker
Templates
PPT Bundles
Design Services
Business PPTs
Business Plan
Management
Strategy
Introduction PPT
Roadmap
Self Introduction
Timelines
Process
Marketing
Agenda
Technology
Medical
Startup Business Plan
Cyber Security
Dashboards
SWOT
Proposals
Education
Pitch Deck
Digital Marketing
KPIs
Project Management
Product Management
Artificial Intelligence
Target Market
Communication
Supply Chain
Google Slides
Research Services
 One Pagers
All Categories
-
Home
- Customer Favorites
- Financial
Financial
Happy Woman With Dollars In Hand Ppt PowerPoint Presentation Icon Visuals
This is a happy woman with dollars in hand ppt powerpoint presentation icon visuals. This is a one stage process. The stages in this process are mutual funds, funds to buy, investment slide.

Key Performance Indicator Analytics Dashboard Ppt PowerPoint Presentation Model Example Topics
This is a key performance indicator analytics dashboard ppt powerpoint presentation model example topics. This is a five stage process. The stages in this process are kpi proposal, kpi plan, kpi scheme.
KPI Metrics Vector Icon Ppt PowerPoint Presentation Layouts Slide
This is a kpi metrics vector icon ppt powerpoint presentation layouts slide. This is a three stage process. The stages in this process are kpi proposal, kpi plan, kpi scheme.

Stacked Bar Ppt PowerPoint Presentation Visual Aids Pictures
This is a stacked bar ppt powerpoint presentation visual aids pictures. This is a two stage process. The stages in this process are product, percentage, finance, business, marketing.

3D Bar Chart For Percentage Values Comparison Ppt PowerPoint Presentation Professional Visual Aids
This is a 3d bar chart for percentage values comparison ppt powerpoint presentation professional visual aids. This is a five stage process. The stages in this process are art, colouring, paint brush.

3D Charts For Comparing Amounts And Volume Ppt PowerPoint Presentation Show Deck
This is a 3d charts for comparing amounts and volume ppt powerpoint presentation show deck. This is a five stage process. The stages in this process are art, colouring, paint brush.

Finance Talent Mapping Ppt PowerPoint Presentation Portfolio Template
This is a finance talent mapping ppt powerpoint presentation portfolio template. This is a three stage process. The stages in this process are business, management, strategy, finance, icons.

Column Chart Employee Value Proposition Ppt PowerPoint Presentation Slides Graphics Design
This is a column chart employee value proposition ppt powerpoint presentation slides graphics design. This is a two stage process. The stages in this process are business, management, strategy, analysis, marketing.
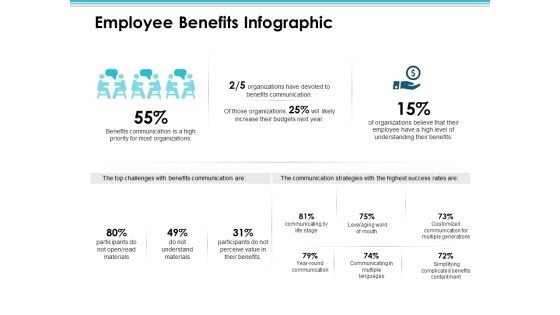
Employee Benefits Infographic Employee Value Proposition Ppt PowerPoint Presentation Styles Diagrams
This is a employee benefits infographic employee value proposition ppt powerpoint presentation styles diagrams. This is a three stage process. The stages in this process are business, management, strategy, analysis, marketing.

Data Analysis Vector Icons Ppt Powerpoint Presentation Layouts Gridlines
This is a data analysis vector icons ppt powerpoint presentation layouts gridlines. This is a two stage process. The stages in this process are data presentation, content presentation, information presentation.

Data Comparison And Analysis Chart Ppt Powerpoint Presentation File Background Images
This is a data comparison and analysis chart ppt powerpoint presentation file background images. This is a four stage process. The stages in this process are data presentation, content presentation, information presentation.

Data Interpretation Percentage Analysis Ppt Powerpoint Presentation Summary Icon
This is a data interpretation percentage analysis ppt powerpoint presentation summary icon. This is a six stage process. The stages in this process are data presentation, content presentation, information presentation.
Five Business Options Representation With Icons Ppt Powerpoint Presentation Portfolio Aids
This is a five business options representation with icons ppt powerpoint presentation portfolio aids. This is a five stage process. The stages in this process are data presentation, content presentation, information presentation.

Product Comparison Data Bar Graph Ppt Powerpoint Presentation Slides Show
This is a product comparison data bar graph ppt powerpoint presentation slides show. This is a four stage process. The stages in this process are data presentation, content presentation, information presentation.

Cost Reduction With Downward Arrow And Dollar Sign Ppt Powerpoint Presentation Infographics Templates
This is a cost reduction with downward arrow and dollar sign ppt powerpoint presentation infographics templates. This is a three stage process. The stages in this process are data analysis, data science, information science.

Facility Maintenance Ppt Powerpoint Presentation Infographics Design Inspiration
This is a facility maintenance ppt powerpoint presentation infographics design inspiration. This is a two stage process. The stages in this process are fm, facilities management, support management.
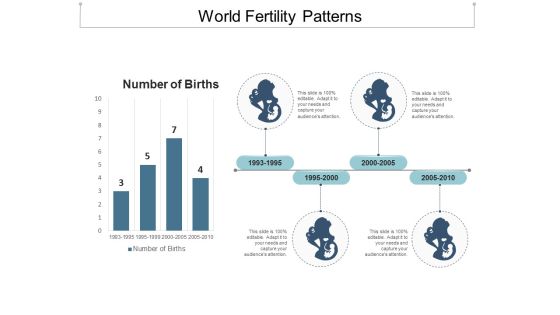
World Fertility Patterns Ppt Powerpoint Presentation Gallery Smartart
This is a world fertility patterns ppt powerpoint presentation gallery smartart. This is a four stage process. The stages in this process are fertility, productiveness, fecundity.

Learning And Experience Graph With Three Milestones Ppt PowerPoint Presentation Model Introduction
This is a learning and experience graph with three milestones ppt powerpoint presentation model introduction. This is a three stage process. The stages in this process are experience curve, learning curve.
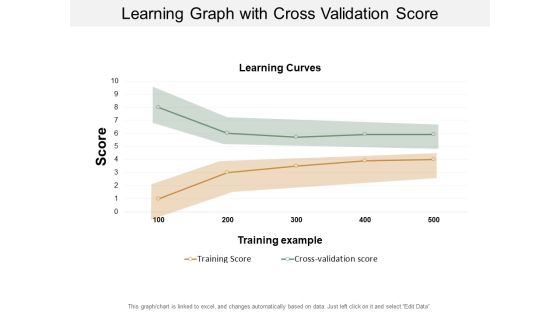
Learning Graph With Cross Validation Score Ppt PowerPoint Presentation Visual Aids Inspiration
This is a learning graph with cross validation score ppt powerpoint presentation visual aids inspiration. This is a two stage process. The stages in this process are experience curve, learning curve.
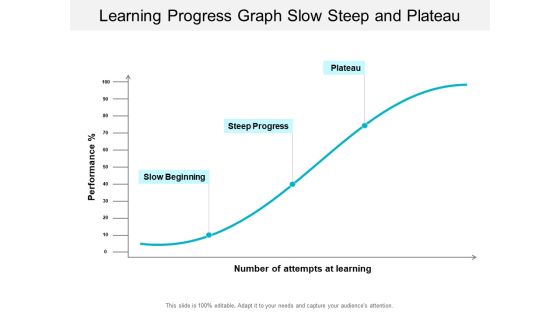
Learning Progress Graph Slow Steep And Plateau Ppt PowerPoint Presentation Professional Gallery
This is a learning progress graph slow steep and plateau ppt powerpoint presentation professional gallery. This is a three stage process. The stages in this process are experience curve, learning curve.
Data Research And Analysis For Mobile Users Ppt PowerPoint Presentation Icon Inspiration
This is a data research and analysis for mobile users ppt powerpoint presentation icon inspiration. This is a four stage process. The stages in this process are mobile analytics, mobile tracking, mobile web analytics.

Dashboard Marketing Planning Ppt PowerPoint Presentation Slides Slideshow
This is a dashboard marketing planning ppt powerpoint presentation slides slideshow. This is a three stage process. The stages in this process are dashboard, finance, analysis, business, investment.

Business Review And Performance Assessment Dashboards Ppt PowerPoint Presentation Infographics Show
This is a business review and performance assessment dashboards ppt powerpoint presentation infographics show. This is a four stage process. The stages in this process are year in review, yearly highlights, countdowns.

Car Dashboard And Speedometer Graphics Ppt PowerPoint Presentation File Graphics Template
This is a car dashboard and speedometer graphics ppt powerpoint presentation file graphics template. This is a four stage process. The stages in this process are fuel gauge, gas gauge, fuel containers.
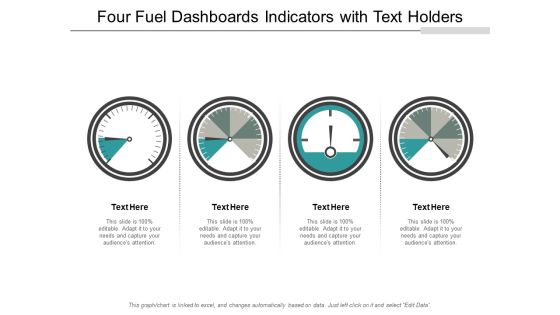
Four Fuel Dashboards Indicators With Text Holders Ppt PowerPoint Presentation File Graphics Design
This is a four fuel dashboards indicators with text holders ppt powerpoint presentation file graphics design. This is a four stage process. The stages in this process are fuel gauge, gas gauge, fuel containers.
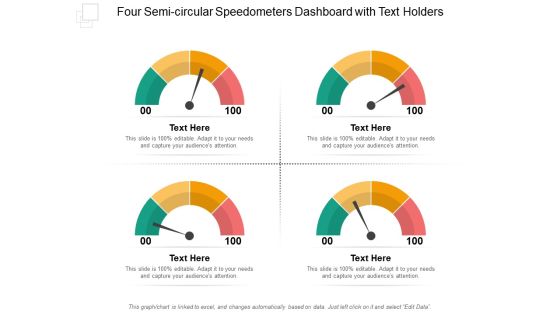
Four Semi Circular Speedometers Dashboard With Text Holders Ppt PowerPoint Presentation File Layouts
This is a four semi circular speedometers dashboard with text holders ppt powerpoint presentation file layouts. This is a four stage process. The stages in this process are fuel gauge, gas gauge, fuel containers.
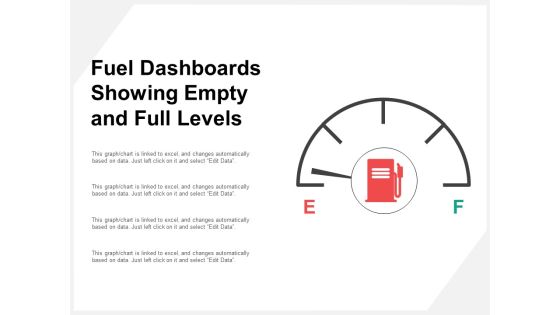
Fuel Dashboards Showing Empty And Full Levels Ppt PowerPoint Presentation Professional Slide Portrait
This is a fuel dashboards showing empty and full levels ppt powerpoint presentation professional slide portrait. This is a four stage process. The stages in this process are fuel gauge, gas gauge, fuel containers.

Fuel Levels Indicators And Dashboards Ppt PowerPoint Presentation Outline Skills
This is a fuel levels indicators and dashboards ppt powerpoint presentation outline skills. This is a three stage process. The stages in this process are fuel gauge, gas gauge, fuel containers.
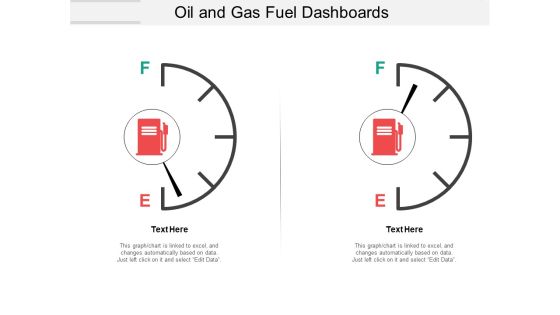
Oil And Gas Fuel Dashboards Ppt PowerPoint Presentation File Introduction
This is a oil and gas fuel dashboards ppt powerpoint presentation file introduction. This is a two stage process. The stages in this process are fuel gauge, gas gauge, fuel containers.
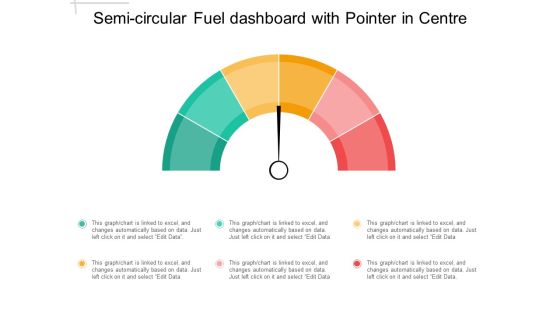
Semi Circular Fuel Dashboard With Pointer In Centre Ppt PowerPoint Presentation Outline Visuals
This is a semi circular fuel dashboard with pointer in centre ppt powerpoint presentation outline visuals. This is a three stage process. The stages in this process are fuel gauge, gas gauge, fuel containers.

Three Dashboard Speed Indicators With Text Holders Ppt PowerPoint Presentation Summary Layout
This is a three dashboard speed indicators with text holders ppt powerpoint presentation summary layout. This is a three stage process. The stages in this process are fuel gauge, gas gauge, fuel containers.
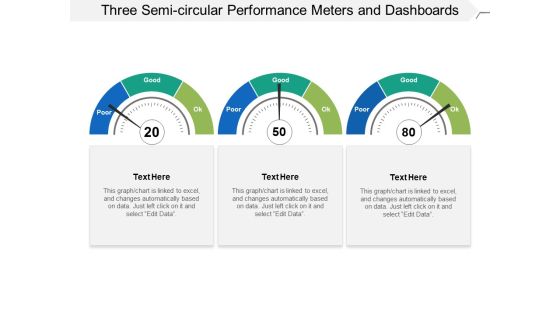
Three Semi Circular Performance Meters And Dashboards Ppt PowerPoint Presentation Slides Influencers
This is a three semi circular performance meters and dashboards ppt powerpoint presentation slides influencers. This is a three stage process. The stages in this process are fuel gauge, gas gauge, fuel containers.

Debit Card Payment Processing Steps With Icons Ppt PowerPoint Presentation Portfolio Background
This is a debit card payment processing steps with icons ppt powerpoint presentation portfolio background. This is a six stage process. The stages in this process are payment processing, instalment processing, premium processing.
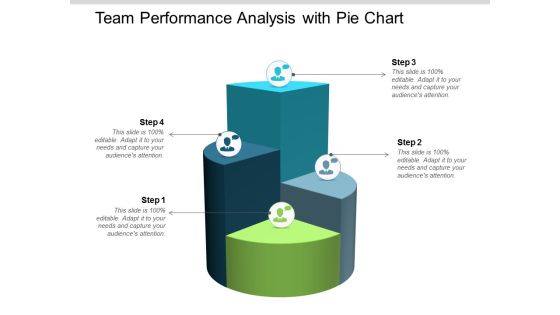
Team Performance Analysis With Pie Chart Ppt Powerpoint Presentation Infographic Template Slideshow
This is a team performance analysis with pie chart ppt powerpoint presentation infographic template slideshow. This is a four stage process. The stages in this process are team performance, member performance, group performance.

Contract Performance Management Administration And Monitoring Ppt PowerPoint Presentation Inspiration Deck
This is a contract performance management administration and monitoring ppt powerpoint presentation inspiration deck. This is a five stage process. The stages in this process are contract management, contract negotiation, deal making.
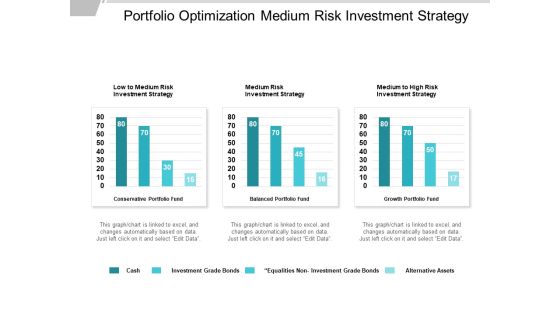
Portfolio Optimization Medium Risk Investment Strategy Ppt PowerPoint Presentation Model Good
This is a portfolio optimization medium risk investment strategy ppt powerpoint presentation model good. This is a four stage process. The stages in this process are portfolio strategies, portfolio plans, business.

Stock Chart Finance Analysis Ppt Powerpoint Presentation Ideas Portrait
This is a stock chart finance analysis ppt powerpoint presentation ideas portrait. This is a three stage process. The stages in this process are finance, marketing, management, investment, strategy.
Human Hand With Percent Sign Ppt PowerPoint Presentation Icon Clipart Images
This is a human hand with percent sign ppt powerpoint presentation icon clipart images. This is a three stage process. The stages in this process are percentage icon, dividend icon, portion icon.
Percentage Icon In Circle With Text Holders Ppt PowerPoint Presentation Layouts Inspiration
This is a percentage icon in circle with text holders ppt powerpoint presentation layouts inspiration. This is a three stage process. The stages in this process are percentage icon, dividend icon, portion icon.

Percentage Symbol With Text Holders Ppt PowerPoint Presentation Example 2015
This is a percentage symbol with text holders ppt powerpoint presentation example 2015. This is a three stage process. The stages in this process are percentage icon, dividend icon, portion icon.
Percentage Value Comparison Pie Chart Icon Ppt PowerPoint Presentation Model Clipart Images
This is a percentage value comparison pie chart icon ppt powerpoint presentation model clipart images. This is a three stage process. The stages in this process are percentage icon, dividend icon, portion icon.
White Percentage Sign In Green Circle Ppt PowerPoint Presentation Outline Templates
This is a white percentage sign in green circle ppt powerpoint presentation outline templates. This is a three stage process. The stages in this process are percentage icon, dividend icon, portion icon.
Income Statement Showing Expenses And Net Profit Ppt PowerPoint Presentation Slides Example
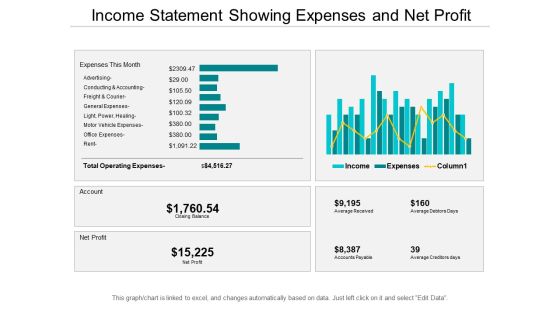
This is a income statement showing expenses and net profit ppt powerpoint presentation slides example. This is a five stage process. The stages in this process are accounting review, accounting report, accounting statement.

Income Statement With Expenses Income And Net Profit Ppt PowerPoint Presentation Infographic Template Smartart
This is a income statement with expenses income and net profit ppt powerpoint presentation infographic template smartart. This is a four stage process. The stages in this process are accounting review, accounting report, accounting statement.

Pie Chart Finance Ppt PowerPoint Presentation Infographics Mockup
This is a pie chart finance ppt powerpoint presentation infographics mockup . This is a four stage process. The stages in this process are finance, marketing, management, investment, analysis.
Six Steps In Linear Flow With Icons Sales Strategies And Finacial Projections Ppt Powerpoint Presentation Inspiration Guide
This is a six steps in linear flow with icons sales strategies and finacial projections ppt powerpoint presentation inspiration guide. This is a six stage process. The stages in this process are 7 point infographic, 7 steps infographic, 7 stages infographic.
three steps in linear flow with icons sales strategies and finacial projections ppt powerpoint presentation layouts visual aids
This is a three steps in linear flow with icons sales strategies and finacial projections ppt powerpoint presentation layouts visual aids. This is a three stage process. The stages in this process are 7 point infographic, 7 steps infographic, 7 stages infographic.

Sales Management Reduce Sales Cycle Length Ppt Powerpoint Presentation Ideas Deck
This is a sales management reduce sales cycle length ppt powerpoint presentation ideas deck. This is a three stage process. The stages in this process are enablement plan, enablement strategy, enablement idea.

Pos System Accept Card Payment Ppt PowerPoint Presentation Model Graphics Design
This is a pos system accept card payment ppt powerpoint presentation model graphics design. This is a four stage process. The stages in this process are point of purchase, point of sale system, pos.
Pos System Reporting And Analytics Ppt PowerPoint Presentation Summary Gallery
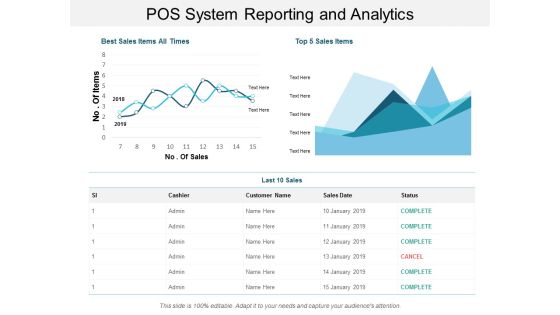
This is a pos system reporting and analytics ppt powerpoint presentation summary gallery. This is a two stage process. The stages in this process are point of purchase, point of sale system, pos.
Spinning Wheel With Dollar Sign Vector Icon Ppt PowerPoint Presentation Portfolio Deck Cpb
This is a spinning wheel with dollar sign vector icon ppt powerpoint presentation portfolio deck cpb. This is a four stage process. The stages in this process are wheel of fortune, american game, wheel watchers.

Bar Graph Icon For Research Analysis Ppt PowerPoint Presentation Summary Portfolio
Presenting this set of slides with name bar graph icon for research analysis ppt powerpoint presentation summary portfolio. This is a three stage process. The stages in this process are data visualization icon, research analysis, business focus. This is a completely editable PowerPoint presentation and is available for immediate download. Download now and impress your audience.

Data Representation Vector Icon Ppt PowerPoint Presentation Infographic Template Samples
Presenting this set of slides with name data representation vector icon ppt powerpoint presentation infographic template samples. This is a one stage process. The stages in this process are data visualization icon, research analysis, business focus. This is a completely editable PowerPoint presentation and is available for immediate download. Download now and impress your audience.
Students Sitting In Classroom Vector Icon Ppt PowerPoint Presentation Styles Outfit
Presenting this set of slides with name students sitting in classroom vector icon ppt powerpoint presentation styles outfit. This is a one process. The stages in this process are Classroom, Management, Strategy, Planning, Business. This is a completely editable PowerPoint presentation and is available for immediate download. Download now and impress your audience.
Your Investment In Publicity Generation Proposal Services Ppt PowerPoint Presentation Professional Outline
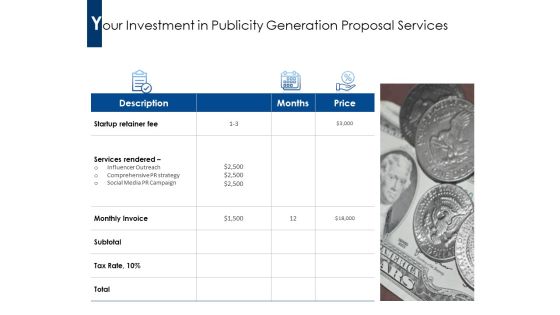
Presenting this set of slides with name your investment in publicity generation proposal services ppt powerpoint presentation professional outline. This is a one stage process. The stages in this process are startup retainer fee, services rendered, monthly invoice, price . This is a completely editable PowerPoint presentation and is available for immediate download. Download now and impress your audience.
Dollar Coins Falling On Man Vector Icon Ppt PowerPoint Presentation Files PDF
Presenting this set of slides with name dollar coins falling on man vector icon ppt powerpoint presentation files pdf. This is a three stage process. The stages in this process are dollar coins falling on man vector icon. This is a completely editable PowerPoint presentation and is available for immediate download. Download now and impress your audience.
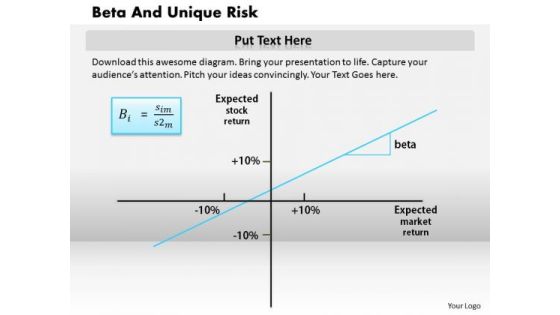
Business Framework Beta And Unique Risk PowerPoint Presentation 2
Define the concept of calculating risk of market with this power point diagram slide. This slide contains the graphic of X-Y chart with four different sections. Define the price and finance risk with beta factor, define this factor in your financial presentation and display the clear picture of risk.

Vat Marketing Cubes PowerPoint Templates And PowerPoint Themes 1012
The above template displays a diagram of 3d vat cube blocks. This image represents the concept of income tax. It is a useful captivating tool concieved to enable you to define your message in your Business and Financial PPT presentations on comsumption tax. Deliver amazing presentations to mesmerize your audience.

Money Bills Race Business PowerPoint Templates And PowerPoint Themes 1012
The above template displays a diagram of a money bills. This image represent the concept of financial bill. It is a useful captivating tool concieved to enable you to define your message in your Business PPT presentations. Our PPT images are so ideally designed that it reveals the very basis of our PPT template to make your clients understand.

Save Money For Future Finance PowerPoint Templates And PowerPoint Themes 1012
Deliver amazing Presentations with our above template which consists an image of piggy bank with dollar note. This image represents the concept of saving money for future use. Adjust the above image in your PPT presentations to visually support your content in your Business and Financial PPT slideshows income, wealth and investment. Deliver amazing presentations to mesmerize your audience.
