Financial

Critical Areas Ppt PowerPoint Presentation Images
This is a critical areas ppt powerpoint presentation images. This is a three stage process. The stages in this process are financial management, management development, business development.

Meet Our Team Ppt PowerPoint Presentation Diagrams
This is a meet our team ppt powerpoint presentation diagrams. This is a four stage process. The stages in this process are ceo, designer, manager, financial advisor.

Identify Csr Leaders Ppt PowerPoint Presentation Pictures
This is a identify csr leaders ppt powerpoint presentation pictures. This is a four stage process. The stages in this process are Ceo, financial advisor, manager, designer.

Meet Our Awesome Team Ppt PowerPoint Presentation Guide
This is a meet our awesome team ppt powerpoint presentation guide. This is a four stage process. The stages in this process are ceo, designer, manager, financial advisor.

Critical Areas Ppt PowerPoint Presentation Design Ideas
This is a critical areas ppt powerpoint presentation design ideas. This is a three stage process. The stages in this process are management development, business development, financial management.

Critical Areas Ppt PowerPoint Presentation Good
This is a critical areas ppt powerpoint presentation good. This is a three stage process. The stages in this process are management development, financial management, business development.

Client Testimonials Ppt PowerPoint Presentation Gallery
This is a client testimonials ppt powerpoint presentation gallery. This is a two stage process. The stages in this process are ceo, financial advisor.
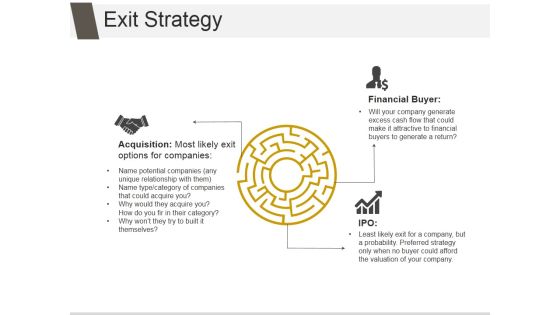
Exit Strategy Ppt PowerPoint Presentation Ideas
This is a exit strategy ppt powerpoint presentation ideas. This is a three stage process. The stages in this process are acquisition, financial buyer, ipo.

Meat Our Team Ppt PowerPoint Presentation Microsoft
This is a meat our team ppt powerpoint presentation microsoft. This is a two stage process. The stages in this process are ceo, financial advisor.

Meet Our Brilliant Team Ppt PowerPoint Presentation Design Templates
This is a meet our brilliant team ppt powerpoint presentation design templates. This is a three stage process. The stages in this process are financial advisor, ceo, manager.

Area Chart Ppt PowerPoint Presentation Samples
This is a area chart ppt powerpoint presentation samples. This is a two stage process. The stages in this process are financial year, sales in percentage, jan, feb.

Exit Strategy Ppt PowerPoint Presentation Slide Download
This is a exit strategy ppt powerpoint presentation slide download. This is a two stage process. The stages in this process are exit, acquisition, start, financial buyer.

My Mission Ppt PowerPoint Presentation Example 2015
This is a my mission ppt powerpoint presentation example 2015. This is a two stage process. The stages in this process are organizational plan, financial plan.
My Mission Ppt PowerPoint Presentation Templates
This is a my mission ppt powerpoint presentation templates. This is a two stage process. The stages in this process are financial plan, organizational plan.
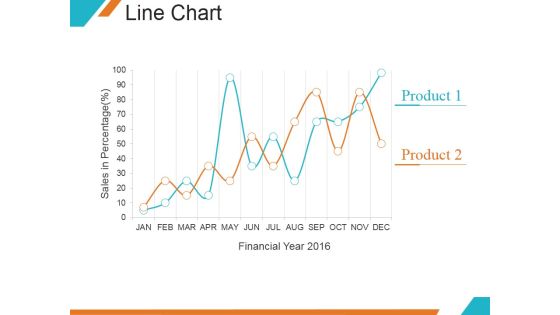
Line Chart Ppt PowerPoint Presentation Samples
This is a line chart ppt powerpoint presentation samples. This is a two stage process. The stages in this process are financial year, product, growth, marketing.

My Mission Ppt PowerPoint Presentation Ideas Aids
This is a my mission ppt powerpoint presentation ideas aids. This is a two stage process. The stages in this process are my mission, organizational plan, financial plan.

Area Chart Ppt PowerPoint Presentation Summary Example
This is a area chart ppt powerpoint presentation summary example. This is a two stage process. The stages in this process are financial year, in percentage, product.

Bar Graph Ppt PowerPoint Presentation Pictures Display
This is a bar graph ppt powerpoint presentation pictures display. This is a one stage process. The stages in this process are sales in percentage, financial year.

Our Team Ppt PowerPoint Presentation File Mockup
This is a our team ppt powerpoint presentation file mockup. This is a four stage process. The stages in this process are ceo, designer, financial advisor, manager.

Our Team Ppt PowerPoint Presentation Infographics Ideas
This is a our team ppt powerpoint presentation infographics ideas. This is a three stage process. The stages in this process are ceo director, graphic designer, financial advisor.

Exit Strategy Ppt PowerPoint Presentation Portfolio Shapes
This is a exit strategy ppt powerpoint presentation portfolio shapes. This is a two stage process. The stages in this process are acquisition, financial buyer, ipo, start, end.
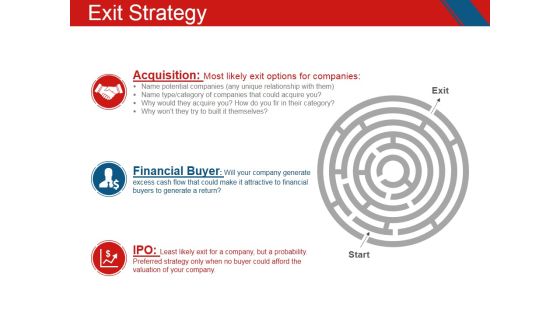
Exit Strategy Ppt PowerPoint Presentation Graphics
This is a exit strategy ppt powerpoint presentation graphics. This is a three stage process. The stages in this process are acquisition, financial buyer, ipo.
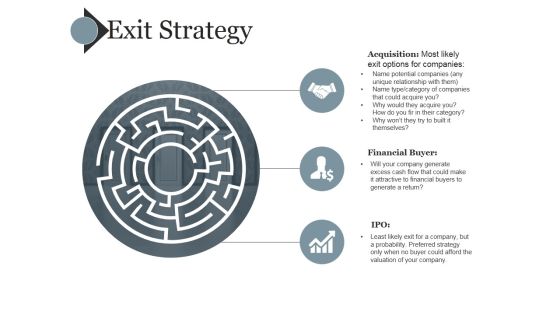
Exit Strategy Ppt PowerPoint Presentation Summary Graphics Download
This is a exit strategy ppt powerpoint presentation summary graphics download. This is a three stage process. The stages in this process are acquisition, financial buyer, ipo.

Client Testimonials Ppt PowerPoint Presentation Inspiration Ideas
This is a client testimonials ppt powerpoint presentation inspiration ideas. This is a two stage process. The stages in this process are ceo, financial advisor.
Exit Strategy Ppt PowerPoint Presentation Icon Clipart Images
This is a exit strategy ppt powerpoint presentation icon clipart images. This is a three stage process. The stages in this process are acquisition, financial buyer, ipo.

Area Chart Ppt Powerpoint Presentation Ideas Templates
This is a area chart ppt powerpoint presentation ideas templates. This is a two stage process. The stages in this process are product, financial year, in percentage, graph.
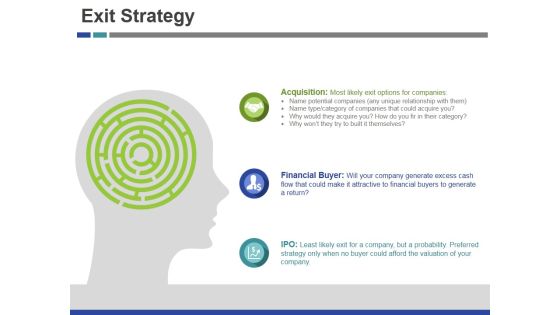
Exit Strategy Ppt PowerPoint Presentation Professional Graphics Pictures
This is a exit strategy ppt powerpoint presentation professional graphics pictures. This is a three stage process. The stages in this process are acquisition, financial buyer, ipo, maze.

Line Chart Ppt PowerPoint Presentation Pictures Maker
This is a line chart ppt powerpoint presentation pictures maker. This is a two stage process. The stages in this process are financial years, product, growth, success.
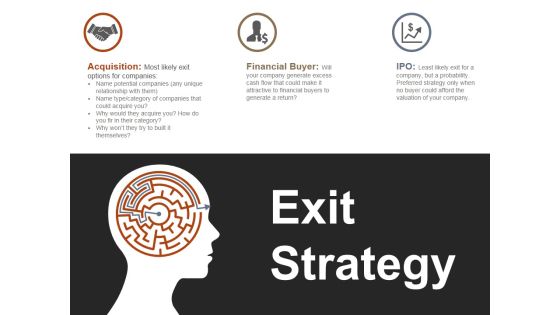
Exit Strategy Ppt PowerPoint Presentation Infographics Gridlines
This is a exit strategy ppt powerpoint presentation infographics gridlines. This is a one stage process. The stages in this process are acquisition, financial buyer, ipo.

Exit Strategy Ppt PowerPoint Presentation Summary Information
This is a exit strategy ppt powerpoint presentation summary information. This is a two stage process. The stages in this process are acquisition, financial buyer, ipo.

About Us Ppt PowerPoint Presentation Ideas Graphic Images
This is a about us ppt powerpoint presentation ideas graphic images. This is a three stage process. The stages in this process are financial advisor, graphic designer, ceo.

Critical Areas Ppt PowerPoint Presentation Summary Images
This is a critical areas ppt powerpoint presentation summary images. This is a three stage process. The stages in this process are business development, financial management.
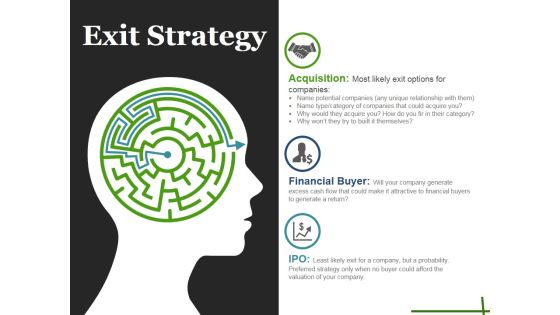
Exit Strategy Ppt PowerPoint Presentation Slides Maker
This is a exit strategy ppt powerpoint presentation slides maker. This is a three stage process. The stages in this process are acquisition, financial buyer, ipo.
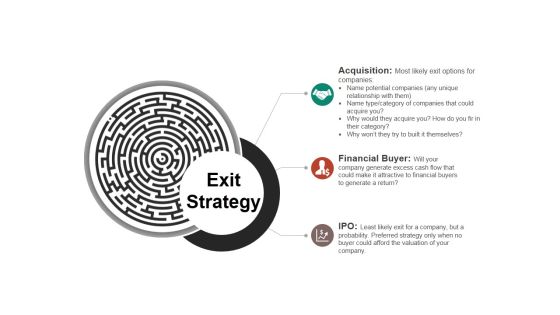
Exit Strategy Ppt PowerPoint Presentation Ideas Slides
This is a exit strategy ppt powerpoint presentation ideas slides. This is a three stage process. The stages in this process are acquisition, financial buyer, ipo.
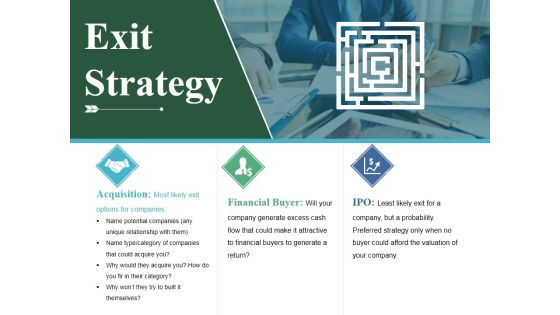
Exit Strategy Ppt PowerPoint Presentation Gallery Template
This is a exit strategy ppt powerpoint presentation gallery template. This is a three stage process. The stages in this process are acquisition, financial buyer, ipo, exit strategy.
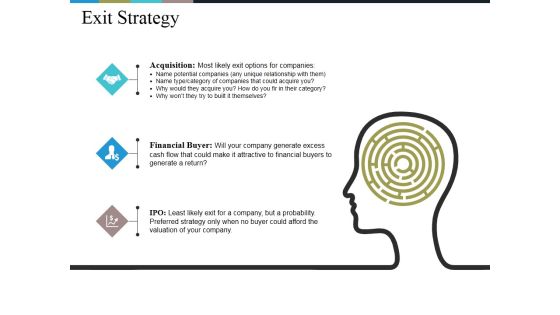
Exit Strategy Ppt PowerPoint Presentation Good
This is a exit strategy ppt powerpoint presentation good. This is a three stage process. The stages in this process are acquisition, financial buyer, ipo, maze, business.

Our Team Ppt PowerPoint Presentation File Vector
This is a our team ppt powerpoint presentation file vector. This is a four stage process. The stages in this process are ceo, designer, manager, financial advisor.

Area Chart Ppt PowerPoint Presentation Outline Objects
This is a area chart ppt powerpoint presentation outline objects. This is a two stage process. The stages in this process are product, sales in percentage, financial year.

Exit Strategy Ppt PowerPoint Presentation Outline Infographics
This is a exit strategy ppt powerpoint presentation outline infographics. This is a one stage process. The stages in this process are acquisition, financial buyer, ipo.

Exit Strategy Ppt PowerPoint Presentation File Ideas
This is a exit strategy ppt powerpoint presentation file ideas. This is a three stage process. The stages in this process are acquisition, financial buyer, ipo, business, marketing.

Exit Strategy Ppt PowerPoint Presentation Slide
This is a exit strategy ppt powerpoint presentation slide. This is a three stage process. The stages in this process are acquisition, financial buyer, ipo.
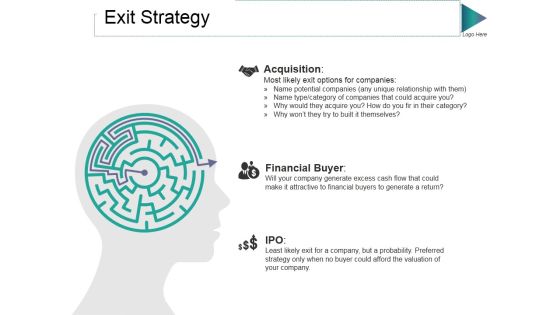
Exit Strategy Ppt PowerPoint Presentation Styles Information
This is a exit strategy ppt powerpoint presentation styles information. This is a one stage process. The stages in this process are acquisition, financial buyer, ipo.
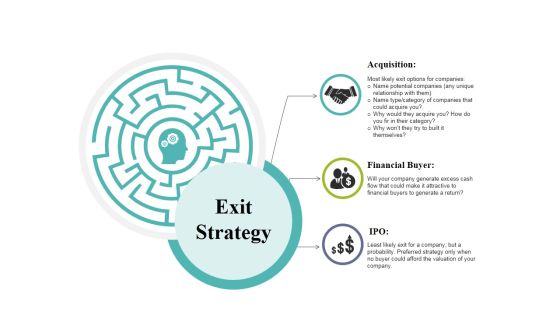
Exit Strategy Ppt PowerPoint Presentation File Templates
This is a exit strategy ppt powerpoint presentation file templates. This is a three stage process. The stages in this process are acquisition, financial buyer, ipo, exit strategy.

Exit Strategy Ppt PowerPoint Presentation Infographics Graphic Images
This is a exit strategy ppt powerpoint presentation infographics graphic images. This is a three stage process. The stages in this process are acquisition, financial buyer, ipo.

Our Team Ppt PowerPoint Presentation Layouts Deck
This is a our team ppt powerpoint presentation layouts deck. This is a three stage process. The stages in this process are marketing manager, financial manager, product manager.

Exit Strategy Ppt PowerPoint Presentation Ideas Grid
This is a exit strategy ppt powerpoint presentation ideas grid. This is a three stage process. The stages in this process are financial buyer, ipo, maze, problem, solution.

Column Chart Ppt PowerPoint Presentation Professional Aids
This is a column chart ppt powerpoint presentation professional aids. This is a two stage process. The stages in this process are product, sales in percentage, financial years.

Line Chart Ppt PowerPoint Presentation Pictures Layout
This is a line chart ppt powerpoint presentation pictures layout. This is a two stage process. The stages in this process are product, financial years, sales in percentage.
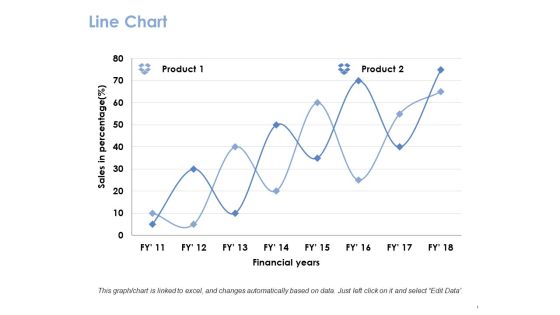
Line Chart Ppt PowerPoint Presentation Gallery Guide
This is a line chart ppt powerpoint presentation gallery guide. This is a two stage process. The stages in this process are product, financial years, sales in percentage.

Area Chart Ppt PowerPoint Presentation Styles Brochure
This is a area chart ppt powerpoint presentation styles brochure. This is a two stage process. The stages in this process are product, financial years, in percentage.

Line Chart Ppt PowerPoint Presentation Gallery Example Introduction
This is a line chart ppt powerpoint presentation portfolio shapes. This is a two stage process. The stages in this process are product, financial years, line chart.

Area Graph Ppt PowerPoint Presentation Slides Ideas
This is a area graph ppt powerpoint presentation slides ideas. This is a two stage process. The stages in this process are sales in percentage, financial year, product.

Bar Graph Ppt PowerPoint Presentation Inspiration Slides
This is a bar graph ppt powerpoint presentation inspiration slides. This is a six stage process. The stages in this process are sales in percentage, financial year, product.

Bar Graph Ppt PowerPoint Presentation Infographics Templates
This is a bar graph ppt powerpoint presentation infographics templates. This is a two stage process. The stages in this process are product, financial years, sales in percentage.
Line Chart Ppt PowerPoint Presentation Icon Inspiration
This is a line chart ppt powerpoint presentation icon inspiration. This is a two stage process. The stages in this process are product, financial years, sales in percentage.
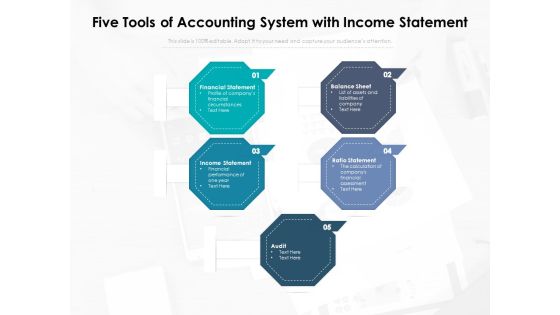
Five Tools Of Accounting System With Income Statement Ppt PowerPoint Presentation Infographic Template Rules PDF
Presenting this set of slides with name five tools of accounting system with income statement ppt powerpoint presentation infographic template rules pdf. This is a five stage process. The stages in this process are financial statement, profile of companys financial, circumstances, balance sheet, list of assets and liabilities of company, income statement, financial performance of one year, ratio statement, the calculation of companys financial assessment, audit. This is a completely editable PowerPoint presentation and is available for immediate download. Download now and impress your audience.
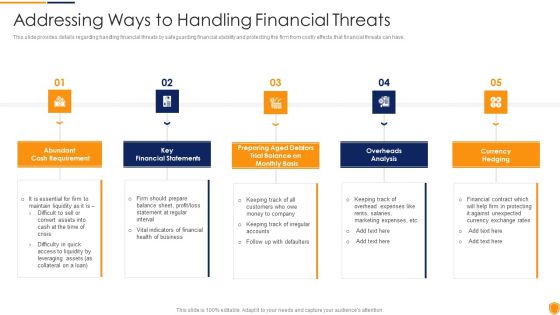
Mitigating Cybersecurity Threats And Vulnerabilities Addressing Ways To Handling Professional PDF
This slide provides details regarding handling financial threats by safeguarding financial stability and protecting the firm from costly effects that financial threats can have. Presenting mitigating cybersecurity threats and vulnerabilities addressing ways to handling professional pdf to provide visual cues and insights. Share and navigate important information on five stages that need your due attention. This template can be used to pitch topics like cash requirement, key financial statements, overheads analysis, currency hedging. In addtion, this PPT design contains high resolution images, graphics, etc, that are easily editable and available for immediate download.

Effective Remuneration Management Talent Acquisition Retention Categories Of Incentives Compensation Mockup PDF
The slide shows the types and categories of incentives in compensation management system i.e. financial incentives and non-financial incentives Presenting effective remuneration management talent acquisition retention categories of incentives compensation mockup pdf to provide visual cues and insights. Share and navigate important information on two stages that need your due attention. This template can be used to pitch topics like financial incentives, non financial incentives, perquisites, retirement benefits. In addtion, this PPT design contains high resolution images, graphics, etc, that are easily editable and available for immediate download.

Applications Of Forensic Accounting And Forensic Accounting Summary PDF
This slide covers use of forensic accounting and investigation for multiple financial crimes. It includes crimes such as bribery, conflict of interest, asset misappropriation and financial statement fraud, omission of transactions, fraudulent financial reporting, etc. Persuade your audience using this Applications Of Forensic Accounting And Forensic Accounting Summary PDF. This PPT design covers three stages, thus making it a great tool to use. It also caters to a variety of topics including Asset Misappropriation, Corruption, Financial Statement Fraud. Download this PPT design now to present a convincing pitch that not only emphasizes the topic but also showcases your presentation skills.

Organizational Strategy Execution And Planning Map Sample PDF
The slide showcases a business strategy map measuring the financial and non-financial growth useful for keeping track of the success and execution of a strategy with traditional 4 layers of business strategy. It covers perspectives like financial performance, customer marketing growth, process excellence, people and learning. Persuade your audience using this Organizational Strategy Execution And Planning Map Sample PDF. This PPT design covers four stages, thus making it a great tool to use. It also caters to a variety of topics including Financial Performance, Customer Marketing Growth, Process Excellence. Download this PPT design now to present a convincing pitch that not only emphasizes the topic but also showcases your presentation skills.

8 Week Strategic Plan Roadmap For Email Marketing Campaign Graphics PDF
This slide signifies the ten weeks timeline for effective financial planning. It covers stages like define financial objectives, gathering financial information, analysis, development and implementation Persuade your audience using this 8 Week Strategic Plan Roadmap For Email Marketing Campaign Graphics PDF. This PPT design covers six stages, thus making it a great tool to use. It also caters to a variety of topics including Financial Objectives, Analysis, Development. Download this PPT design now to present a convincing pitch that not only emphasizes the topic but also showcases your presentation skills.
Economic Planning Money Bills And Coins Vector Icon Ppt PowerPoint Presentation Slides Graphics Tutorials
Presenting this set of slides with name economic planning money bills and coins vector icon ppt powerpoint presentation slides graphics tutorials. This is a one stage process. The stages in this process are financial service, economic planning, financial institution. This is a completely editable PowerPoint presentation and is available for immediate download. Download now and impress your audience.

Image Of Dollar Note And Coins For Money Management Ppt PowerPoint Presentation Outline Visual Aids
Presenting this set of slides with name image of dollar note and coins for money management ppt powerpoint presentation outline visual aids. This is a three stage process. The stages in this process are financial goal, business achievement arrow, financial business objectives. This is a completely editable PowerPoint presentation and is available for immediate download. Download now and impress your audience.

Image Of Money Saving With Piggy Bank Ppt PowerPoint Presentation Portfolio Summary
Presenting this set of slides with name image of money saving with piggy bank ppt powerpoint presentation portfolio summary. This is a one stage process. The stages in this process are financial goal, business achievement arrow, financial business objectives. This is a completely editable PowerPoint presentation and is available for immediate download. Download now and impress your audience.
Person Running Towards Dollar Symbol Ppt PowerPoint Presentation Outline Elements
Presenting this set of slides with name person running towards dollar symbol ppt powerpoint presentation outline elements. This is a one stage process. The stages in this process are financial goal, business achievement arrow, financial business objectives. This is a completely editable PowerPoint presentation and is available for immediate download. Download now and impress your audience.
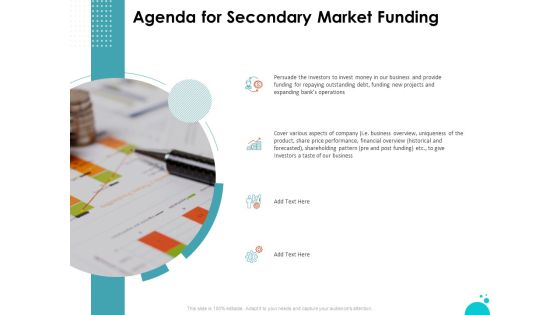
Investment Pitch For Aftermarket Investment Pitch For Aftermarket Agenda For Secondary Market Funding Summary
Presenting this set of slides with name investment pitch for aftermarket investment pitch for aftermarket agenda for secondary market funding summary. This is a four stage process. The stages in this process are performance, financial overview, expanding banks operations, financial overview. This is a completely editable PowerPoint presentation and is available for immediate download. Download now and impress your audience.

Market Capitalization And Revenue Example Powerpoint Guide
This is a market capitalization and revenue example powerpoint guide. This is a six stage process. The stages in this process are raising of sponsor capital, portfolio management, financial engineering, refinancing and sales, financial engineering, refinancing and sales, monetization secondary, market trades, establishing policy and legislative frameworks.

American Dollar Cash Business PowerPoint Templates And PowerPoint Themes 1012
Heighten the anticipation of your audience with this slide listing American dollar. This image signifies the concept of money, foreign currency. This image has been conceived to enable you to emphatically communicate your ideas in your Financial PPT presentations on American financial system, investment, stock market investment, international transactions etc. Add personality to your presentations with our stunning template.

Profitability Goals Increased Revenue And Decreased Costs Ppt PowerPoint Presentation Summary Design Inspiration
Presenting this set of slides with name profitability goals increased revenue and decreased costs ppt powerpoint presentation summary design inspiration. This is a five stage process. The stages in this process are financial targets, financial goals, growth profitability. This is a completely editable PowerPoint presentation and is available for immediate download. Download now and impress your audience.

Economic Services For Clients Banking And Wealth Management Ppt PowerPoint Presentation Inspiration Example File
Presenting this set of slides with name economic services for clients banking and wealth management ppt powerpoint presentation inspiration example file. This is a one stage process. The stages in this process are financial service, economic planning, financial institution. This is a completely editable PowerPoint presentation and is available for immediate download. Download now and impress your audience.

Money Management Pile Of Coins Image Ppt PowerPoint Presentation Ideas
Presenting this set of slides with name money management pile of coins image ppt powerpoint presentation ideas. This is a one stage process. The stages in this process are financial strategy, business financial trend, business strategy. This is a completely editable PowerPoint presentation and is available for immediate download. Download now and impress your audience.

Methods Of Raising Equity Capital Ppt PowerPoint Presentation Infographics Images
Presenting this set of slides with name methods of raising equity capital ppt powerpoint presentation infographics images. This is a seven stage process. The stages in this process are financial strategy, business financial trend, business strategy. This is a completely editable PowerPoint presentation and is available for immediate download. Download now and impress your audience.

Management Between Strategy And Finance Diagram Ppt Slides
This is a management between strategy and finance diagram ppt slides. This is a ten stage process. The stages in this process are key financial analysis, business plan development, global expansion, foreign currency and treasury management, acquisitions, company secretarial, equity fundraising, system implementation, annual budgeting and forecasting, grant funding, business plan development, strategic financial management.\n\n\n\n\n\n\n \n\n\n\n\n\n\n\n\n\n\n\n\n\n\n\n\n\n\n\n\n\n\n\n\n\n

Manager Surplus Lines Section Ppt Powerpoint Shapes
This is a manager surplus lines section ppt powerpoint shapes. This is a eight stage process. The stages in this process are manager financial analysis section, director insurance market regulation division, chief examiner market conduct section, manager surplus lines section, chief financial administrator, director division of finance, manager support services section, budget offers.

Accounting Team Roles And Responsibilities For Enterprise Formats PDF
Presenting accounting team roles and responsibilities for enterprise formats pdf to dispense important information. This template comprises five stages. It also presents valuable insights into the topics including financial statement, managing payables, financial budgeting. This is a completely customizable PowerPoint theme that can be put to use immediately. So, download it and address the topic impactfully.

Product Portfolio Analysis Tools Ppt Powerpoint Slides
This is a product portfolio analysis tools ppt powerpoint slides. This is a seven stage process. The stages in this process are financial economic models, probabilistic financial models, mathematical optimization procedures, mapping approaches bubble diagrams, checklist scoring models, behavioral approaches, decision support systems dss.\n\n\n\n\n\n\n\n\n\n\n \n

Banking Services Saving Accounts Business Loans Ppt PowerPoint Presentation Styles Design Inspiration
Presenting this set of slides with name banking services saving accounts business loans ppt powerpoint presentation styles design inspiration. This is a four stage process. The stages in this process are financial service, economic planning, financial institution. This is a completely editable PowerPoint presentation and is available for immediate download. Download now and impress your audience.

Stock Photo 3d Globe With Chains Global Safety PowerPoint Slide
Display the global business concept in any business presentation with the help of this unique image. This image contains the graphic of 3d globe. This image shows the financial reporting for global business. Use this image in global financial topic related presentation.

Stock Photo Path To Target Dollar Symbol PowerPoint Slide
This image slide displays graphic of maze with arrow leading to dollar symbol. This image slide displays path to financial success. Use this image slide, in your presentations to express views on financial goals, targets, achievements and success. This image may also be used to depict strategic business management. This image slide will enhance the quality of your presentations.

Stock Photo Path To Target Euro Currency Symbol PowerPoint Slide
This image slide displays graphic of maze with arrow leading to euro symbol. This image slide displays path to financial success. Use this image slide, in your presentations to express views on financial goals, targets, achievements and success. This image may also be used to depict strategic business management. This image slide will enhance the quality of your presentations.
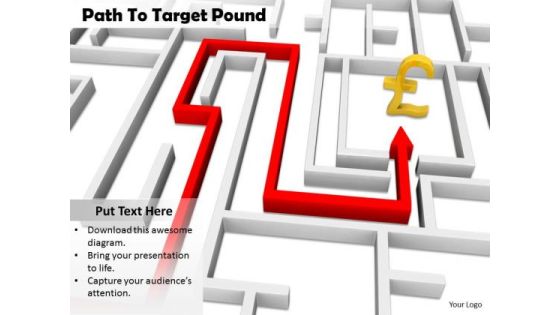
Stock Photo Path To Target Pound Symbol PowerPoint Slide
This image slide displays graphic of maze with arrow leading to pound symbol. This image slide displays path to financial success. Use this image slide, in your presentations to express views on financial goals, targets, achievements and success. This image may also be used to depict strategic business management. This image slide will enhance the quality of your presentations.

Business Diagram 3d Pie Chart One Blue Piece Presentation Template
This business plan power point diagram template has been designed with graphic of 3d pyramid and five stages. Explain the concept of percentage and finance related topics in your financial presentations. Use this diagram template and display linear sequential flow of any financial process.

Business Framework Shareholder Value PowerPoint Presentation
Display the shareholder value and financial perspectives in your financial presentation by using this exclusive PPT. this business framework PPT contains the graphic of sequential network of shareholders. Use this PPT and build exclusive presentation for share value and customer perspective related topics.

Three Staged Business Roadmap Diagram Powerpoint Slides
This infographic timeline template can be used for multiple purposes including financial planning, new milestones and tasks. It contains five staged timeline diagram. This PPT slide may be helpful to display financial strategy timeline. Download this PowerPoint timeline template to make impressive presentations.

Business Milestones For Growth And Progress Powerpoint Slides
This timeline slide design can be used for business milestones, growth and progress. It contains five linear steps with financial icons. This timeline template can be used in presentations where you need to display a roadmap or it may be used for financial target analysis.

Corporate Finance Management Diagram Powerpoint Presentation
This is a corporate finance management diagram powerpoint presentation. This is a eight stage process. The stages in this process are corporate finance management system, general ledger, payroll, accounts payable, financial analytics, accounts receivable, asset lifecycle management, financial planning, governance risk compliance.

Management Buyout Strategy Sample Diagram Presentation Powerpoint
This is a management buyout strategy sample diagram presentation powerpoint. This is a three stage process. The stages in this process are target, venture capitalist, lenders, debit equity for purchase, cash flows, income, assets, equity stake, profit, debit repayment, debit financial, financial sponsor.\n\n\n\n\n\n\n\n
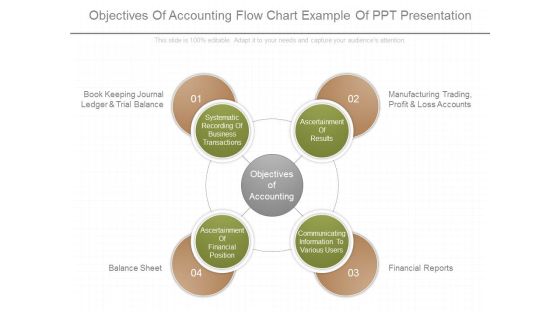
Objectives Of Accounting Flow Chart Example Of Ppt Presentation
This is a objectives of accounting flow chart example of ppt presentation. This is a four stage process. The stages in this process are book keeping journal ledger and trial balance, manufacturing trading profit and loss accounts, balance sheet, financial reports, systematic recording of business transactions, ascertainment of results, ascertainment of financial position, communicating information to various users, objectives of accounting.

Audit Cycle Customer Relationship Techniques Ppt Background
This is a audit cycle customer relationship techniques ppt background. This is a four stage process. The stages in this process are market overview, strategy, value creating, financial performance, continuance assessment, scoping, validating, audit comfort cycle, evaluating, understanding, substantive audit evidence, audit procedures financial statement.
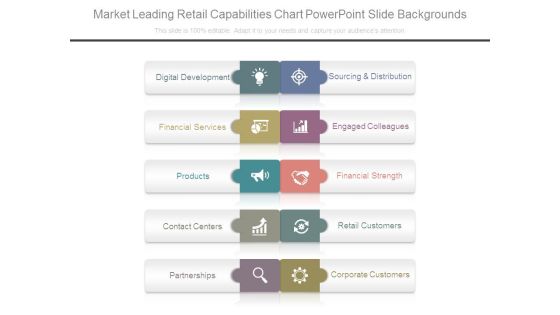
Market Leading Retail Capabilities Chart Powerpoint Slide Backgrounds
This is a market leading retail capabilities chart powerpoint slide backgrounds. This is a five stage process. The stages in this process are digital development, financial services, products, contact centers, partnerships, sourcing and distribution, engaged colleagues, financial strength, retail customers, corporate customers.

Cost Assessment Diagram Example Of Ppt
This is a cost assessment diagram example of ppt. This is a eight stage process. The stages in this process are define the scope of the decision or option, analyze financial performance, identify relevant costs and saving inventory, interpret the results make the decision, full cost assessment, total cost assessment, recognized contingent costs, direct and indirect financial costs.

Business Case Development Tools Presentation Images
This is a business case development tools presentation images. This is a nine stage process. The stages in this process are user guide, business profile, it spending tco, initiative costs, initiative benefits, financial analysis, non financial kpls optional, business case reports, initiative descriptions reference only.

Auditing Quality Ppt PowerPoint Presentation Infographic Template
This is a auditing quality ppt powerpoint presentation infographic template. This is a three stage process. The stages in this process are contextual factors, business practices and commercial law, laws and regulations, relating to financial reporting, information system, corporate governance, audit regulation, broader cultural, ligation environment, attracting talent, financial reporting timetable.

10 Slides You Needs For Your Pitch Deck Ppt PowerPoint Presentation Gallery
This is a 10 slides you needs for your pitch deck ppt powerpoint presentation gallery. This is a ten stage process. The stages in this process are title, problem opportunity, value proposition, underlying magic, business model, go to market plan, competitive analysis, management team, financial projections, financial projections.

10 Slides You Need For Your Pitch Deck Ppt PowerPoint Presentation Samples
This is a 10 slides you need for your pitch deck ppt powerpoint presentation samples. This is a ten stage process. The stages in this process are title, problem opportunity, value proposition, underlying magic, business model, go to market plan, competitive analysis, management team, financial projections, financial projections.

Audit Quality Ppt PowerPoint Presentation Infographic Template
This is a audit quality ppt powerpoint presentation infographic template. This is a eleven stage process. The stages in this process are financial reporting timetable, contextual factors, business practices and law, laws and regulations, financial reporting framework, information system, broader cultural, audit, audit regulation.

Slides You Need For Your Pitch Deck Ppt PowerPoint Presentation Ideas
This is a slides you need for your pitch deck ppt powerpoint presentation ideas. This is a ten stage process. The stages in this process are business model, value proposition, title, competitive analysis, financial projections, problem opportunity, underlying magic, go to market plan, management team, financial projections.

Risk Associated With Strategic Alliances Ppt PowerPoint Presentation Portfolio Outfit
This is a risk associated with strategic alliances ppt powerpoint presentation portfolio outfit. This is a eight stage process. The stages in this process are input supply risk, surge capacity risk, quality performance risk, cost renegotiation risk, coordination risk, financial viability risk, contribution valuation risk, financial commitment risk.

Business Strategy Of Financing Sources Ppt PowerPoint Presentation Summary Background Images
Presenting this set of slides with name business strategy of financing sources ppt powerpoint presentation summary background images. This is a four stage process. The stages in this process are financial strategy, business financial trend, business strategy. This is a completely editable PowerPoint presentation and is available for immediate download. Download now and impress your audience.
Finance Growth Plan Vector Icon Ppt PowerPoint Presentation Model Layouts
Presenting this set of slides with name finance growth plan vector icon ppt powerpoint presentation model layouts. This is a one stage process. The stages in this process are financial strategy, business financial trend, business strategy. This is a completely editable PowerPoint presentation and is available for immediate download. Download now and impress your audience.

Picture Of Chess Game For Strategic Planning Ppt PowerPoint Presentation Summary Deck
Presenting this set of slides with name picture of chess game for strategic planning ppt powerpoint presentation summary deck. This is a seven stage process. The stages in this process are financial strategy, business financial trend, business strategy. This is a completely editable PowerPoint presentation and is available for immediate download. Download now and impress your audience.

Bar Graph For Four Years Business Result Analysis Ppt PowerPoint Presentation Icon Show
Presenting this set of slides with name bar graph for four years business result analysis ppt powerpoint presentation icon show. The topics discussed in these slides are financial targets, financial goals, growth profitability. This is a completely editable PowerPoint presentation and is available for immediate download. Download now and impress your audience.
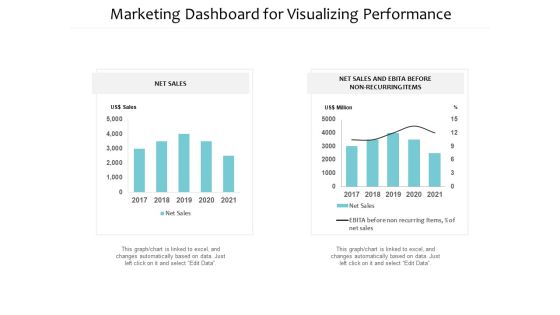
Marketing Dashboard For Visualizing Performance Ppt PowerPoint Presentation Summary Slide Download
Presenting this set of slides with name marketing dashboard for visualizing performance ppt powerpoint presentation summary slide download. The topics discussed in these slides are financial targets, financial goals, growth profitability. This is a completely editable PowerPoint presentation and is available for immediate download. Download now and impress your audience.

Business Achievement Arrow On Dart Board Ppt PowerPoint Presentation Infographics Professional
Presenting this set of slides with name business achievement arrow on dart board ppt powerpoint presentation infographics professional. This is a one stage process. The stages in this process are financial goal, business achievement arrow, financial business objectives. This is a completely editable PowerPoint presentation and is available for immediate download. Download now and impress your audience.

Target Achievement Arrow Hitting On Dollar Sign Ppt PowerPoint Presentation File Rules
Presenting this set of slides with name target achievement arrow hitting on dollar sign ppt powerpoint presentation file rules. This is a five stage process. The stages in this process are financial goal, business achievement arrow, financial business objectives. This is a completely editable PowerPoint presentation and is available for immediate download. Download now and impress your audience.

Quarterly Workstream Planning Timeline Report Ppt PowerPoint Presentation Infographic Template Microsoft PDF
Presenting this set of slides with name quarterly workstream planning timeline report ppt powerpoint presentation infographic template microsoft pdf. The topics discussed in these slides are financial year 2019, financial year 2020, workstream, quarter. This is a completely editable PowerPoint presentation and is available for immediate download. Download now and impress your audience.

Cyber Security Implementation Framework Present Concerns Impeding Cybersecurity Clipart PDF
Presenting this set of slides with name cyber security implementation framework present concerns impeding cybersecurity clipart pdf. The topics discussed in these slides are data breaches and records exposed, reported financial losses due to increase cybercrimes, financial losses, cybercrimes incidents. This is a completely editable PowerPoint presentation and is available for immediate download. Download now and impress your audience.
Power Management System And Technology Motivate Ppt PowerPoint Presentation Slides Icon PDF
Presenting this set of slides with name power management system and technology motivate ppt powerpoint presentation slides icon pdf. This is a six stage process. The stages in this process are internal competition, recognition, financial bonus and prizes, environmental responsibility, financial responsibility, performance standards. This is a completely editable PowerPoint presentation and is available for immediate download. Download now and impress your audience.

Logistics Management Framework Performance Measures Sample PDF
Presenting logistics management framework performance measures sample pdf to provide visual cues and insights. Share and navigate important information on two stages that need your due attention. This template can be used to pitch topics like non financial measures, financial measures. In addtion, this PPT design contains high resolution images, graphics, etc, that are easily editable and available for immediate download.

Logistics Management Services Performance Measures Designs PDF
Presenting logistics management services performance measures designs pdf to provide visual cues and insights. Share and navigate important information on two stages that need your due attention. This template can be used to pitch topics like non financial measures, financial measures. In addtion, this PPT design contains high resolution images, graphics, etc, that are easily editable and available for immediate download.

SCM Growth Performance Measures Ppt Diagram Templates PDF
Presenting scm growth performance measures ppt diagram templates pdf to provide visual cues and insights. Share and navigate important information on two stages that need your due attention. This template can be used to pitch topics like non financial measures, financial measures. In addtion, this PPT design contains high resolution images, graphics, etc, that are easily editable and available for immediate download.

Table Of Contents For Square Company Investor Pitch Deck Ppt Outline Graphic Images PDF
Deliver an awe inspiring pitch with this creative table of contents for square company investor pitch deck ppt outline graphic images pdf bundle. Topics like management team, analysis, financial assumptions, financial model can be discussed with this completely editable template. It is available for immediate download depending on the needs and requirements of the user.
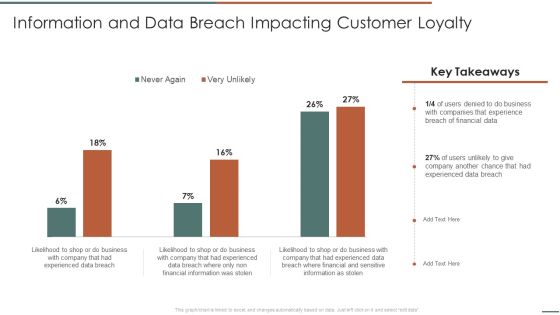
Information Security Risk Evaluation Information And Data Breach Impacting Customer Loyalty Structure PDF
Deliver an awe inspiring pitch with this creative Information Security Risk Evaluation Information And Data Breach Impacting Customer Loyalty Structure PDF bundle. Topics like Companies Experience, Financial Information, Breach Of Financial can be discussed with this completely editable template. It is available for immediate download depending on the needs and requirements of the user.
Icon For Logistics Company Project Portfolio Scorecard Download PDF
Presenting Icon For Financial Project Portfolio Balanced Scorecard Introduction PDF to dispense important information. This template comprises four stages. It also presents valuable insights into the topics including Financial Project, Portfolio Balanced Scorecard. This is a completely customizable PowerPoint theme that can be put to use immediately. So, download it and address the topic impactfully.

Money Saving And Investment Ideas Powerpoint Slides
The above PPT template displays four financial icons. This diagram helps to exhibit money saving and investment ideas. Adjust the above diagram in your business presentations to visually support your content.

Bar Graph For Marketing Research Data Powerpoint Slides
This PowerPoint template has been designed with diagram of bar graph. This PPT slide can be used to prepare presentations for profit growth report and also for financial data analysis. You can download finance PowerPoint template to prepare awesome presentations.

Bar Graph For Marketing Research Process Powerpoint Slides
This PowerPoint template has been designed with diagram of bar graph. This PPT slide can be used to prepare presentations for profit growth report and also for financial data analysis. You can download finance PowerPoint template to prepare awesome presentations.

Circle Diagram For Business Marketing Mix Powerpoint Slides
This PowerPoint template has been designed with nine steps circle chart. This PPT slide can be used to prepare presentations for profit growth report and also for financial data analysis. You can download finance PowerPoint template to prepare awesome presentations.

Bar Graph With Five Icons Powerpoint Slides
This PowerPoint slide contains diagram bar graph with icons. This PPT slide helps to exhibit concepts of financial deal and planning. Use this business slide to make impressive presentations.

Circle Chart With Percentage Value Analysis Powerpoint Slides
This PowerPoint template has been designed with circular process diagram. This business diagram helps to exhibit financial process control and analysis. Use this diagram to visually support your content.
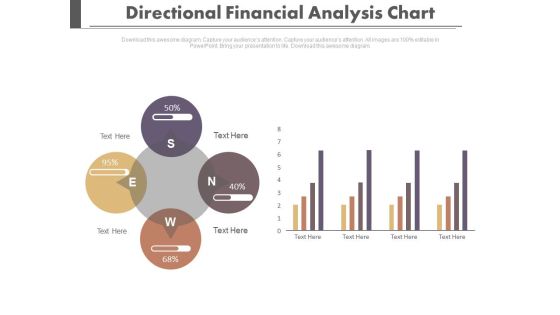
Four Directions Circular Analysis Chart Powerpoint Slides
Our professionally designed business diagram is as an effective tool for communicating business strategy. It contains four directional circular charts. Above slide is also suitable to display financial planning and strategy.

Four Options Circle Chart With Percentage Powerpoint Slides
This PowerPoint template has been designed with graphics of four options circle chart. This PowerPoint template may be used to display four steps of financial analysis. Prove the viability of your ideas using this impressive slide.

Triangle With Two Segments And Percentage Values Powerpoint Slides
This PowerPoint template contains graphics of triangle with two segments and percentage values. You may use this PPT slide for financial planning. The color coding of this template is specifically designed to highlight you points.
Four Points Diagram With Business Icons Powerpoint Slides
The above PowerPoint template displays graphics of four points diagram with business icons. This diagram has been professionally designed to display steps of financial planning. Capture the attention of your audience.
Market Trends Chart With Percentage And Icons Powerpoint Slides
This PowerPoint template has been designed with graphics of chart with percentage values and icons. This PowerPoint template may be used to market trends and financial analysis. Prove the viability of your ideas using this impressive slide.

Bar Chart Ppt PowerPoint Presentation Icon Demonstration
This is a bar chart ppt powerpoint presentation icon demonstration. This is a seven stage process. The stages in this process are product, sales in percentage, financial year, graph.

Bar Chart Ppt PowerPoint Presentation Inspiration Demonstration
This is a bar chart ppt powerpoint presentation inspiration demonstration. This is a two stage process. The stages in this process are bar chart, financial years, sales in percentage, product, finance.

Bar Chart Ppt PowerPoint Presentation Model Picture
This is a bar chart ppt powerpoint presentation model picture. This is a two stage process. The stages in this process are product, sales in percentage, financial years, bar chart.

Bar Chart Ppt PowerPoint Presentation Slides Example File
This is a bar chart ppt powerpoint presentation slides example file. This is a two stage process. The stages in this process are product, financial years, sales in percentage.
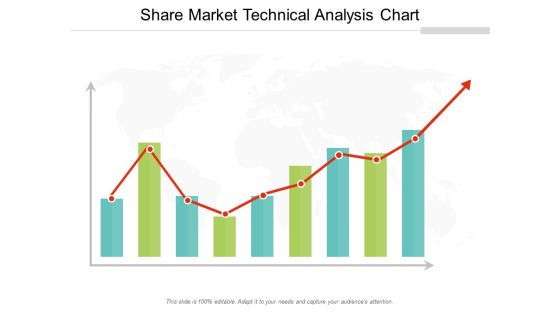
Share Market Technical Analysis Chart Ppt Powerpoint Presentation Professional Rules
This is a share market technical analysis chart ppt powerpoint presentation professional rules. This is a three stage process. The stages in this process are stock market, financial market, bull market.
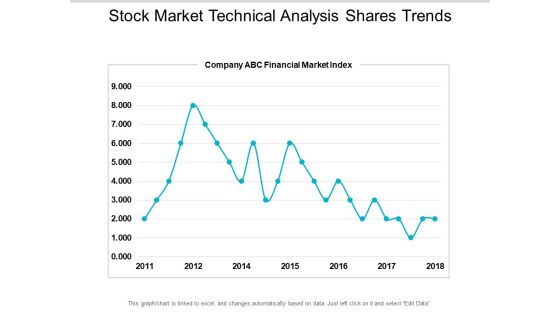
Stock Market Technical Analysis Shares Trends Ppt PowerPoint Presentation Portfolio Introduction
This is a stock market technical analysis shares trends ppt powerpoint presentation portfolio introduction. This is a seven stage process. The stages in this process are stock market, financial markets, bull market.

Hourglass With Yen Currency Symbol Powerpoint Templates
Create dynamic presentations with our professional template containing graphics of hourglass with yen currency symbol. This diagram is useful for time management and financial planning. Download this template to leave permanent impression on your audience.
Wealth Management Icon Ppt PowerPoint Presentation Styles Examples
This is a wealth management icon ppt powerpoint presentation styles examples. This is a four stage process. The stages in this process are financial capital, working capital management, companys managerial accounting.
Four Cubes For Fnancial Ratio Analysis Powerpoint Template
This business slide displays graphics of four cubes. This PPT slide has been designed to portray concept of financial ratio analysis. Download this PPT slide design to make interactive presentations.

Semicircle With Five Circles Of Percentage Values Powerpoint Template
This PowerPoint template has been designed with graphics of semicircle with five percentage values. This business design can be used for financial ratio analysis. Capture the attention of your audience with this slide.

Balloons Steps With Percentage Growth Values Powerpoint Slides
This PowerPoint template contains graphics of balloons steps with percentage growth values. You may download this slide to display strategy steps for financial growth. You can easily customize this template to make it more unique as per your need.
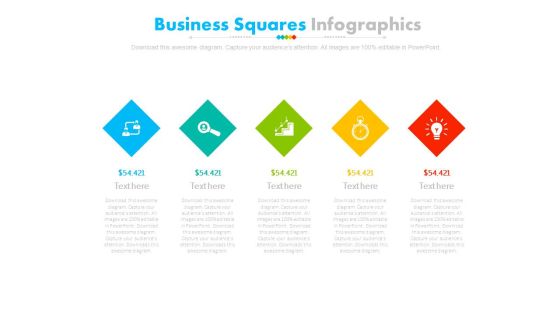
Five Steps Diamond Infographic Diagram Powerpoint Slides
This PowerPoint template has been designed with alphabet steps with icons. This PPT slide may be used to display financial strategy analysis. Make outstanding business presentation with this template.
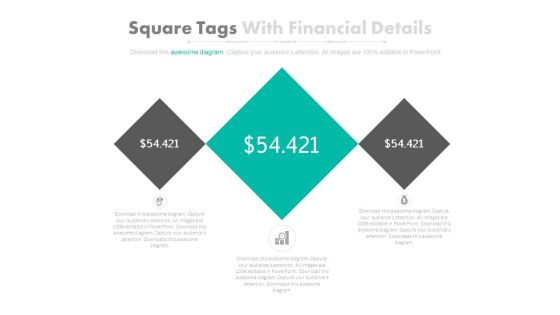
Three Square Tags With Dollars Value Powerpoint Slides
This PowerPoint template contains three square tags with dollar value. You may download this PPT slide design to display financial analysis. You can easily customize this template to make it more unique as per your need.
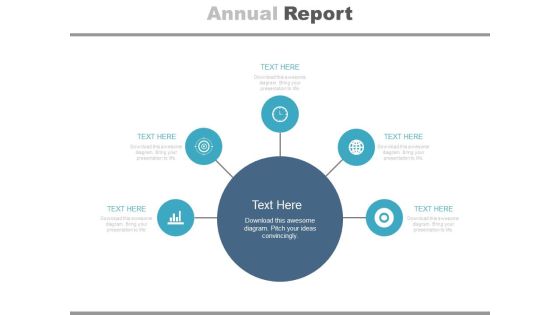
Diagram For Market Research Analysis Powerpoint Slides
This PowerPoint template has been designed with circular infographic diagram. It can be used to display steps for market research and also for financial data analysis. You can download finance PowerPoint template to prepare awesome presentations.
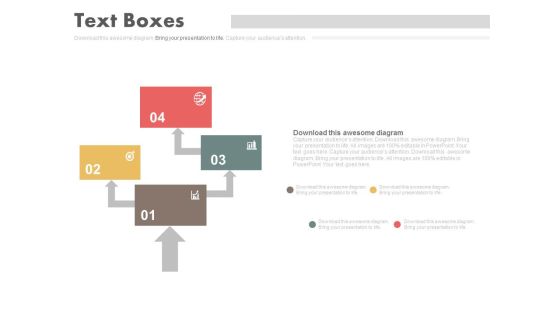
Four Steps Arrow Chart Design Powerpoint Slides
This PowerPoint template has been designed with four steps arrow chart. This PPT slide can be used to prepare presentations for marketing reports and also for financial data analysis. You can download finance PowerPoint template to prepare awesome presentations.
Linear Flow Of Steps With Icons Powerpoint Slides
This PowerPoint template has been designed linear infographic diagram. This PPT slide can be used to display flow of financial planning steps. You can download finance PowerPoint template to prepare awesome presentations.
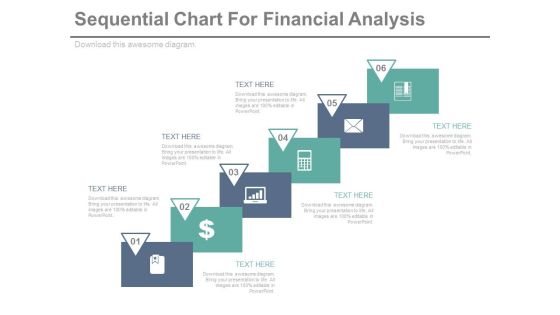
Sequential Steps Chart For Data Analysis Powerpoint Slides
This PowerPoint template has been designed sequential steps chart with icons. This PPT slide can be used to display corporate level financial strategy. You can download finance PowerPoint template to prepare awesome presentations.
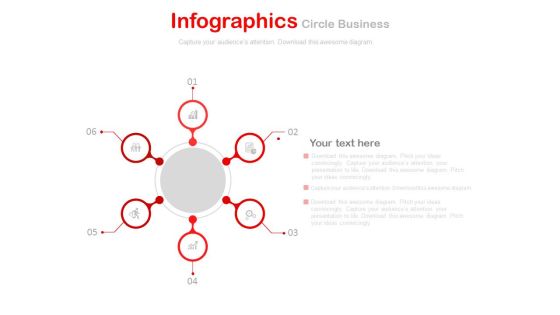
Six Staged Hub And Spokes Diagram Powerpoint Slides
This PowerPoint template has been designed with circular hub and spokes diagram. This PPT slide can be used to display cycle of financial steps. You can download finance PowerPoint template to prepare awesome presentations.

Three Tags With Magnifier For Competitive Advantages Powerpoint Slides
This PowerPoint template has been designed with diagram of three tags with magnifier. This PPT slide can be used to prepare presentations for financial planning. You can download finance PowerPoint template to prepare awesome presentations.

Strategic Planning Government Example Powerpoint Slides
This is a strategic planning government example powerpoint slides. This is a five stage process. The stages in this process are regularity compliance, business continuity, financial performance, risk management, operational improvement.
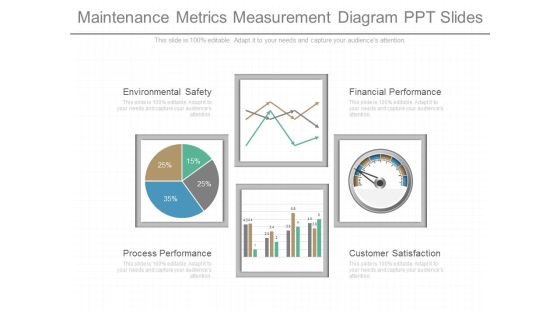
Maintenance Metrics Measurement Diagram Ppt Slides
This is a maintenance metrics measurement diagram ppt slides. This is a four stage process. The stages in this process are environmental safety, process performance, financial performance, customer satisfaction.
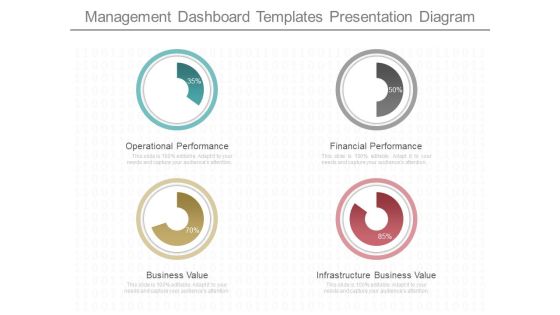
Management Dashboard Templates Presentation Diagram
This is a management dashboard templates presentation diagram. This is a four stage process. The stages in this process are operational performance, business value, financial performance, infrastructure business value.

Bar Chart Ppt PowerPoint Presentation Pictures Background Image
This is a bar chart ppt powerpoint presentation pictures background image. This is a seven stage process. The stages in this process are financial years, sales in percentage, graph, business.

Area Chart Ppt PowerPoint Presentation Layouts Graphics Example
This is a area chart ppt powerpoint presentation layouts graphics example. This is a two stage process. The stages in this process are sales in percentage, financial year, business, marketing, presentation.

Benefits Of Big Data Ppt PowerPoint Presentation Professional Slide Portrait
This is a benefits of big data ppt powerpoint presentation professional slide portrait. This is a four stage process. The stages in this process are increased efficiency, better business decision making, improved customer experience and engagement, achieved financial savings.

Bar Chart Ppt PowerPoint Presentation Outline Introduction
This is a bar chart ppt powerpoint presentation outline introduction. This is a one stage process. The stages in this process are sales in percentage, product, business, financial years, graph.

Clustered Column Ppt PowerPoint Presentation Ideas Graphic Tips
This is a clustered column ppt powerpoint presentation ideas graphic tips. This is a two stage process. The stages in this process are financial year, sales in percentage, product, graph, business.

Bar Chart Ppt PowerPoint Presentation Professional Graphics Download
This is a bar chart ppt powerpoint presentation professional graphics download. This is a seven stage process. The stages in this process are sales in percentage, financial years, chart, business.

Clustered Column Ppt PowerPoint Presentation Portfolio Smartart
This is a clustered column ppt powerpoint presentation portfolio smartart. This is a two stage process. The stages in this process are financial year, product, sales in percentage, finance, business, graph.

Bar Chart Ppt PowerPoint Presentation Styles Outfit
This is a bar chart ppt powerpoint presentation styles outfit. This is a Seven stage process. The stages in this process are sales in percentage, financial years, graph, business.

Clustered Column Ppt PowerPoint Presentation Pictures Mockup
This is a clustered column ppt powerpoint presentation pictures mockup. This is a two stage process. The stages in this process are product, sales in percentage, financial year, graph, business.
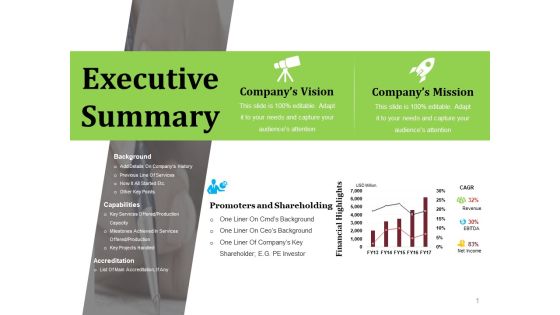
Executive Summary Ppt PowerPoint Presentation Ideas Professional
This is a executive summary ppt powerpoint presentation ideas professional. This is a two stage process. The stages in this process are company s vision, company s mission, promoters and shareholding, financial highlights.

Clustered Column Ppt PowerPoint Presentation File Slide
This is a clustered column ppt powerpoint presentation file slide. This is a two stage process. The stages in this process are product, financial year, sales in percentage, bar graph.

Executive Summary Ppt PowerPoint Presentation Professional Example
This is a executive summary ppt powerpoint presentation professional example. This is a four stage process. The stages in this process are background, capabilities, accreditation, promoters and shareholding, financial highlights.

Area Chart Ppt PowerPoint Presentation Layouts Maker
This is a area chart ppt powerpoint presentation layouts maker. This is a two stage process. The stages in this process are financial year, sales in percentage, graph, business, marketing.

Clustered Column Ppt PowerPoint Presentation Slides Smartart
This is a clustered column ppt powerpoint presentation slides smartart. This is a two stage process. The stages in this process are product, sales in percentage, financial year, bar graph.

Area Chart Ppt PowerPoint Presentation Summary Show
This is a area chart ppt powerpoint presentation summary show. This is a two stage process. The stages in this process are sales in percentage, financial year, business, marketing, finance.

Clustered Column Ppt PowerPoint Presentation File Graphics
This is a clustered column ppt powerpoint presentation file graphics. This is a two stage process. The stages in this process are product, financial year, sales in percentage, graph, growth.

Bar Chart Ppt PowerPoint Presentation Icon Layout
This is a bar chart ppt powerpoint presentation icon layout. This is a one stage process. The stages in this process are sales in percentage, financial years, bar chart, finance, marketing.

area chart ppt powerpoint presentation professional elements
This is a area chart ppt powerpoint presentation professional elements. This is a two stage process. The stages in this process are financial year sales in percentage, business, marketing, graph.

Clustered Column Chart Ppt PowerPoint Presentation Show Slideshow
This is a clustered column chart ppt powerpoint presentation show slideshow. This is a six stage process. The stages in this process are financial year in, sales in percentage, business, marketing, finance.

Bar Chart Ppt PowerPoint Presentation File Slide
This is a bar chart ppt powerpoint presentation file slide. This is a one stage process. The stages in this process are sales in percentage financial years, business, marketing, strategy, graph.

Clustered Column Ppt PowerPoint Presentation Show Graphics
This is a clustered column ppt powerpoint presentation show graphics. This is a two stage process. The stages in this process are financial year, sales in percentage, business, marketing, graph.

Cash Flow Statement Kpis Template 2 Ppt PowerPoint Presentation Layouts Visuals
This is a cash flow statement kpis template 2 ppt powerpoint presentation layouts visuals. This is a four stage process. The stages in this process are operations, financial activities, investing activities, net increase in cash.

Cash Flow Statement Kpis Tabular Form Ppt PowerPoint Presentation Summary Elements
This is a cash flow statement kpis tabular form ppt powerpoint presentation summary elements. This is a four stage process. The stages in this process are net increase cash, financial activities, operations, investing activities.

Clustered Column Ppt PowerPoint Presentation Gallery Structure
This is a clustered column ppt powerpoint presentation gallery structure. This is a two stage process. The stages in this process are product, sales in percentage, financial year, bar graph, finance.

Bar Chart Ppt PowerPoint Presentation Diagram Lists
This is a bar chart ppt powerpoint presentation diagram lists. This is a two stage process. The stages in this process are business, marketing, financial years, sales in percentage, graph.

Area Chart Ppt PowerPoint Presentation Inspiration Professional
This is a area chart ppt powerpoint presentation inspiration professional. This is a two stage process. The stages in this process are financial year, in percentage, area chart, finance, business, marketing.

Bar Chart Ppt PowerPoint Presentation Visual Aids Diagrams
This is a bar chart ppt powerpoint presentation visual aids diagrams. This is a two stage process. The stages in this process are business, marketing, financial years, sales in percentage, graph.

Clustered Column Ppt PowerPoint Presentation Gallery Format
This is a clustered column ppt powerpoint presentation gallery format. This is a two stage process. The stages in this process are business, marketing, graph, financial year, sales in percentage.

Bar Chart Ppt PowerPoint Presentation Outline Backgrounds
This is a bar chart ppt powerpoint presentation outline backgrounds. This is a one stage process. The stages in this process are sales in percentage, financial years, product, bar graph, finance.
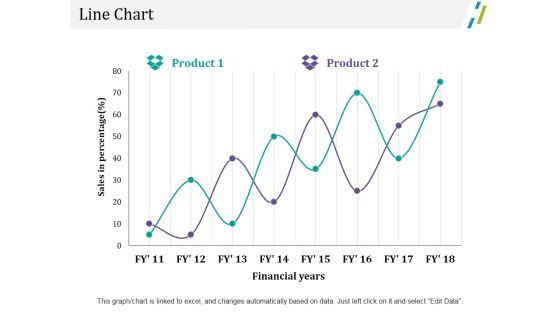
Line Chart Ppt PowerPoint Presentation Outline File Formats
This is a line chart ppt powerpoint presentation outline file formats. This is a two stage process. The stages in this process are business, marketing, sales in percentage, financial years, chart.

Line Chart Ppt PowerPoint Presentation Outline Ideas
This is a line chart ppt powerpoint presentation outline ideas. This is a two stage process. The stages in this process are business, marketing, financial years, sales in percentage, strategy.

Column Chart Ppt PowerPoint Presentation Infographic Template Icon
This is a column chart ppt powerpoint presentation infographic template icon. This is a two stage process. The stages in this process are business, marketing, sales in percentage, financial year, graph.

Bar Chart Ppt PowerPoint Presentation Summary File Formats
This is a bar chart ppt powerpoint presentation summary file formats. This is a two stage process. The stages in this process are business, finance, financial years, sales in percentage, graph.
 Home
Home