Financial Statements

Deliver Efficiency Innovation Measuring Business Unit Performance Dashboard Background PDF
This slide covers dashboard that shows business unit performance such as new customers, average weekly sales revenue, sales revenues, profits, customer lifetime value, etc. Deliver an awe inspiring pitch with this creative Deliver Efficiency Innovation Measuring Business Unit Performance Dashboard Background PDF bundle. Topics like Customer Lifetime Value, Customer Acquisition Cost, Average Revenue Per Unit, Above Sales Target YTD can be discussed with this completely editable template. It is available for immediate download depending on the needs and requirements of the user.

Raising Overview Of Co Branding Stakeholder Fund Raising Elevator Pitch Deck Microsoft PDF
This slide describes the overview of brand partnership company which includes mission, core values and yearly revenues. Deliver an awe inspiring pitch with this creative Raising Overview Of Co Branding Stakeholder Fund Raising Elevator Pitch Deck Microsoft PDF bundle. Topics like Our Mission, Revenues, Cost, Accumulative Revenue can be discussed with this completely editable template. It is available for immediate download depending on the needs and requirements of the user.

Effective Sales Technique For New Product Launch KPI Dashboard To Monitor Sales Performance Graphics PDF
This slide shows sales performance monitoring dashboard. Metrics included in the dashboard are sales revenue, sales growth, average revenue per unit, customer lifetime value and customer acquisition cost.Deliver an awe inspiring pitch with this creative Effective Sales Technique For New Product Launch KPI Dashboard To Monitor Sales Performance Graphics PDF bundle. Topics like Country Performance, Average Revenue, Customer Acquisition can be discussed with this completely editable template. It is available for immediate download depending on the needs and requirements of the user.
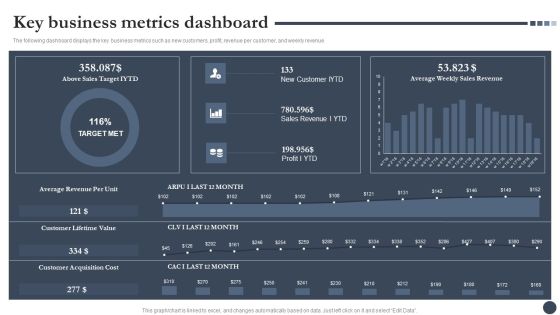
Strategic Playbook For Enterprise Administration Key Business Metrics Dashboard Pictures PDF
The following dashboard displays the key business metrics such as new customers, profit, revenue per customer, and weekly revenue. Deliver and pitch your topic in the best possible manner with this Strategic Playbook For Enterprise Administration Key Business Metrics Dashboard Pictures PDF. Use them to share invaluable insights on Average Revenue Per Unit, Customer Lifetime Value, Customer Acquisition Cost and impress your audience. This template can be altered and modified as per your expectations. So, grab it now.

Performance Strategic Analysis Dashboard For Tactical Management Rules PDF
This slide defines the dashboard for analyzing the sales key performance indicators KPIs. It includes information related to the number of sales, revenue, profit, and cost. Showcasing this set of slides titled Performance Strategic Analysis Dashboard For Tactical Management Rules PDF. The topics addressed in these templates are Revenue, New Customers, Average Revenue, Per Customer. All the content presented in this PPT design is completely editable. Download it and make adjustments in color, background, font etc. as per your unique business setting.

Stock Offering As An Exit Alternative Potential Buyer Profile Graphics PDF
This slide provides crucial information about potential buyer acquirer in terms of their expertise, business objectives, revenues. etc. Presenting stock offering as an exit alternative potential buyer profile graphics pdf to provide visual cues and insights. Share and navigate important information on thirteen stages that need your due attention. This template can be used to pitch topics like industry, geography, revenues, business, budget. In addtion, this PPT design contains high resolution images, graphics, etc, that are easily editable and available for immediate download.

Developing Functional Logistic Plan Business Roi After Successful Logistic Strategy Plan Topics PDF
This slide shows the ROI after successful logistic strategy plan which includes increasing sales revenue, bringing more profits, provide adequate budge, etc. Deliver and pitch your topic in the best possible manner with this developing functional logistic plan business roi after successful logistic strategy plan topics pdf. Use them to share invaluable insights on sales revenue, lead quality, budget and impress your audience. This template can be altered and modified as per your expectations. So, grab it now.

Key Account Marketing Approach Collecting Firmographic And Technographic Data Portrait PDF
The purpose of filling ICP worksheet is to get relevant information regarding the target account characteristics such as industry or vertical they cater to, annual revenue, budget, geography, etc. Deliver an awe inspiring pitch with this creative key account marketing approach collecting firmographic and technographic data portrait pdf bundle. Topics like industry, technology used, company revenue, geography can be discussed with this completely editable template. It is available for immediate download depending on the needs and requirements of the user.

Strategic Account Management By Selling And Advertisement Collecting Firmographic And Technographic Rules PDF
The purpose of filling ICP worksheet is to get relevant information regarding the target account characteristics such as industry or vertical they cater to, annual revenue, budget, geography, etc. Deliver an awe inspiring pitch with this creative strategic account management by selling and advertisement collecting firmographic and technographic rules pdf bundle. Topics like company revenue, geography, manufacturing, retail can be discussed with this completely editable template. It is available for immediate download depending on the needs and requirements of the user.

Components For Successful Sales Strategic Plan Guidelines PDF
This slide shows essential elements by organization for sales and also these should be able with in firms business model. It includes measurable objectives, value proposition and revenue goals. Presenting Components For Successful Sales Strategic Plan Guidelines PDF to dispense important information. This template comprises three stages. It also presents valuable insights into the topics including Measurable Objectives, Budget, Revenue Goals. This is a completely customizable PowerPoint theme that can be put to use immediately. So, download it and address the topic impactfully.

Key Account Marketing Approach Creating Ideal Customer Profile Worksheet Formats PDF
The purpose of filling ICP worksheet is to get relevant information regarding the target account characteristics such as industry or vertical they cater to, annual revenue, budget, geography, etc. Presenting key account marketing approach creating ideal customer profile worksheet formats pdf to provide visual cues and insights. Share and navigate important information on four stages that need your due attention. This template can be used to pitch topics like industries or verticals, manufacturing, geography, annual revenue, budget. In addtion, this PPT design contains high resolution images, graphics, etc, that are easily editable and available for immediate download.
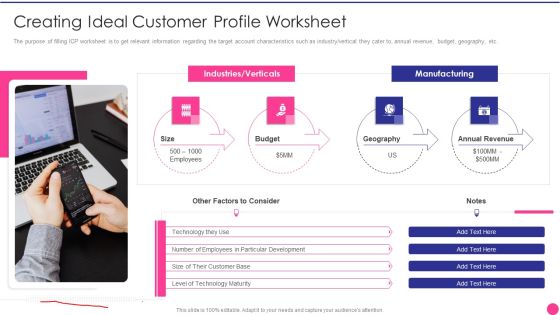
Operating B2B Sales Creating Ideal Customer Profile Worksheet Sample PDF
The purpose of filling ICP worksheet is to get relevant information regarding the target account characteristics such as industry or vertical they cater to, annual revenue, budget, geography, etc. Presenting operating b2b sales creating ideal customer profile worksheet sample pdf to provide visual cues and insights. Share and navigate important information on four stages that need your due attention. This template can be used to pitch topics like budget, geography, annual revenue. In addtion, this PPT design contains high resolution images, graphics, etc, that are easily editable and available for immediate download.
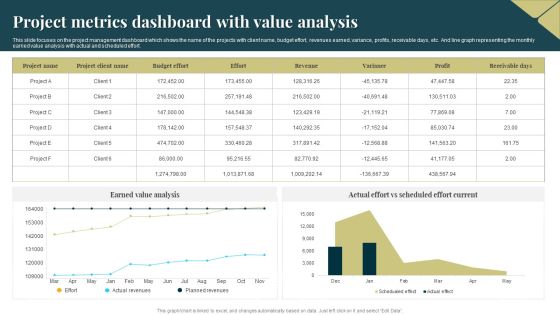
Project Metrics Dashboard With Value Analysis Introduction PDF
This slide focuses on the project management dashboard which shows the name of the projects with client name, budget effort, revenues earned, variance, profits, receivable days, etc. And line graph representing the monthly earned value analysis with actual and scheduled effort. Showcasing this set of slides titled Project Metrics Dashboard With Value Analysis Introduction PDF. The topics addressed in these templates are Budget Effort, Revenues, Earned Value Analysis. All the content presented in this PPT design is completely editable. Download it and make adjustments in color, background, font etc. as per your unique business setting.
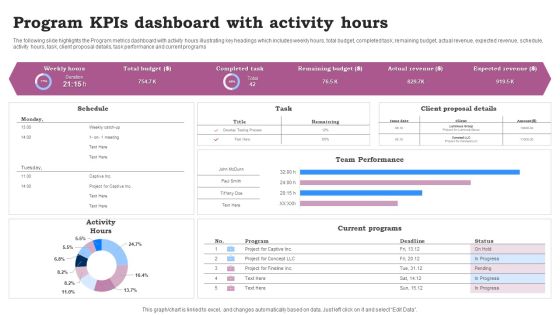
Program Kpis Dashboard With Activity Hours Ppt Infographics Clipart Images PDF
The following slide highlights the Program metrics dashboard with activity hours illustrating key headings which includes weekly hours, total budget, completed task, remaining budget, actual revenue, expected revenue, schedule, activity hours, task, client proposal details, task performance and current programs. Pitch your topic with ease and precision using this Program Kpis Dashboard With Activity Hours Ppt Infographics Clipart Images PDF. This layout presents information on Team Performance, Current Programs, Activity Hours. It is also available for immediate download and adjustment. So, changes can be made in the color, design, graphics or any other component to create a unique layout.
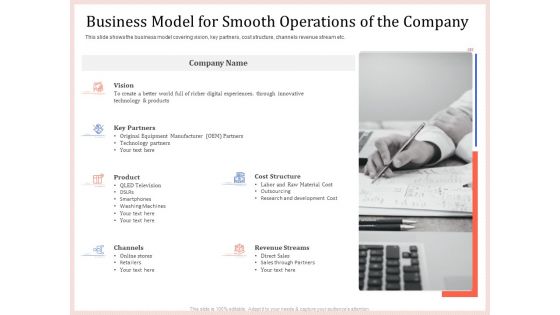
Pitch Deck To Raise Capital From Product Pooled Funding Business Model For Smooth Operations Of The Company Ideas PDF
This slide shows the business model covering vision, key partners, cost structure, channels revenue stream etc. Presenting pitch deck to raise capital from product pooled funding business model for smooth operations of the company ideas pdf to provide visual cues and insights. Share and navigate important information on six stages that need your due attention. This template can be used to pitch topics like vision, key partners, product, channels, cost structure. In addtion, this PPT design contains high resolution images, graphics, etc, that are easily editable and available for immediate download.

Forecast And Projection Ppt PowerPoint Presentation Styles Graphics Design
Presenting this set of slides with name forecast and projection ppt powerpoint presentation styles graphics design. The topics discussed in these slides are revenue, sales, miscellaneous income, total revenue, expenses, employee cost, total expenses, purchases, total purchases, project profit. This is a completely editable PowerPoint presentation and is available for immediate download. Download now and impress your audience.
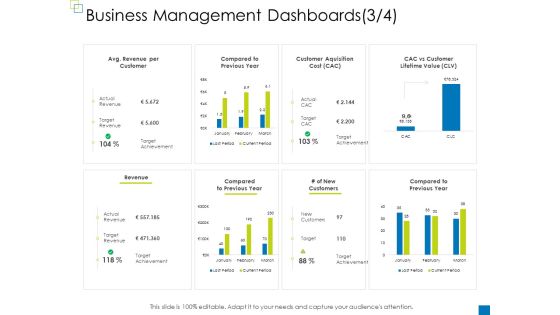
Enterprise Management Business Management Dashboards New Portrait PDF
Deliver an awe-inspiring pitch with this creative enterprise management business management dashboards new portrait pdf bundle. Topics like customer aquisition cost, customer lifetime value, revenue, revenue per customer, compared to previous year can be discussed with this completely editable template. It is available for immediate download depending on the needs and requirements of the user.

Administrative Regulation Business Management Dashboards Customer Ppt PowerPoint Presentation Images PDF
Deliver an awe-inspiring pitch with this creative administrative regulation business management dashboards customer ppt powerpoint presentation images pdf bundle. Topics like actual revenue, target revenue, target achievement, new customers, customer acquisition cost can be discussed with this completely editable template. It is available for immediate download depending on the needs and requirements of the user.

Corporate Governance Post It Notes Designs PDF
Deliver an awe inspiring pitch with this creative corporate governance post it notes designs pdf bundle. Topics like forecasted revenue, cost of goods sold, annual revenue per product can be discussed with this completely editable template. It is available for immediate download depending on the needs and requirements of the user.
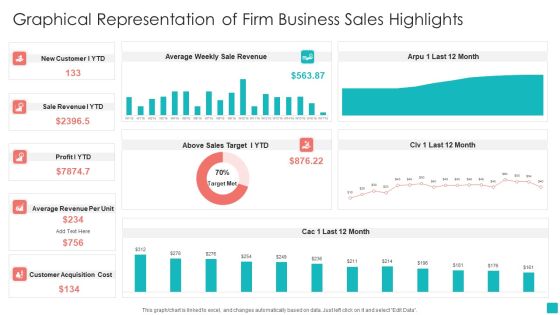
Graphical Representation Of Firm Business Sales Highlights Pictures PDF
Showcasing this set of slides titled Graphical Representation Of Firm Business Sales Highlights Pictures PDF. The topics addressed in these templates are Average Revenue Per Unit, Customer Acquisition Cost, Sale Revenue. All the content presented in this PPT design is completely editable. Download it and make adjustments in color, background, font etc. as per your unique business setting.
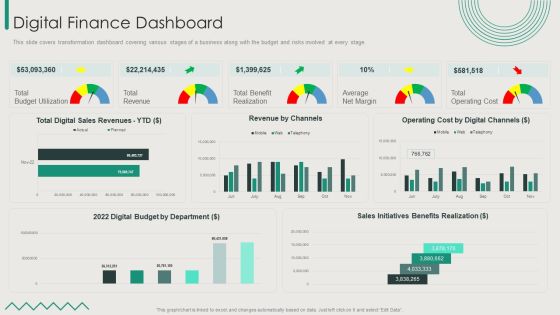
Organization Transition Digital Finance Dashboard Ppt PowerPoint Presentation File Good PDF
This slide covers transformation dashboard covering various stages of a business along with the budget and risks involved at every stage. Deliver and pitch your topic in the best possible manner with this Organization Transition Digital Finance Dashboard Ppt PowerPoint Presentation File Good PDF. Use them to share invaluable insights on Total Budget Utilization, Total Revenue, Total Benefit Realization and impress your audience. This template can be altered and modified as per your expectations. So, grab it now.

External Partner Activities Done Powerpoint Slide Designs
This is an external partner activities done powerpoint slide designs. This is a five stage process. The stages in this process are external partner activities done, customer relationships, customer segments, cost structure, revenue streams.

Better Customers Experience Ppt Example
This is a better customers experience ppt example. This is a five stage process. The stages in this process are better customers experience, lower cost to service, market share retention, additional revenue, diversification of risk.

Business Model Diagram Ppt Powerpoint Templates
This is a business model diagram ppt powerpoint templates. This is a eight stage process. The stages in this process are partner network, cost structure, revenue model, value proposition, target customer, distribution channels, customer relationship, core capabilities.

Create The Organizational Ppt Background Graphics
This is a create the organizational ppt background graphics. This is a six stage process. The stages in this process are pick opportunities opportunity costs, plan the production, increase revenues, create the organizational, create the organizational, plan the business.
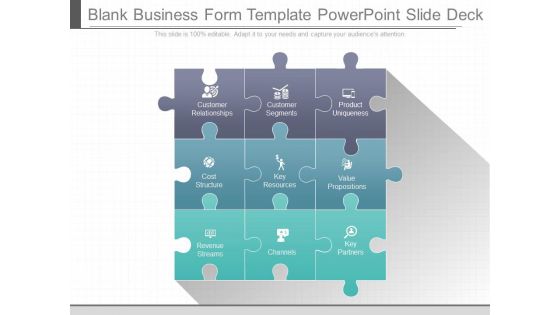
Blank Business Form Template Powerpoint Slide Deck
This is a blank business form template powerpoint slide deck. This is a nine stage process. The stages in this process are customer relationships, customer segments, product uniqueness, cost structure, key resources, value propositions, revenue streams, channels, key partners.\n\n

Search Engine Optimization Objectives Ppt Slide
This is a search engine optimization objectives ppt slide. This is a seven stage process. The stages in this process are website traffic analysis, product awareness, reduced cost, increase site traffic, sales revenue, repeat visitors, sales leads.
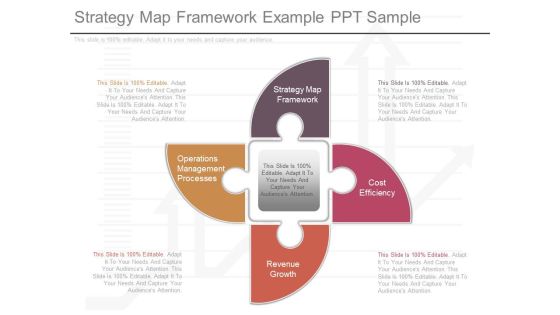
Strategy Map Framework Example Ppt Sample
This is a strategy map framework example ppt sample. This is a four stage process. The stages in this process are operations management processes, strategy map framework, cost efficiency, revenue growth.

Improve Shareholder Value Powerpoint Slide Clipart
This is a improve shareholder value powerpoint slide clipart. This is a six stage process. The stages in this process are improve shareholder value, revenue growth strategy, productivity strategy, improve cost structure, increase value to customers, build the franchise.

Advantages Of Quality Management System Ppt Powerpoint Layout
This is a advantages of quality management system ppt powerpoint layout. This is a four stage process. The stages in this process are maximize revenue, customer retention, efficient system, margin, waste, defects, minimize cost, margin contribution.
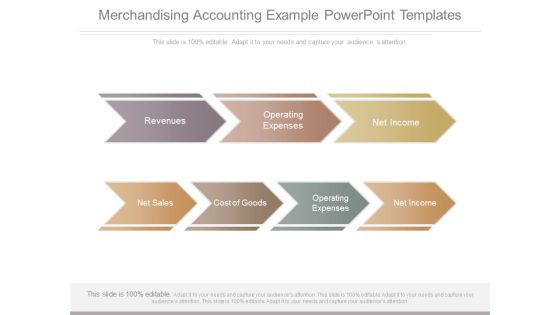
Merchandising Accounting Example Powerpoint Templates
This is a merchandising accounting example powerpoint templates. This is a seven stage process. The stages in this process are revenues, operating expenses, net income, net sales, cost of goods, operating expenses, net income.

Sales Effectiveness Administration Diagram Powerpoint Layout
This is a sales effectiveness administration diagram powerpoint layout. This is a four stage process. The stages in this process are reduced cost of sales, increased profitability, revenue growth, increased sales effectiveness.

Competitive Advantage Of Big Data Sample Ppt Slides
This is a competitive advantage of big data sample ppt slides. This is a five stage process. The stages in this process are possible cost savings, continual innovation, visibility into causal relationship, potential revenue, more informed decision making, competitive advantage.

Strategic Objectives Perspective Presentation Design
This is a strategic objectives perspective presentation design. This is a four stage process. The stages in this process are strategic objectives perspective, build high performance products, improve cost efficiency, increase revenue growth.

Pricing Objectives Diagram Sample Of Ppt Presentation
This is a pricing objectives diagram sample of ppt presentation. This is a seven stage process. The stages in this process are pricing objectives, revenue maximization, profit maximization, partial cost recovery, survival, status quo, quantity leader, maximize quantity.

Components Of Business Measures Diagram Ppt Slide Styles
This is a components of business measures diagram ppt slide styles. This is a five stage process. The stages in this process are client satisfaction, costs, market share, efficiency, revenue.

Balanced Scorecard Strategy Map Diagram Presentation Powerpoint Example
This is a balanced scorecard strategy map diagram presentation powerpoint example. This is a five stage process. The stages in this process are grow revenue, manage costs, values, strategy, mission.

Prospect Need Assessment Example Ppt Slide
This is a prospect need assessment example ppt slide. This is a eight stage process. The stages in this process are analysis, preferences, habit, income, needs, change in profits, change in costs, change in revenues, change in quantity.

Progress Action Strategy Diagram Powerpoint Slide Graphics
This is a progress action strategy diagram powerpoint slide graphics. This is a six stage process. The stages in this process are lower inventory costs, self assessment, formative assessment evaluation, find alternative revenue streams, summative evaluation, implementing of the plan.

Business Model Canvas Chart Ppt Images
This is a business model canvas chart ppt images. This is a five stage process. The stages in this process are key partners, key activities, value propositions, customer relationships, customer segments, key resources, channels, cost structure, revenue streams.

Business Model Rules Table Powerpoint Slide Rules
This is a business model rules table powerpoint slide rules. This is a five stage process. The stages in this process are key partners, key activities, value propositions, customer relationships, customer segments, key resources, channels, cost structure, revenue streams.

Business Model Table For Information Example Of Ppt
This is a business model table for information example of ppt. This is a five stage process. The stages in this process are key partners, key activities, key resources, cost structure, revenue streams, channels, value propositions, customer relationships, customer segments.

Business Model Canvas Process Table Powerpoint Topics
This is a business model canvas process table powerpoint topics. This is a five stage process. The stages in this process are key partners, cost structure, key resources, key activities, channels, revenue streams, value propositions, customer, relationships, customer segments.

Business Model Canvas Chart Example Ppt Presentation
This is a business model canvas chart example ppt presentation. This is a five stage process. The stages in this process are key partners, key activities, value propositions, customer relationships, customer segments, key resources, channels, cost structure, revenue streams.

Business Model Segmentation Powerpoint Slides
This is a business model segmentation powerpoint slides. This is a nine stage process. The stages in this process are key partners, key resources, key activities, value, propositions, customer, relationships, customer segments, cost structure, revenue streams.

Business Model Canvas For Process Analysis Powerpoint Images
This is a business model canvas for process analysis powerpoint images. This is a seven stage process. The stages in this process are key partners, key activities, value, propositions, customer relationships, customer segments, key resources, channels, cost structure, revenue streams.

New Business Model Chart Presentation Powerpoint Example
This is a new business model chart presentation powerpoint example. This is a five stage process. The stages in this process are key partners, key activities, value propositions, customer, relationships, customer segments, key resources, channels, cost structure, revenue streams.

Customer Lifetime Value Calculations Powerpoint Layout
This is a customer lifetime value calculations powerpoint layout. This is a six stage process. The stages in this process are average acquisition cost, average customer revenue, average customer profit, customer retention rate, discount rate.

Business Model Framework Powerpoint Guide
This is a business model framework powerpoint guide. This is a five stage process. The stages in this process are channels, key resources, key partners, key activities, value propositions, customer relationships, customer segments, cost structure, revenue streams.

Calculating Customer Lifetime Value Ppt PowerPoint Presentation Introduction
This is a calculating customer lifetime value ppt powerpoint presentation introduction. This is a five stage process. The stages in this process are average acquisition cost, average customer revenue, likely customer profit.

Business Model Canvas Ppt PowerPoint Presentation Tips
This is a business model canvas ppt powerpoint presentation tips. This is a five stage process. The stages in this process are key partners, key activities, value propositions, customer relationships, customer segments, key resources, channels, cost structure, revenue streams.

Importance Of Customer Initiatives Ppt PowerPoint Presentation Example 2015
This is a importance of customer initiatives ppt powerpoint presentation example 2015. This is a six stage process. The stages in this process are remain in business, increase revenue, optimize resources and minimize costs, customer initiatives, decision support initiatives.

Business Model Canvas Ppt PowerPoint Presentation Show
This is a business model canvas ppt powerpoint presentation show. This is a five stage process. The stages in this process are key partners, key activities, value propositions, customer relationships, customer segments, key resources, channels, cost structure, revenue streams.

Business Model Canvas Ppt PowerPoint Presentation Picture
This is a business model canvas ppt powerpoint presentation picture. This is a five stage process. The stages in this process are key partners, key activities, value, propositions, customer, relationships, customer segments, key resources, channels, cost structure, revenue streams.

Potential Price And Profit Margins Ppt PowerPoint Presentation Files
This is a potential price and profit margins ppt powerpoint presentation files. This is a one stage process. The stages in this process are overview, revenue, cost of production, gross profit.

Business Model Template 3 Ppt PowerPoint Presentation Deck
This is a business model template 3 ppt powerpoint presentation deck. This is a three stage process. The stages in this process are key partners, key propositions, customer segments, key activities, key resources, customer relationships, channels, cost structure, revenue streams.

Business Model Template 3 Ppt PowerPoint Presentation Guide
This is a business model template 3 ppt powerpoint presentation guide. This is a five stage process. The stages in this process are cost structure, revenue streams, key activities, key partners, key resources, key propositions, customer relationships, customer segments.

Break Even Analysis Ppt PowerPoint Presentation Slides
This is a break even analysis ppt powerpoint presentation slides. This is a two stage process. The stages in this process are loss, profit, sales, total revenue, break even point, total costs.

Importance Of Customer Initiatives Ppt PowerPoint Presentation Microsoft
This is a importance of customer initiatives ppt powerpoint presentation microsoft. This is a six stage process. The stages in this process are remain in business, increase revenue, optimize resources and minimize costs, customer initiatives, decision support initiatives.

Calculating Customer Lifetime Value Clv Ppt Powerpoint Presentation Slides Aids
This is a calculating customer lifetime value clv ppt powerpoint presentation slides aids. This is a four stage process. The stages in this process are complete clv year, average acquisition cost, average customer revenue.

 Home
Home