AI PPT Maker
Templates
PPT Bundles
Design Services
Business PPTs
Business Plan
Management
Strategy
Introduction PPT
Roadmap
Self Introduction
Timelines
Process
Marketing
Agenda
Technology
Medical
Startup Business Plan
Cyber Security
Dashboards
SWOT
Proposals
Education
Pitch Deck
Digital Marketing
KPIs
Project Management
Product Management
Artificial Intelligence
Target Market
Communication
Supply Chain
Google Slides
Research Services
 One Pagers
All Categories
-
Home
- Customer Favorites
- Financial Snapshot
Financial Snapshot

Administrative Regulation Business Management Dashboards Revenue Ppt PowerPoint Presentation Professional Graphics Design PDF
Deliver and pitch your topic in the best possible manner with this administrative regulation business management dashboards revenue ppt powerpoint presentation professional graphics design pdf. Use them to share invaluable insights on out costs, adverts, products, revenue, manufacturing, operations and impress your audience. This template can be altered and modified as per your expectations. So, grab it now.

Business Activities Assessment Examples Infrastructure KPI Dashboard Showing Project Revenue Infographics PDF
Deliver an awe inspiring pitch with this creative business activities assessment examples infrastructure kpi dashboard showing project revenue infographics pdf bundle. Topics like net project revenue per employee, construction and demolition west recycled, dollars per employee can be discussed with this completely editable template. It is available for immediate download depending on the needs and requirements of the user.

Customer Business Service Delivery Framework Dashboard With Total Revenue Structure PDF
Pitch your topic with ease and precision using this Customer Business Service Delivery Framework Dashboard With Total Revenue Structure PDF. This layout presents information on Requests Answered, Total Requests, Total Revenue. It is also available for immediate download and adjustment. So, changes can be made in the color, design, graphics or any other component to create a unique layout.

Stock Photo Business Management Strategy Save Money Bank Images Photos
Avoid Foolhardy Actions With Our stock photo business management strategy save money bank images photos. They Encourage A Considered Approach. Our finance Dish Out Food For Thought. Create The Correct Conditions For Deliberation.
Strategic Management Economic Growth Sales Diagram
Doll Up Your Thoughts With Our Strategic Management Economic Growth Sales Diagram Powerpoint Templates. They Will Make A Pretty Picture.

Implementing Digital Transformation Kpi Dashboard To Track Digital Transformation Initiatives Structure PDF
Following slide provides dashboard that can be used by the businesses to measure the performance of digital transformation initiatives with the help of different KPIs. KPIs covered are social presence, click through rate, sales revenue, churn amount etc. The Implementing Digital Transformation Kpi Dashboard To Track Digital Transformation Initiatives Structure PDF is a compilation of the most recent design trends as a series of slides. It is suitable for any subject or industry presentation, containing attractive visuals and photo spots for businesses to clearly express their messages. This template contains a variety of slides for the user to input data, such as structures to contrast two elements, bullet points, and slides for written information. Slidegeeks is prepared to create an impression.
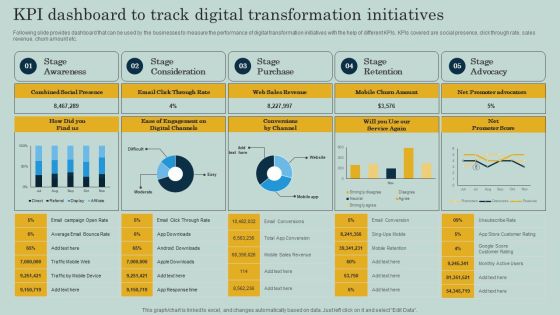
KPI Dashboard To Track Digital Transformation Initiatives Ppt Show Backgrounds PDF
Following slide provides dashboard that can be used by the businesses to measure the performance of digital transformation initiatives with the help of different KPIs. KPIs covered are social presence, click through rate, sales revenue, churn amount etc. The KPI Dashboard To Track Digital Transformation Initiatives Ppt Show Backgrounds PDF is a compilation of the most recent design trends as a series of slides. It is suitable for any subject or industry presentation, containing attractive visuals and photo spots for businesses to clearly express their messages. This template contains a variety of slides for the user to input data, such as structures to contrast two elements, bullet points, and slides for written information. Slidegeeks is prepared to create an impression.
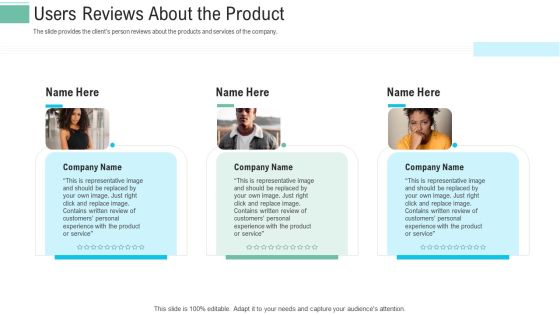
Pitch Presentation Raise Money Spot Market Users Reviews About The Product Ppt Layouts Picture PDF
The slide provides the clients person reviews about the products and services of the company. This is a pitch presentation raise money spot market users reviews about the product ppt layouts picture pdf template with various stages. Focus and dispense information on three stages using this creative set, that comes with editable features. It contains large content boxes to add your information on topics like product or service, review of customers, personal experience. You can also showcase facts, figures, and other relevant content using this PPT layout. Grab it now.

Stock Photo Business And Strategy Fill Up Piggy With Dollars Clipart Images
Knock On The Door To Success With Our stock photo business and strategy fill up piggy with dollars clipart images Powerpoint Templates. Be Assured Of Gaining Entry. Give Them A Dose Of Your Ability. It Will Go Down Well With Our Money Powerpoint Templates.

Sales KPIS Dashboard With Profit Margin Ppt PowerPoint Presentation Slides Show PDF
Presenting this set of slides with name sales kpis dashboard with profit margin ppt powerpoint presentation slides show pdf. The topics discussed in these slides are new customers, revenue, profit, profit margin. This is a completely editable PowerPoint presentation and is available for immediate download. Download now and impress your audience.

Business Dashboard Showing Revenue And Expenditure Overview Ppt PowerPoint Presentation Infographics Templates PDF
Presenting this set of slides with name business dashboard showing revenue and expenditure overview ppt powerpoint presentation infographics templates pdf. The topics discussed in these slides are income, expenses, open invoice, cost good sold, maintenance and repai, paid last 30 days. This is a completely editable PowerPoint presentation and is available for immediate download. Download now and impress your audience.

Organization Corporate Sustainability Dashboard With Sourced Technologies Pictures PDF
The following slide showcases green business model for multiple activities. It provides information about growth, return on capital, risk management, innovation, operational risks, etc.Showcasing this set of slides titled Organization Corporate Sustainability Dashboard With Sourced Technologies Pictures PDF. The topics addressed in these templates are Electricity Consumed, Renewable Energy, Committees Covered. All the content presented in this PPT design is completely editable. Download it and make adjustments in color, background, font etc. as per your unique business setting.

B2b Sales Representative Insights Dashboard Sample PDF
Deliver and pitch your topic in the best possible manner with this b2b sales representative insights dashboard sample pdf. Use them to share invaluable insights on sales representative insights dashboardThis slide covers the sales reps dashboard wherein teams contribution to leads, managing SQLs and revenue targets are evaluated. and impress your audience. This template can be altered and modified as per your expectations. So, grab it now.

B2B Prospects Performance Measurement Dashboard Ideas PDF
This slide provides information regarding B2B performance tracking dashboard to measure leads, MQL, SQL, customers, revenue goals, total media spend. Deliver an awe inspiring pitch with this creative b2b prospects performance measurement dashboard ideas pdf bundle. Topics like ineffective in managing requirements, essential points are catered, understanding of company can be discussed with this completely editable template. It is available for immediate download depending on the needs and requirements of the user.
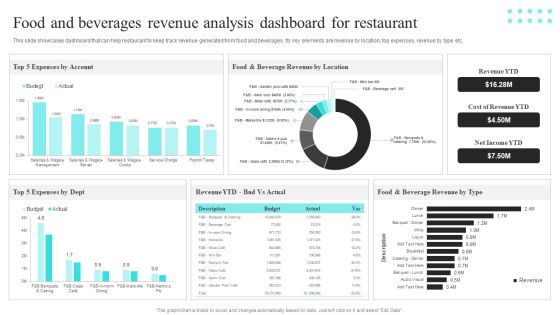
Strategic Promotional Guide For Restaurant Business Advertising Food And Beverages Revenue Analysis Dashboard Template PDF
This slide showcases dashboard that can help restaurant to keep track revenue generated from food and beverages. Its key elements are revenue by location, top expenses, revenue by type etc. This Strategic Promotional Guide For Restaurant Business Advertising Food And Beverages Revenue Analysis Dashboard Template PDF from Slidegeeks makes it easy to present information on your topic with precision. It provides customization options, so you can make changes to the colors, design, graphics, or any other component to create a unique layout. It is also available for immediate download, so you can begin using it right away. Slidegeeks has done good research to ensure that you have everything you need to make your presentation stand out. Make a name out there for a brilliant performance.

Dashboard Showing Sum Of Business Costs And Revenue Ppt PowerPoint Presentation Inspiration Gallery PDF
Presenting this set of slides with name dashboard showing sum of business costs and revenue ppt powerpoint presentation inspiration gallery pdf. The topics discussed in these slides are sum of costs and revenues, contract to review, contracts per org unit, contracts per category, contracts per status. This is a completely editable PowerPoint presentation and is available for immediate download. Download now and impress your audience.

Dashboard For Tracking And Measuring Business Sales And Revenue Ppt PowerPoint Presentation Slides Introduction PDF
Showcasing this set of slides titled dashboard for tracking and measuring business sales and revenue ppt powerpoint presentation slides introduction pdf. The topics addressed in these templates are revenue by pipeline jun 2020, new deals by month this year 2020, forecast june 2020, revenue goal attainment by owner jun 2020, revenue goal attainment jun 2020, pipeline coverage jul 2020. All the content presented in this PPT design is completely editable. Download it and make adjustments in color, background, font etc. as per your unique business setting.
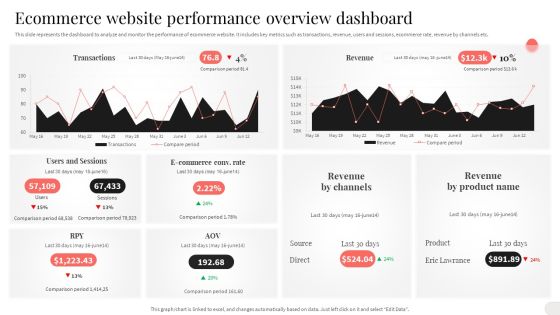
Analyzing And Implementing Effective CMS Ecommerce Website Performance Overview Dashboard Portrait PDF
This slide represents the dashboard to analyze and monitor the performance of ecommerce website. It includes key metrics such as transactions, revenue, users and sessions, ecommerce rate, revenue by channels etc. Here you can discover an assortment of the finest PowerPoint and Google Slides templates. With these templates, you can create presentations for a variety of purposes while simultaneously providing your audience with an eye catching visual experience. Download Analyzing And Implementing Effective CMS Ecommerce Website Performance Overview Dashboard Portrait PDF to deliver an impeccable presentation. These templates will make your job of preparing presentations much quicker, yet still, maintain a high level of quality. Slidegeeks has experienced researchers who prepare these templates and write high quality content for you. Later on, you can personalize the content by editing the Analyzing And Implementing Effective CMS Ecommerce Website Performance Overview Dashboard Portrait PDF.

Analyzing And Deploying Effective CMS Ecommerce Website Performance Overview Dashboard Download PDF
This slide represents the dashboard to analyze and monitor the performance of ecommerce website. It includes key metrics such as transactions, revenue, users and sessions, ecommerce rate, revenue by channels etc. Here you can discover an assortment of the finest PowerPoint and Google Slides templates. With these templates, you can create presentations for a variety of purposes while simultaneously providing your audience with an eye catching visual experience. Download Analyzing And Deploying Effective CMS Ecommerce Website Performance Overview Dashboard Download PDF to deliver an impeccable presentation. These templates will make your job of preparing presentations much quicker, yet still, maintain a high level of quality. Slidegeeks has experienced researchers who prepare these templates and write high quality content for you. Later on, you can personalize the content by editing the Analyzing And Deploying EffAnalyzing And Deploying Effective CMS Ecommerce Website Performance Overview Dashboard Download PDF.
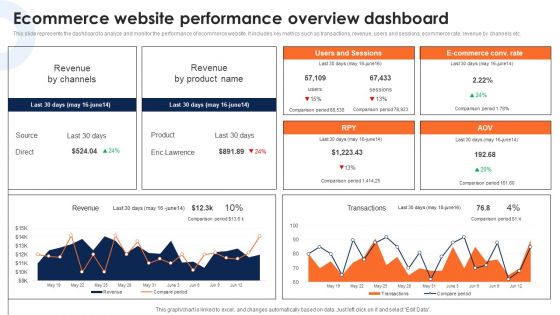
Ecommerce Website Performance Overview Dashboard Deploying Ecommerce Order Management Infographics PDF
This slide represents the dashboard to analyze and monitor the performance of ecommerce website. It includes key metrics such as transactions, revenue, users and sessions, ecommerce rate, revenue by channels etc.If you are looking for a format to display your unique thoughts, then the professionally designed Ecommerce Website Performance Overview Dashboard Deploying Ecommerce Order Management Infographics PDF is the one for you. You can use it as a Google Slides template or a PowerPoint template. Incorporate impressive visuals, symbols, images, and other charts. Modify or reorganize the text boxes as you desire. Experiment with shade schemes and font pairings. Alter, share or cooperate with other people on your work. Download Ecommerce Website Performance Overview Dashboard Deploying Ecommerce Order Management Infographics PDF and find out how to give a successful presentation. Present a perfect display to your team and make your presentation unforgettable.
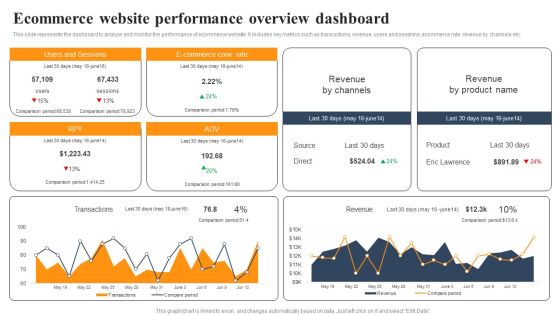
Implementing An Effective Ecommerce Management Framework Ecommerce Website Performance Overview Dashboard Clipart PDF
This slide represents the dashboard to analyze and monitor the performance of ecommerce website. It includes key metrics such as transactions, revenue, users and sessions, ecommerce rate, revenue by channels etc. Find highly impressive Implementing An Effective Ecommerce Management Framework Ecommerce Website Performance Overview Dashboard Clipart PDF on Slidegeeks to deliver a meaningful presentation. You can save an ample amount of time using these presentation templates. No need to worry to prepare everything from scratch because Slidegeeks experts have already done a huge research and work for you. You need to download Implementing An Effective Ecommerce Management Framework Ecommerce Website Performance Overview Dashboard Clipart PDFfor your upcoming presentation. All the presentation templates are 100 percent editable and you can change the color and personalize the content accordingly. Download now
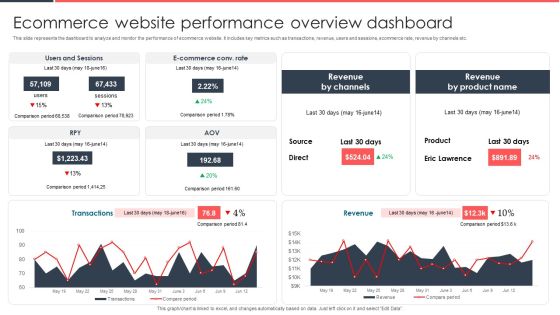
Implementing Management System To Enhance Ecommerce Processes Ecommerce Website Performance Overview Dashboard Slides PDF
This slide represents the dashboard to analyze and monitor the performance of ecommerce website. It includes key metrics such as transactions, revenue, users and sessions, ecommerce rate, revenue by channels etc. Here you can discover an assortment of the finest PowerPoint and Google Slides templates. With these templates, you can create presentations for a variety of purposes while simultaneously providing your audience with an eye catching visual experience. Download Implementing Management System To Enhance Ecommerce Processes Ecommerce Website Performance Overview Dashboard Slides PDF to deliver an impeccable presentation. These templates will make your job of preparing presentations much quicker, yet still, maintain a high level of quality. Slidegeeks has experienced researchers who prepare these templates and write high quality content for you. Later on, you can personalize the content by editing the Implementing Management System To Enhance Ecommerce Processes Ecommerce Website Performance Overview Dashboard Slides PDF.
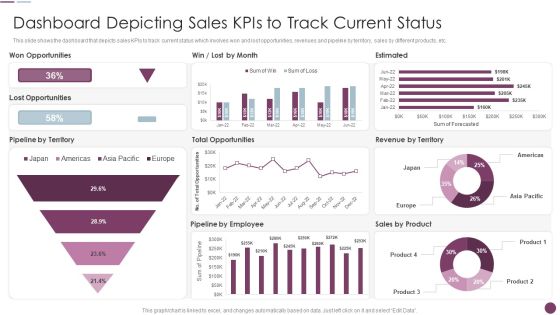
Sales Automation Procedure Dashboard Depicting Sales Kpis To Track Current Status Sample PDF
This slide shows the dashboard that depicts sales KPIs to track current status which involves won and lost opportunities, revenues and pipeline by territory, sales by different products, etc. Deliver an awe inspiring pitch with this creative Sales Automation Procedure Dashboard Depicting Sales Kpis To Track Current Status Sample PDF bundle. Topics like Estimated, Pipeline Employee, Pipeline Territory can be discussed with this completely editable template. It is available for immediate download depending on the needs and requirements of the user.
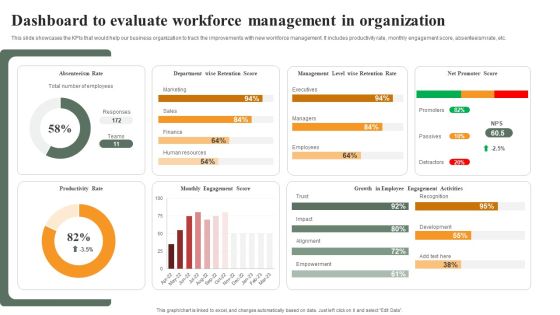
Optimizing Human Capital Alignment Dashboard To Evaluate Workforce Management In Organization Mockup PDF
This slide showcases the KPIs that would help our business organization to track the improvements with new workforce management. It includes productivity rate, monthly engagement score, absenteeism rate, etc. Do you have to make sure that everyone on your team knows about any specific topic I yes, then you should give Optimizing Human Capital Alignment Dashboard To Evaluate Workforce Management In Organization Mockup PDF a try. Our experts have put a lot of knowledge and effort into creating this impeccable Optimizing Human Capital Alignment Dashboard To Evaluate Workforce Management In Organization Mockup PDF. You can use this template for your upcoming presentations, as the slides are perfect to represent even the tiniest detail. You can download these templates from the Slidegeeks website and these are easy to edit. So grab these today.
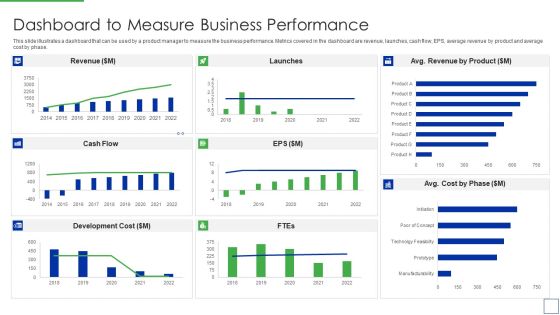
Product Portfolio Management For New Target Region Dashboard To Measure Business Rules PDF
This slide illustrates a dashboard that can be used by a product manager to measure the business performance. Metrics covered in the dashboard are revenue, launches, cash flow, EPS, average revenue by product and average cost by phase.Deliver and pitch your topic in the best possible manner with this Product Portfolio Management For New Target Region Dashboard To Measure Business Rules PDF Use them to share invaluable insights on Dashboard to Measure Business Performance and impress your audience. This template can be altered and modified as per your expectations. So, grab it now.

Ecommerce Management KPI Dashboard Ppt Slides Pictures PDF
Deliver an awe-inspiring pitch with this creative ecommerce management kpi dashboard ppt slides pictures pdf bundle. Topics like expenses, revenue, sales by lead source can be discussed with this completely editable template. It is available for immediate download depending on the needs and requirements of the user.

Agile Crystal Method Crystal Methodology Implementation Dashboard Pictures PDF
This slide represents the crystal methodology implementation dashboard by covering annual gross revenue, product type comparison, sales rep comparison and top 10 clients.Deliver an awe inspiring pitch with this creative Agile Crystal Method Crystal Methodology Implementation Dashboard Pictures PDF bundle. Topics like Crystal Methodology Implementation Dashboard can be discussed with this completely editable template. It is available for immediate download depending on the needs and requirements of the user.

Growing Investment Money Finance PowerPoint Templates Ppt Backgrounds For Slides 0113
We present our Growing Investment Money Finance PowerPoint Templates PPT Backgrounds For Slides 0113.Download and present our Finance PowerPoint Templates because It will mark the footprints of your journey. Illustrate how they will lead you to your desired destination. Download and present our Future PowerPoint Templates because You can Connect the dots. Fan expectations as the whole picture emerges. Download our Success PowerPoint Templates because Our PowerPoint Templates and Slides are innately eco-friendly. Their high recall value negate the need for paper handouts. Download and present our Business PowerPoint Templates because It can Leverage your style with our PowerPoint Templates and Slides. Charm your audience with your ability. Download and present our Shapes PowerPoint Templates because Our PowerPoint Templates and Slides will let you Hit the right notes. Watch your audience start singing to your tune.Use these PowerPoint slides for presentations relating to Piggy Bank, finance, future, success, shapes, business. The prominent colors used in the PowerPoint template are Pink, Yellow, Black. Use our Growing Investment Money Finance PowerPoint Templates PPT Backgrounds For Slides 0113 are effectively colour coded to prioritise your plans They automatically highlight the sequence of events you desire. We assure you our future PowerPoint templates and PPT Slides provide you with a vast range of viable options. Select the appropriate ones and just fill in your text. The feedback we get is that our Growing Investment Money Finance PowerPoint Templates PPT Backgrounds For Slides 0113 will make you look like a winner. Customers tell us our finance PowerPoint templates and PPT Slides provide you with a vast range of viable options. Select the appropriate ones and just fill in your text. The feedback we get is that our Growing Investment Money Finance PowerPoint Templates PPT Backgrounds For Slides 0113 have awesome images to get your point across. You can be sure our PowerPoint templates and PPT Slides are effectively colour coded to prioritise your plans They automatically highlight the sequence of events you desire.

Save More Money As Compare To Expenses PowerPoint Templates Ppt Backgrounds For Slides 0313
We present our Save More Money As Compare To Expenses PowerPoint Templates PPT Backgrounds For Slides 0313.Download our Marketing PowerPoint Templates because You can Double your output with our PowerPoint Templates and Slides. They make beating deadlines a piece of cake. Download and present our Finance PowerPoint Templates because Our PowerPoint Templates and Slides are specially created by a professional team with vast experience. They diligently strive to come up with the right vehicle for your brilliant Ideas. Present our People PowerPoint Templates because You can Connect the dots. Fan expectations as the whole picture emerges. Download our Business PowerPoint Templates because You canTake a leap off the starting blocks with our PowerPoint Templates and Slides. They will put you ahead of the competition in quick time. Present our Signs PowerPoint Templates because Our PowerPoint Templates and Slides will Embellish your thoughts. They will help you illustrate the brilliance of your ideas.Use these PowerPoint slides for presentations relating to Money compares concept. piggy bank and coins, marketing, business, finance, people, signs. The prominent colors used in the PowerPoint template are Yellow, White, Black.

Monthly Product Sales Analysis Dashboard Infographics PDF
This slide illustrates a dashboard for product sales review to measure to help business monitor and improve productivity, employee engagement and meet revenue targets. It covers product names with sales reps, lead conversion, response time and outbound calls. Showcasing this set of slides titled Monthly Product Sales Analysis Dashboard Infographics PDF. The topics addressed in these templates are Lead Conversion Rate, Outbound Calls, Sales Analysis Dashboard. All the content presented in this PPT design is completely editable. Download it and make adjustments in color, background, font etc. as per your unique business setting.
Project Tracking Cost Tracker Dashboard Elements PDF
The following slide highlights the cost analysis of various projects to perform feasibility analysis. It includes budgeted versus actual cost, project wise cost and revenue allocation etc. Showcasing this set of slides titled Project Tracking Cost Tracker Dashboard Elements PDF. The topics addressed in these templates are Budgeted Costs, Resource Allocation, Project Costs. All the content presented in this PPT design is completely editable. Download it and make adjustments in color, background, font etc. as per your unique business setting.

Customer Healthcare Service Management Dashboard Themes PDF
The slide shows a dashboard for health care consultant to effectively manage of booked appointments. It includes key elements such as review score, patients, appointment sin current month, recently attended appointments, monthly revenue, previous months attended meetings, etc. Showcasing this set of slides titled Customer Healthcare Service Management Dashboard Themes PDF. The topics addressed in these templates are Customer Healthcare Service, Management Dashboard. All the content presented in this PPT design is completely editable. Download it and make adjustments in color, background, font etc. as per your unique business setting.

Retail Outlet Annual Sales Dashboard Elements PDF
This slide shows the retail store annual dashboard which includes sales revenue, total customers average transaction value, average units per customer, sales by division top five articles by sold items bar chart, total customer and visitors line chart, sales by city, average price and unit per transaction line chart etc.Pitch your topic with ease and precision using this retail outlet annual sales dashboard elements pdf This layout presents information on Retail outlet annual sales dashboard It is also available for immediate download and adjustment. So, changes can be made in the color, design, graphics or any other component to create a unique layout.

Business Framework Model Economic Growth Marketing Diagram
Doll Up Your Thoughts With Our Business Framework Model Economic Growth Marketing Diagram Powerpoint Templates. They Will Make A Pretty Picture.
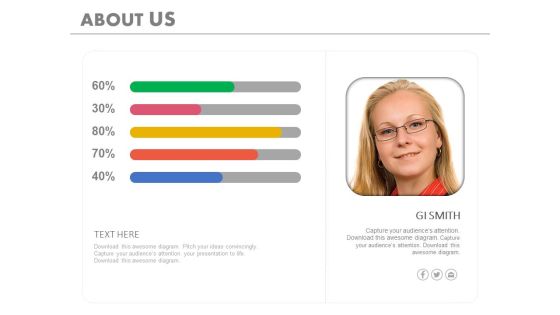
Overview Of Company Economic Analysis Powerpoint Slides
This PowerPoint template has been designed with employee picture and percentage tags. Download this PPT slide to depict company?s economic analysis. Make impressive presentation using this slide design.

Co Variety Advertisement Determine Partners Capability Dashboard Pictures PDF
This slide provides information regarding the dashboard for partners capability assessment in terms of revenue generated, capability scorecard etc. Deliver and pitch your topic in the best possible manner with this co variety advertisement determine partners capability dashboard pictures pdf. Use them to share invaluable insights on capability scorecard, plan acceptance, business plan target and impress your audience. This template can be altered and modified as per your expectations. So, grab it now.
Integrating Logistics Automation Solution Shipping And Logistics Tracking Dashboard With Shipments And Fleet Status Ppt Ideas Model PDF
This slide covers Key performance indicators to track the automation system of the company. This dashboard includes Logistics Efficiency Status, delivery time accuracy etc. Make sure to capture your audiences attention in your business displays with our gratis customizable Integrating Logistics Automation Solution Shipping And Logistics Tracking Dashboard With Shipments And Fleet Status Ppt Ideas Model PDF. These are great for business strategies, office conferences, capital raising or task suggestions. If you desire to acquire more customers for your tech business and ensure they stay satisfied, create your own sales presentation with these plain slides.
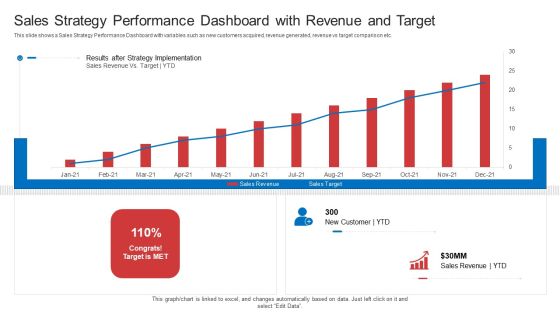
Strategic Plan To Increase Sales Volume And Revenue Sales Strategy Performance Dashboard With Revenue And Target Summary PDF
This slide shows a Sales Strategy Performance Dashboard with variables such as new customers acquired, revenue generated, revenue vs target comparison etc. Deliver and pitch your topic in the best possible manner with this strategic plan to increase sales volume and revenue sales strategy performance dashboard with revenue and target summary pdf. Use them to share invaluable insights on sales, revenue, target and impress your audience. This template can be altered and modified as per your expectations. So, grab it now.

Money Arrows Pointing Upwards Business PowerPoint Templates Ppt Backgrounds For Slides 0213
We present our Money Arrows Pointing Upwards Business PowerPoint Templates PPT Backgrounds For Slides 0213.Use our Arrows PowerPoint Templates because our PowerPoint Templates and Slides are the string of your bow. Fire of your ideas and conquer the podium. Download and present our Shapes PowerPoint Templates because You can Connect the dots. Fan expectations as the whole picture emerges. Use our Success PowerPoint Templates because You can Be the puppeteer with our PowerPoint Templates and Slides as your strings. Lead your team through the steps of your script. Download our Business PowerPoint Templates because You can Inspire your team with our PowerPoint Templates and Slides. Let the force of your ideas flow into their minds. Use our Signs PowerPoint Templates because You should Throw the gauntlet with our PowerPoint Templates and Slides. They are created to take up any challenge.Use these PowerPoint slides for presentations relating to Arrows growth, Business, Shapes, Arrows, Success, Signs. The prominent colors used in the PowerPoint template are Green, Blue, White.
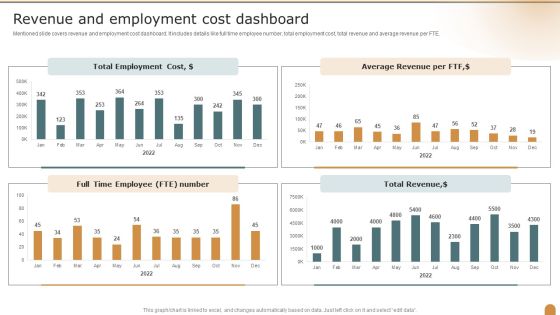
Revenue And Employment Cost Dashboard Company Performance Evaluation Using KPI Microsoft PDF
Mentioned slide covers revenue and employment cost dashboard. It includes details like full time employee number, total employment cost, total revenue and average revenue per FTE. Deliver and pitch your topic in the best possible manner with this Revenue And Employment Cost Dashboard Company Performance Evaluation Using KPI Microsoft PDF. Use them to share invaluable insights on Total Employment, Average Revenue, Dashboard and impress your audience. This template can be altered and modified as per your expectations. So, grab it now.
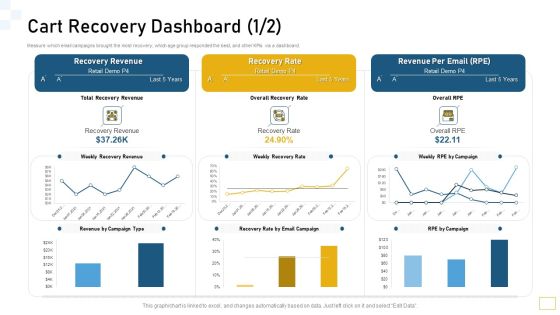
Guidelines Customer Conduct Assessment Cart Recovery Dashboard Demo Microsoft PDF
Measure which email campaigns brought the most recovery, which age group responded the best, and other KPIs via a dashboard. Deliver and pitch your topic in the best possible manner with this guidelines customer conduct assessment cart recovery dashboard demo microsoft pdf. Use them to share invaluable insights on recovery revenue, recovery rate, revenue per email and impress your audience. This template can be altered and modified as per your expectations. So, grab it now.
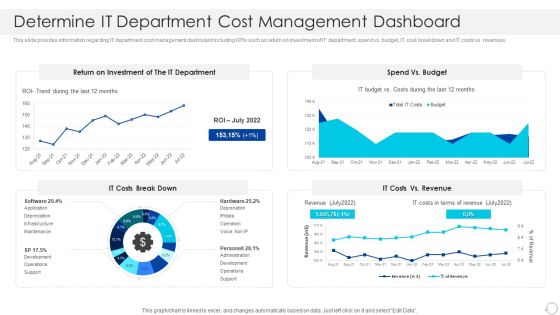
Determine IT Department Cost Management Dashboard Graphics PDF
This slide provides information regarding IT department cost management dashboard including KPIs such as return on investment of IT department, spend vs. budget, IT cost breakdown and IT costs vs. revenues. Deliver and pitch your topic in the best possible manner with this Determine IT Department Cost Management Dashboard Graphics PDF. Use them to share invaluable insights on Investment, Budget, Revenue and impress your audience. This template can be altered and modified as per your expectations. So, grab it now.

Organization Reinvention Digital Finance Dashboard Clipart PDF
This slide covers the advanced technologies entering the market from past few decades. The combinatorial effects of base technologies, such as mobile, cloud, sensors, analytics and the Internet of Things IoT, are accelerating progress exponentially. This slide covers transformation dashboard covering various stages of a business along with the budget and risks involved at every stage. Deliver and pitch your topic in the best possible manner with this Organization Reinvention Digital Finance Dashboard Clipart PDF. Use them to share invaluable insights on Revenue By Channels, Operating Cost, Digital Budget and impress your audience. This template can be altered and modified as per your expectations. So, grab it now.

Working Capital Report Days Of Cash Conversion Ppt PowerPoint Presentation Ideas Graphics
Presenting this set of slides with name working capital report days of cash conversion ppt powerpoint presentation ideas graphics. The topics discussed in these slides are cash flow, fund flow, trading cycle. This is a completely editable PowerPoint presentation and is available for immediate download. Download now and impress your audience.

B2B Market Segmentation Dashboard Microsoft PDF
This slide illustrates the market segmentation dashboard for B2B which can benefit them to improve the focus and boost the revenue of the organization. It includes segmentation based in company size and different industries under B2B market. Pitch your topic with ease and precision using this B2B Market Segmentation Dashboard Microsoft PDF. This layout presents information on Industries, Market Segmentation, Service. It is also available for immediate download and adjustment. So, changes can be made in the color, design, graphics or any other component to create a unique layout.

Stock Photo Bundles Of Canadian Dollars PowerPoint Slide
This unique image slide portrays the concepts of finance, money, dollars etc. This image is well designed to display finance and global monetary policy in business presentations. Create a positive impact on viewers by using this professional image slide in your presentations.

Crm Dashboard Actual Vs Target Revenue Ppt PowerPoint Presentation Professional Tips
This is a crm dashboard actual vs target revenue ppt powerpoint presentation professional tips. This is a three stage process. The stages in this process are actual, target.

Develop Business Strategy Image Of Green Euro Sign Medium Exchange Stock Photos
Draw It Out On Our Develop Business Strategy Image Of Green Euro Sign Medium Exchange Stock Photos Powerpoint Templates. Provide Inspiration To Your Colleagues.
Stock Photo Business Strategy Review Growth Ladders On Bar Graph Icons
Our Stock Photo Business Strategy Review Growth Ladders On Bar Graph Icons Powerpoint Templates Allow You To Do It With Ease. Just Like Picking The Low Hanging Fruit.

Deliver Efficiency Innovation Measuring Business Unit Performance Dashboard Background PDF
This slide covers dashboard that shows business unit performance such as new customers, average weekly sales revenue, sales revenues, profits, customer lifetime value, etc. Deliver an awe inspiring pitch with this creative Deliver Efficiency Innovation Measuring Business Unit Performance Dashboard Background PDF bundle. Topics like Customer Lifetime Value, Customer Acquisition Cost, Average Revenue Per Unit, Above Sales Target YTD can be discussed with this completely editable template. It is available for immediate download depending on the needs and requirements of the user.

Market Research Summary Dashboard Of Fmcg Industry Pictures PDF
The following slide highlights the market research report of FMCG which includes the sales by location, units per transaction and products sold. Showcasing this set of slides titled Market Research Summary Dashboard Of Fmcg Industry Pictures PDF. The topics addressed in these templates are Revenues, Net Profit, Sales. All the content presented in this PPT design is completely editable. Download it and make adjustments in color, background, font etc. as per your unique business setting.
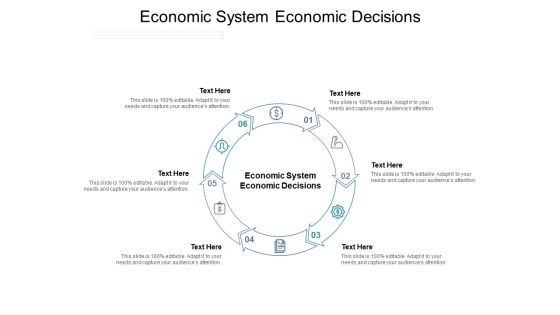
Economic System Economic Decisions Ppt PowerPoint Presentation Portfolio Graphics Pictures Cpb Pdf
Presenting this set of slides with name economic system economic decisions ppt powerpoint presentation portfolio graphics pictures cpb pdf. This is an editable Powerpoint six stages graphic that deals with topics like economic system economic decisions to help convey your message better graphically. This product is a premium product available for immediate download and is 100 percent editable in Powerpoint. Download this now and use it in your presentations to impress your audience.
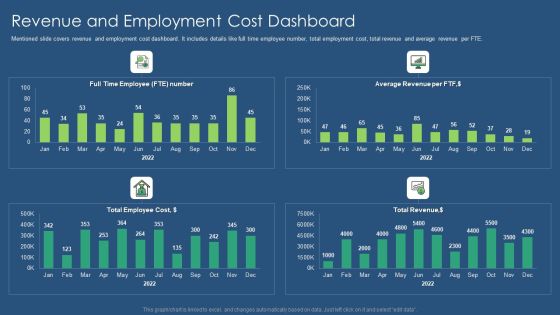
Sustainability Calculation With KPI Revenue And Employment Cost Dashboard Introduction PDF Professional PDF
Mentioned slide covers revenue and employment cost dashboard. It includes details like full time employee number, total employment cost, total revenue and average revenue per FTE. Deliver an awe inspiring pitch with this creative sustainability calculation with kpi revenue and employment cost dashboard introduction pdf bundle. Topics like full time employee, employee cost, revenue can be discussed with this completely editable template. It is available for immediate download depending on the needs and requirements of the user.

Sales Procedure Automation To Enhance Sales Dashboard Depicting Sales Kpis To Track Current Status Introduction PDF
This slide shows the dashboard that depicts sales KPIs to track current status which involves won and lost opportunities, revenues and pipeline by territory, sales by different products, etc.Deliver an awe inspiring pitch with this creative Sales Procedure Automation To Enhance Sales Dashboard Depicting Sales Kpis To Track Current Status Introduction PDF bundle. Topics like Won Opportunities, Total Opportunities, Pipeline Employee can be discussed with this completely editable template. It is available for immediate download depending on the needs and requirements of the user.

Performance Measuement Of Infrastructure Project Infrastructure KPI Dashboard Showing Project Revenue Brochure PDF
Presenting this set of slides with name performance measuement of infrastructure project infrastructure kpi dashboard showing project revenue brochure pdf. The topics discussed in these slide is infrastructure kpi dashboard showing project revenue. This is a completely editable PowerPoint presentation and is available for immediate download. Download now and impress your audience.

Cross Sell In Banking Industry Revenue Generation KPI Dashboard Ppt Infographic Template Portfolio PDF
Deliver and pitch your topic in the best possible manner with this cross sell in banking industry revenue generation kpi dashboard ppt infographic template portfolio pdf. Use them to share invaluable insights on revenue generation kpi dashboard and impress your audience. This template can be altered and modified as per your expectations. So, grab it now.

Cross Selling Of Retail Banking Products Revenue Generation KPI Dashboard Ppt Inspiration Rules PDF
Deliver and pitch your topic in the best possible manner with this cross selling of retail banking products revenue generation kpi dashboard ppt inspiration rules pdf. Use them to share invaluable insights on revenue generation kpi dashboard and impress your audience. This template can be altered and modified as per your expectations. So, grab it now.

Market Analysis Of Retail Sector Retail KPI Dashboard Showing Revenue Vs Units Sold Clipart PDF
Deliver an awe inspiring pitch with this creative market analysis of retail sector retail kpi dashboard showing revenue vs units sold clipart pdf bundle. Topics like retail kpi dashboard showing revenue vs units sold can be discussed with this completely editable template. It is available for immediate download depending on the needs and requirements of the user.

Construction Management Services Infrastructure KPI Dashboard Showing Project Revenue Ideas PDF
Deliver and pitch your topic in the best possible manner with this construction management services infrastructure kpi dashboard showing project revenue ideas pdf. Use them to share invaluable insights on infrastructure kpi dashboard showing project revenue and impress your audience. This template can be altered and modified as per your expectations. So, grab it now.
Social Media Performance Analytics Dashboard Ppt Styles Icons PDF
Following slide exhibits social media management statistics with website report. It includes multiple KPIs such as website traffic, followers on multiple social media platforms and site revenue. Showcasing this set of slides titled social media performance analytics dashboard ppt styles icons pdf. The topics addressed in these templates are site revenue, website traffic. All the content presented in this PPT design is completely editable. Download it and make adjustments in color, background, font etc. as per your unique business setting.

Formulating Money Laundering Determining Residual Risks Through Assessment Matrix Background PDF
This slide showcases assessment matrix to determine residual risks. It provides information about inherent risks, control assessment, satisfaction, visibility, risk management controls, data analytics, etc. Whether you have daily or monthly meetings, a brilliant presentation is necessary. Deploying Banking Transaction Determining Residual Risks Through Assessment Matrix Demonstration PDF can be your best option for Formulating Money Laundering Determining Residual Risks Through Assessment Matrix Background PDF and make yourself stand out in meetings. The template is versatile and follows a structure that will cater to your requirements. All the templates prepared by Slidegeeks are easy to download and edit. Our research experts have taken care of the corporate themes as well. So, give it a try and see the results.

Analyzing The Economic Economic Feasibility Analysis Checklist For Project Approval Pictures PDF
The following slide shows the economic analysis checklist that is necessary to evaluate the economic feasibility of the project. Various economic analysis checklist elements are cost effectiveness of the project, estimated cost of hardware and software elements, will the project meet the future market growth opportunities etc. Do you have an important presentation coming up Are you looking for something that will make your presentation stand out from the rest Look no further than Analyzing The Economic Economic Feasibility Analysis Checklist For Project Approval Pictures PDF. With our professional designs, you can trust that your presentation will pop and make delivering it a smooth process. And with Slidegeeks, you can trust that your presentation will be unique and memorable. So why wait Grab Analyzing The Economic Economic Feasibility Analysis Checklist For Project Approval Pictures PDF today and make your presentation stand out from the rest.

AI And ML Driving Monetary Value For Organization Customer Data Processing Workflow Guidelines PDF
This slide illustrates customer data processing workflow. It cover three stages namely detection, prediction and generation. This is a ai and ml driving monetary value for organization customer data processing workflow guidelines pdf template with various stages. Focus and dispense information on three stages using this creative set, that comes with editable features. It contains large content boxes to add your information on topics like tangible benefits, intangible benefits. You can also showcase facts, figures, and other relevant content using this PPT layout. Grab it now.

Tools For Improving Sales Plan Effectiveness Sales Strategy Performance Dashboard With Revenue And Target Professional PDF
This slide shows a Sales Strategy Performance Dashboard with variables such as new customers acquired, revenue generated, revenue vs target comparison etc. Deliver and pitch your topic in the best possible manner with this tools for improving sales plan effectiveness sales strategy performance dashboard with revenue and target professional pdf. Use them to share invaluable insights on sales, revenue, target and impress your audience. This template can be altered and modified as per your expectations. So, grab it now.

CRM Implementation Dashboard With Sales Pipeline And Revenue By Products Mockup PDF
The following slide showcases the CRM dashboard which includes leads, deals, sales revenue, revenue by products, total leads by source, total leads by status and lead distribution.Deliver an awe inspiring pitch with this creative CRM Implementation Dashboard With Sales Pipeline And Revenue By Products Mockup PDF bundle. Topics like Lead Distribution, Revenue By Products, Total Leads can be discussed with this completely editable template. It is available for immediate download depending on the needs and requirements of the user.

New Product Sales Strategy And Marketing KPI Dashboard To Monitor Sales Performance Information PDF
This slide shows sales performance monitoring dashboard. Metrics included in the dashboard are sales revenue, sales growth, average revenue per unit, customer lifetime value and customer acquisition cost. Deliver an awe inspiring pitch with this creative New Product Sales Strategy And Marketing KPI Dashboard To Monitor Sales Performance Information PDF bundle. Topics like Sales Revenue, Monthly Sales Growth, Sales Country Performance can be discussed with this completely editable template. It is available for immediate download depending on the needs and requirements of the user.
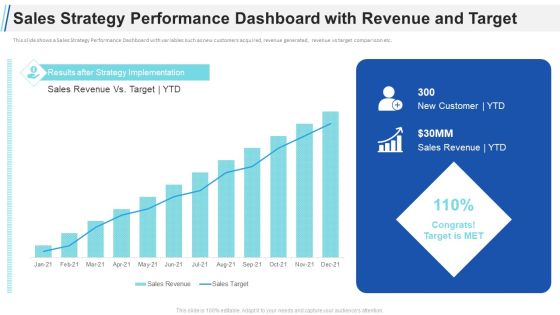
Maximizing Profitability Earning Through Sales Initiatives Sales Strategy Performance Dashboard With Revenue And Target Elements PDF
This slide shows a Sales Strategy Performance Dashboard with variables such as new customers acquired, revenue generated, revenue vs target comparison etc. Deliver and pitch your topic in the best possible manner with this maximizing profitability earning through sales initiatives sales strategy performance dashboard with revenue and target elements pdf. Use them to share invaluable insights on sales strategy performance dashboard with revenue and target and impress your audience. This template can be altered and modified as per your expectations. So, grab it now.

Client Health Score Analytical Dashboard Rules PDF
This slide gives an overview of customer health score in an organization along with net promoter score for users at various locations. It includes elements such as total customers, total monthly recurring revenue, average net promoter score etc. Showcasing this set of slides titled Client Health Score Analytical Dashboard Rules PDF. The topics addressed in these templates are Average Net Promoter, Average Customer Health, Healthy. All the content presented in this PPT design is completely editable. Download it and make adjustments in color, background, font etc. as per your unique business setting.
Product Management Team Performance Tracking KPI Dashboard Pictures PDF
This slide provides performance tracking dashboard for product development project team. It provides information regarding hours spent on project, deadlines, employee responsible, new leads and revenue generated. Pitch your topic with ease and precision using this Product Management Team Performance Tracking KPI Dashboard Pictures PDF. This layout presents information on Tracking KPI Dashboard, Product Management Team Performance. It is also available for immediate download and adjustment. So, changes can be made in the color, design, graphics or any other component to create a unique layout.

Customer Relationship Management Marketing Dashboard With Revenue Graph And Deals Funnel Ideas PDF
The following slides highlights the CRM marketing dashboard with provides key details about new contacts, campaign email sent, revenue graph and worth of new deals. Showcasing this set of slides titled customer relationship management marketing dashboard with revenue graph and deals funnel ideas pdf. The topics addressed in these templates are funnel, revenue graph, campaign. All the content presented in this PPT design is completely editable. Download it and make adjustments in color, background, font etc. as per your unique business setting.

BPO Call Center Company Profile Revenue Breakdown Of Services By Industries And Regions Professional PDF
This slide highlights the revenue breakdown of call center company on the basis of different industries and regions which include healthcare, telecom, manufacturing, BFSI, travel, ecommerce and retail sectors along with European, Russian and Asian regions. Deliver an awe inspiring pitch with this creative BPO Call Center Company Profile Revenue Breakdown Of Services By Industries And Regions Professional PDF bundle. Topics like Ecommerce Retail, Ecommerce Generates, Healthcare Comprises can be discussed with this completely editable template. It is available for immediate download depending on the needs and requirements of the user.

How To Build A Revenue Funnel Lead Scoring Dashboard Level Elements PDF
This slide provides information regarding the dashboard that depicts lead ranking information with leads qualification rating, leads interest level, etc. Deliver and pitch your topic in the best possible manner with this how to build a revenue funnel lead scoring dashboard level elements pdf. Use them to share invaluable insights on lead scoring dashboard and impress your audience. This template can be altered and modified as per your expectations. So, grab it now.
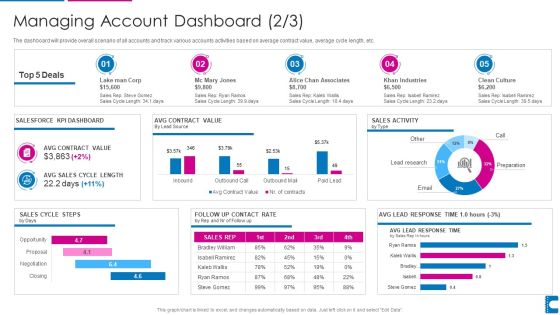
How To Administer Accounts To Increase Sales Revenue Managing Account Dashboard Themes PDF
The dashboard will provide overall scenario of all accounts and track various accounts activities based on average contract value, average cycle length, etc. Deliver an awe inspiring pitch with this creative how to administer accounts to increase sales revenue managing account dashboard themes pdf bundle. Topics like managing account dashboard can be discussed with this completely editable template. It is available for immediate download depending on the needs and requirements of the user.
Developing Brand Awareness To Gain Customer Attention Different Brands Performance Tracking Dashboard Introduction PDF
This slide provides information regarding different brands performance tracking dashboard in terms of brand metric, brand commitment, advertising metrics, and purchase metrics. Make sure to capture your audiences attention in your business displays with our gratis customizable Developing Brand Awareness To Gain Customer Attention Different Brands Performance Tracking Dashboard Introduction PDF. These are great for business strategies, office conferences, capital raising or task suggestions. If you desire to acquire more customers for your tech business and ensure they stay satisfied, create your own sales presentation with these plain slides.

Stock Photo New Business Strategy Gold Eagle Coin Of America Stock Images
Discover Decisive Moments With Our stock photo new business strategy gold eagle coin of america stock images Powerpoint Templates. They Help Make That Crucial Difference. Our Signs Powerpoint Templates Will Help Make Your Dreams Come True. Your Thoughts Will Weave The Magic For You.

Sales Revenue And Profit Growth Analysis Dashboard Icon Ppt Outline Mockup PDF
Presenting Sales Revenue And Profit Growth Analysis Dashboard Icon Ppt Outline Mockup PDF to dispense important information. This template comprises three stages. It also presents valuable insights into the topics including Sales, Revenue And Profit, Growth Analysis, Dashboard Icon. This is a completely customizable PowerPoint theme that can be put to use immediately. So, download it and address the topic impactfully.

Sales Revenue And Gross Growth Analysis Dashboard Ppt Inspiration Background Image PDF
The following slide highlights the sales revenue and gross margin growth dashboard illustrating key headings which includes gross margin, total revenue, total client, total product, gross margin trend, gross margin growth, monthly gross margin, monthly revenue, yearly revenue growth and gross margin growth trend by product. Showcasing this set of slides titled Sales Revenue And Gross Growth Analysis Dashboard Ppt Inspiration Background Image PDF. The topics addressed in these templates are Gross Margin, Total Revenue, Total Clients. All the content presented in this PPT design is completely editable. Download it and make adjustments in color, background, font etc. as per your unique business setting.

Dashboard Related To The Company Products And Operations Revenue Ppt Portfolio Deck PDF
Deliver and pitch your topic in the best possible manner with this dashboard related to the company products and operations revenue ppt portfolio deck pdf. Use them to share invaluable insights on dashboard related to the company products and operations and impress your audience. This template can be altered and modified as per your expectations. So, grab it now.

Formulating Money Laundering Blockchain Technology For Aml Transactions And Alerts Inspiration PDF
This slide showcases blockchain technology for anti money laundering AML and transaction monitoring. It provides information about transaction subsets, input data, monitoring, analysis, alerts, record, red flags, Want to ace your presentation in front of a live audience Our Formulating Money Laundering Blockchain Technology For Aml Transactions And Alerts Inspiration PDF can help you do that by engaging all the users towards you. Slidegeeks experts have put their efforts and expertise into creating these impeccable powerpoint presentations so that you can communicate your ideas clearly. Moreover, all the templates are customizable, and easy-to-edit and downloadable. Use these for both personal and commercial use.
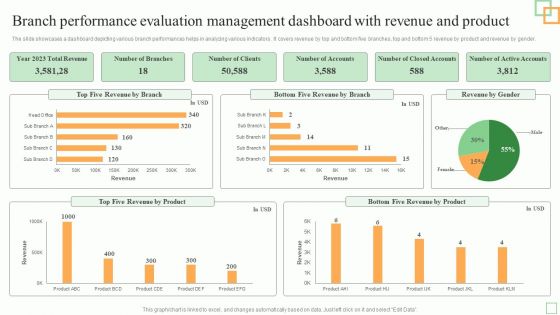
Branch Performance Evaluation Management Dashboard With Revenue And Product Mockup PDF
Pitch your topic with ease and precision using this Branch Performance Evaluation Management Dashboard With Revenue And Product Mockup PDF. This layout presents information on Five Revenue, Revenue Product, Total Revenue. It is also available for immediate download and adjustment. So, changes can be made in the color, design, graphics or any other component to create a unique layout.
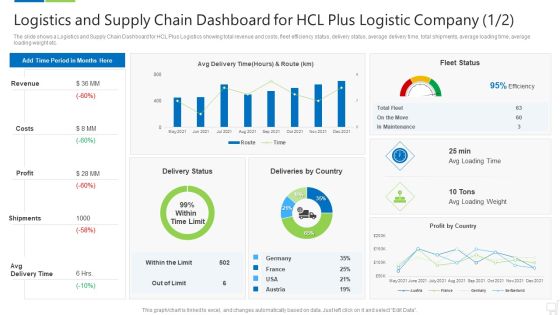
Logistics And Supply Chain Dashboard For Hcl Plus Logistic Company Revenue Structure PDF
The slide shows a Logistics and Supply Chain Dashboard for HCL Plus Logistics showing total revenue and costs, fleet efficiency status, delivery status, average delivery time, total shipments, average loading time, average loading weight etc. Deliver and pitch your topic in the best possible manner with this logistics and supply chain dashboard for hcl plus logistic company revenue structure pdf. Use them to share invaluable insights on logistics and supply chain dashboard for hcl plus logistic company and impress your audience. This template can be altered and modified as per your expectations. So, grab it now.
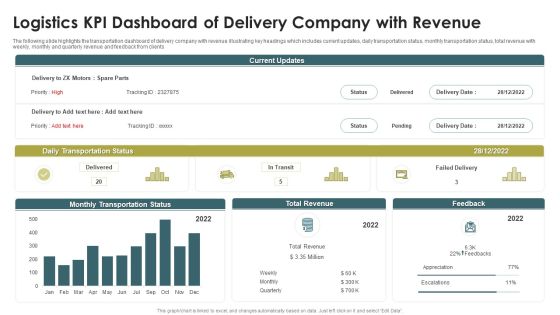
Logistics KPI Dashboard Of Delivery Company With Revenue Ppt Show PDF
The following slide highlights the transportation dashboard of delivery company with revenue illustrating key headings which includes current updates, daily transportation status, monthly transportation status, total revenue with weekly, monthly and quarterly revenue and feedback from clients. Showcasing this set of slides titled Logistics KPI Dashboard Of Delivery Company With Revenue Ppt Show PDF. The topics addressed in these templates are Daily Transportation Status, Monthly Transportation Status, Total Revenue. All the content presented in this PPT design is completely editable. Download it and make adjustments in color, background, font etc. as per your unique business setting.

Buzzfeed Capital Raising Elevator Pitch Deck Revenue Model Pictures PDF
This slide depicts BuzzFeeds revenue model and premium services which includes advertising as content, distribution promotion, etc. Presenting buzzfeed capital raising elevator pitch deck revenue model pictures pdf to provide visual cues and insights. Share and navigate important information on five stages that need your due attention. This template can be used to pitch topics like revenue model. In addtion, this PPT design contains high resolution images, graphics, etc, that are easily editable and available for immediate download.
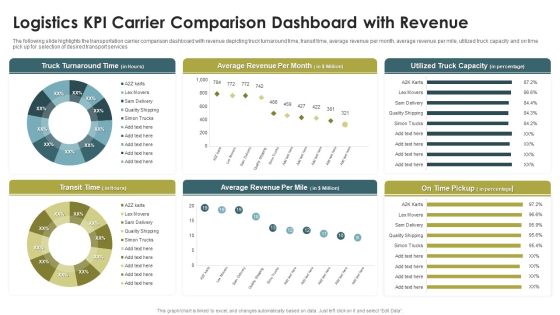
Logistics KPI Carrier Comparison Dashboard With Revenue Ppt Infographics Portfolio PDF
The following slide highlights the transportation carrier comparison dashboard with revenue depicting truck turnaround time, transit time, average revenue per month, average revenue per mile, utilized truck capacity and on time pick up for selection of desired transport services. Pitch your topic with ease and precision using this Logistics KPI Carrier Comparison Dashboard With Revenue Ppt Infographics Portfolio PDF. This layout presents information on Truck Turnaround Time, Average Revenue, Per Month, Transit Time. It is also available for immediate download and adjustment. So, changes can be made in the color, design, graphics or any other component to create a unique layout.
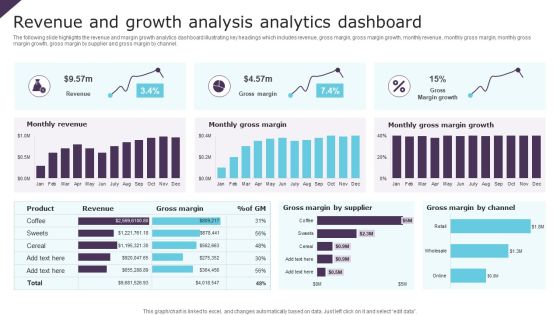
Revenue And Growth Analysis Analytics Dashboard Ppt Infographic Template Brochure PDF
The following slide highlights the revenue and margin growth analytics dashboard illustrating key headings which includes revenue, gross margin, gross margin growth, monthly revenue, monthly gross margin, monthly gross margin growth, gross margin by supplier and gross margin by channel. Pitch your topic with ease and precision using this Revenue And Growth Analysis Analytics Dashboard Ppt Infographic Template Brochure PDF. This layout presents information on Monthly Revenue, Monthly Gross Margin, Gross Margin Growth. It is also available for immediate download and adjustment. So, changes can be made in the color, design, graphics or any other component to create a unique layout.

Implementing Marketing Mix Strategy To Enhance Overall Performance Social Media Dashboard To Understand Marketing Efforts Guidelines PDF
The following dashboard helps the organization in analyzing the key metrics to track performance of their social media digital marketing strategy, these metrics are followers, likes and visits. Deliver and pitch your topic in the best possible manner with this Implementing Marketing Mix Strategy To Enhance Overall Performance Social Media Dashboard To Understand Marketing Efforts Guidelines PDF. Use them to share invaluable insights on Sales, New Customer, New Revenue and impress your audience. This template can be altered and modified as per your expectations. So, grab it now.
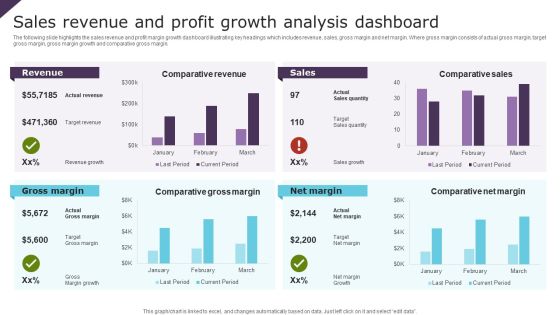
Sales Revenue And Profit Growth Analysis Dashboard Ppt Portfolio Slide PDF
The following slide highlights the sales revenue and profit margin growth dashboard illustrating key headings which includes revenue, sales, gross margin and net margin. Where gross margin consists of actual gross margin, target gross margin, gross margin growth and comparative gross margin. Showcasing this set of slides titled Sales Revenue And Profit Growth Analysis Dashboard Ppt Portfolio Slide PDF. The topics addressed in these templates are Revenue, Sales, Gross Margin, Net Margin. All the content presented in this PPT design is completely editable. Download it and make adjustments in color, background, font etc. as per your unique business setting.
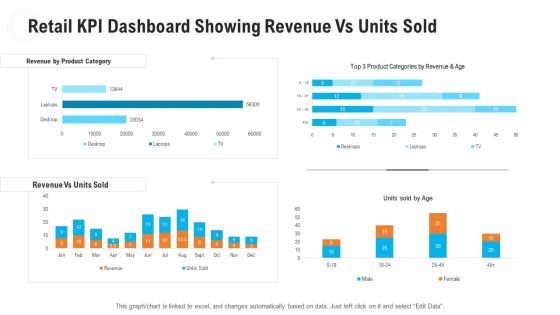
Retail Industry Outlook Retail KPI Dashboard Showing Revenue Vs Units Sold Clipart PDF
Deliver and pitch your topic in the best possible manner with this retail industry outlook retail KPI dashboard showing revenue vs units sold clipart pdf. Use them to share invaluable insights on revenue by product category, revenue vs units sold and impress your audience. This template can be altered and modified as per your expectations. So, grab it now.

Return On Promotional Investments Dashboard For Marketing Campaign Pictures PDF
This slide covers dashboard showing ROI from several campaigns. It also includes revenue earned, total campaign cost, lead conversion rate, CTR, average CPC, average lead and deal acquisition cost with graph on ROI by Google ads campaign.Showcasing this set of slides titled Return On Promotional Investments Dashboard For Marketing Campaign Pictures PDF. The topics addressed in these templates are Campaign Cost, Lead Conversion, Acquisition Cost. All the content presented in this PPT design is completely editable. Download it and make adjustments in color, background, font etc. as per your unique business setting.
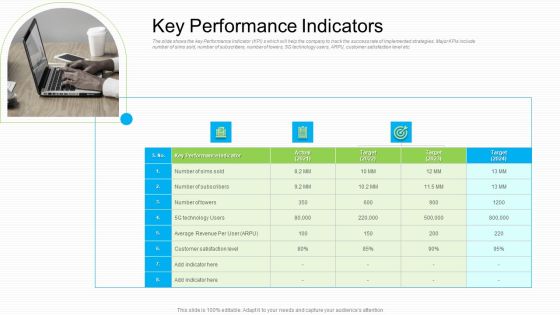
Lowering Sales Revenue A Telecommunication Firm Case Competition Key Performance Indicators Designs PDF
The slide shows the key Performance Indicator KPI s which will help the company to track the success rate of implemented strategies. Major KPIs include number of sims sold, number of subscribers, number of towers, 5G technology users, ARPU, customer satisfaction level etc. This is a lowering sales revenue a telecommunication firm case competition key performance indicators designs pdf template with various stages. Focus and dispense information on one stage using this creative set, that comes with editable features. It contains large content boxes to add your information on topics like average revenue, target, 2021 to 2024. You can also showcase facts, figures, and other relevant content using this PPT layout. Grab it now.

Stock Photo Business Plan And Strategy Get Good Tax Refund Clipart
Your Listeners Will Never Doodle. Our stock photo business plan and strategy get good tax refund stock photo clipart Powerpoint Templates Will Hold Their Concentration. Do The One Thing With Your Thoughts. Uphold Custom With Our Services Powerpoint Templates.

Crm Dashboard Actual Vs Target Revenue Ppt PowerPoint Presentation Outline Example File
This is a crm dashboard actual vs target revenue ppt powerpoint presentation outline example file. This is a three stage process. The stages in this process are actual, target.

Dashboard To Track Sales Revenue Growth And New Customer Acquisition Guidelines PDF
Showcasing this set of slides titled Dashboard To Track Sales Revenue Growth And New Customer Acquisition Guidelines PDF. The topics addressed in these templates are New Customer, Sales Revenue, Congrats Target. All the content presented in this PPT design is completely editable. Download it and make adjustments in color, background, font etc. as per your unique business setting.

Revenue And Expense Budget Deficit Analysis With KPI Dashboard Rules PDF
Showcasing this set of slides titled Revenue And Expense Budget Deficit Analysis With KPI Dashboard Rules PDF. The topics addressed in these templates are Revenue And Expense, Budget Deficit Analysis. All the content presented in this PPT design is completely editable. Download it and make adjustments in color, background, font etc. as per your unique business setting.

Brand Revenue Comparative Analysis With Net Promoter Score Dashboard Mockup PDF
This slide illustrates graphical representation of revenue of three brands. It includes weekly revenue line graphs and net promoter score by age of customers.Pitch your topic with ease and precision using this Brand Revenue Comparative Analysis With Net Promoter Score Dashboard Mockup PDF. This layout presents information on Brand Revenue Comparative Analysis With Net Promoter Score Dashboard. It is also available for immediate download and adjustment. So, changes can be made in the color, design, graphics or any other component to create a unique layout.

Business Performance Review Dashboard To Measure Overall Business Performance Formats PDF
The following slide highlights a comprehensive quarterly business review QBR dashboard which can be used by the organization to evaluate business performance. The metrics used for review are total revenue, new customers, gross profit, overall costs, sales comparison, sales by different products and top performing channels. Showcasing this set of slides titled Business Performance Review Dashboard To Measure Overall Business Performance Formats PDF. The topics addressed in these templates are Sales Comparison, Sales Product, High Performing. All the content presented in this PPT design is completely editable. Download it and make adjustments in color, background, font etc. as per your unique business setting.
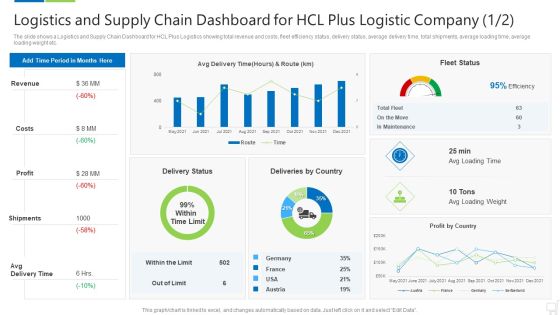
Logistics And Supply Chain Dashboard For Hcl Plus Logistic Company Revenue Themes PDF
The slide shows a Logistics and Supply Chain Dashboard for HCL Plus Logistics showing total revenue and costs, fleet efficiency status, delivery status, average delivery time, total shipments, average loading time, average loading weight etc. Deliver and pitch your topic in the best possible manner with this logistics and supply chain dashboard for hcl plus logistic company revenue themes pdf. Use them to share invaluable insights on revenue, costs, profit, shipments, avg delivery time and impress your audience. This template can be altered and modified as per your expectations. So, grab it now.
Consumer Journey Mapping Techniques Referral Program Performance Tracking Dashboard Formats PDF
This slide covers the KPI dashboard for analyzing referral campaign results. It includes metrics such as total revenue generated, monthly recurring revenue, new customers, clicks, cancelled customers, paying customers, etc. Showcasing this set of slides titled Consumer Journey Mapping Techniques Referral Program Performance Tracking Dashboard Formats PDF. The topics addressed in these templates are Revenue, New Customers, Paying Customers. All the content presented in this PPT design is completely editable. Download it and make adjustments in color, background, font etc. as per your unique business setting.

Docsend Capital Raising Pitch Deck Revenue Model Pictures PDF
This slide depicts DocSends revenue model which includes corporate branding, team control, data and API access, etc.Presenting Docsend Capital Raising Pitch Deck Revenue Model Pictures PDF to provide visual cues and insights. Share and navigate important information on eight stages that need your due attention. This template can be used to pitch topics like Advances Security, Corporate Branding, Team Control In addtion, this PPT design contains high resolution images, graphics, etc, that are easily editable and available for immediate download.

Expansion Strategic Plan Dashboard To Track Revenue After Global Expansion Rules PDF
This slide showcase dashboard that can help organization track revenue after global expansion. Its key components are average revenue per customer, customer acquisition cost, customer lifetime value and new customers acquired. Create an editable Expansion Strategic Plan Dashboard To Track Revenue After Global Expansion Rules PDF that communicates your idea and engages your audience. Whether youre presenting a business or an educational presentation, pre-designed presentation templates help save time. Expansion Strategic Plan Dashboard To Track Revenue After Global Expansion Rules PDF is highly customizable and very easy to edit, covering many different styles from creative to business presentations. Slidegeeks has creative team members who have crafted amazing templates. So, go and get them without any delay.

Stock Photo Piggy Bank And Folder Saving Concept PowerPoint Slide
This image slide displays piggy banks for saving concept. This image slide has been crafted with graphic of pink color piggy banks with folder and dollar symbol. Use this imager slide, in your presentations to express views on monetary savings, finance and storage. This image slide will enhance the quality of your presentations.

Stock Photo Piggy Banks Green Folder PowerPoint Slide
This image slide displays piggy banks for saving concept. This image slide has been crafted with graphic of glossy pink color piggy banks with folder and dollar symbol. Use this imager slide, in your presentations to express views on monetary savings, finance and storage. This image slide will enhance the quality of your presentations.

Business Profitability And Growth Dashboard For Capital Fundraising Ppt Slides Guide PDF
This slide illustrates graphical representation of company growth journey for investors. It includes profitability graph of 15 years, cash usage pie-chart, and share performance line graph. Showcasing this set of slides titled Business Profitability And Growth Dashboard For Capital Fundraising Ppt Slides Guide PDF. The topics addressed in these templates are Judicious Cash Usage, Share Performance, Respect To Benchmark. All the content presented in this PPT design is completely editable. Download it and make adjustments in color, background, font etc. as per your unique business setting.

Icon For Activity Management And Revenue Customer Relationship Management Dashboard Slides PDF
Persuade your audience using this Icon For Activity Management And Revenue Customer Relationship Management Dashboard Slides PDF. This PPT design covers three stages, thus making it a great tool to use. It also caters to a variety of topics including Icon For Activity Management, Revenue Customer Relationship, Management Dashboard. Download this PPT design now to present a convincing pitch that not only emphasizes the topic but also showcases your presentation skills.
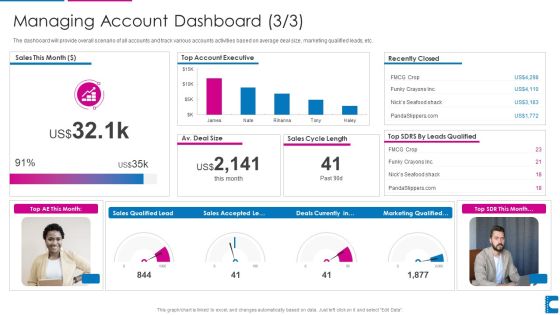
How To Administer Accounts To Increase Sales Revenue Managing Account Dashboard Executive Infographics PDF
The dashboard will provide overall scenario of all accounts and track various accounts activities based on average deal size, marketing qualified leads, etc. Deliver and pitch your topic in the best possible manner with this how to administer accounts to increase sales revenue managing account dashboard executive infographics pdf. Use them to share invaluable insights on account executive, sales, marketing and impress your audience. This template can be altered and modified as per your expectations. So, grab it now.
Sales Funnel Management For Revenue Generation Tracking Customer Sales Funnel Dashboard Information PDF
This slide covers information regarding the customer sales funnel tracking with sales volume and total market. Deliver an awe inspiring pitch with this creative sales funnel management for revenue generation tracking customer sales funnel dashboard information pdf bundle. Topics like tracking customer sales funnel dashboard can be discussed with this completely editable template. It is available for immediate download depending on the needs and requirements of the user.
Sales Funnel Management For Revenue Generation Tracking Sales Pipeline And Lead Activity Dashboard Background PDF
This slide covers information regarding dashboard associated to tracking lead activity across sales pipeline. Deliver and pitch your topic in the best possible manner with this sales funnel management for revenue generation tracking sales pipeline and lead activity dashboard background pdf. Use them to share invaluable insights on team matterhorn, expansion opportunity, estimated value and impress your audience. This template can be altered and modified as per your expectations. So, grab it now.

Assessing International Market Dashboard To Track Revenue After Global Expansion Template PDF
This slide showcase dashboard that can help organization track revenue after global expansion. Its key components are average revenue per customer, customer acquisition cost, customer lifetime value and new customers acquired. Crafting an eye-catching presentation has never been more straightforward. Let your presentation shine with this tasteful yet straightforward Assessing International Market Dashboard To Track Revenue After Global Expansion Template PDF template. It offers a minimalistic and classy look that is great for making a statement. The colors have been employed intelligently to add a bit of playfulness while still remaining professional. Construct the ideal Assessing International Market Dashboard To Track Revenue After Global Expansion Template PDF that effortlessly grabs the attention of your audience Begin now and be certain to wow your customers.
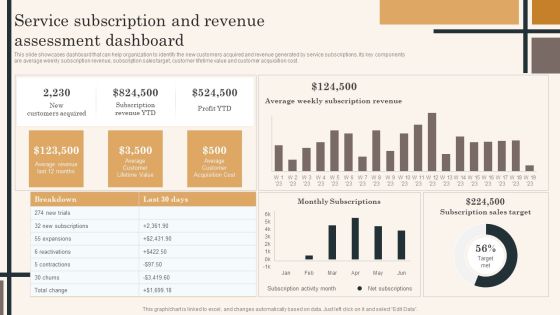
Edtech Service Launch And Promotion Plan Service Subscription And Revenue Assessment Dashboard Topics PDF
This slide showcases dashboard that can help organization to identify the new customers acquired and revenue generated by service subscriptions. Its key components are average weekly subscription revenue, subscription sales target, customer lifetime value and customer acquisition cost. Whether you have daily or monthly meetings, a brilliant presentation is necessary. Edtech Service Launch And Promotion Plan Service Subscription And Revenue Assessment Dashboard Topics PDF can be your best option for delivering a presentation. Represent everything in detail using Edtech Service Launch And Promotion Plan Service Subscription And Revenue Assessment Dashboard Topics PDF and make yourself stand out in meetings. The template is versatile and follows a structure that will cater to your requirements. All the templates prepared by Slidegeeks are easy to download and edit. Our research experts have taken care of the corporate themes as well. So, give it a try and see the results.
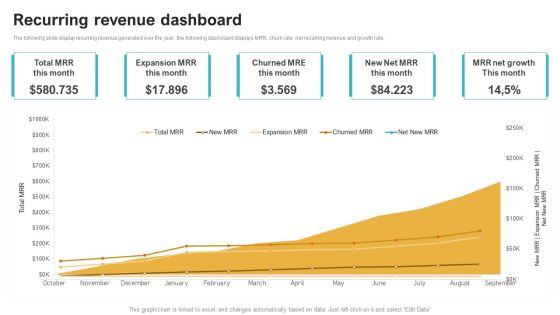
Saas Continuous Income Generation Model For Software Startup Recurring Revenue Dashboard Demonstration PDF
The following slide display recurring revenue generated over the year, the following dashboard displays MRR, churn rate net recurring revenue and growth rate. Explore a selection of the finest Saas Continuous Income Generation Model For Software Startup Recurring Revenue Dashboard Demonstration PDF here. With a plethora of professionally designed and pre made slide templates, you can quickly and easily find the right one for your upcoming presentation. You can use our Saas Continuous Income Generation Model For Software Startup Recurring Revenue Dashboard Demonstration PDF to effectively convey your message to a wider audience. Slidegeeks has done a lot of research before preparing these presentation templates. The content can be personalized and the slides are highly editable. Grab templates today from Slidegeeks.

Product Sales Analysis Dashboard Report Ppt PowerPoint Presentation Infographics Graphics Pictures PDF
Presenting this set of slides with name product sales analysis dashboard report ppt powerpoint presentation infographics graphics pictures pdf. The topics discussed in these slides are average operative costs, product models performance, production last year, sales by month, taxed amount. This is a completely editable PowerPoint presentation and is available for immediate download. Download now and impress your audience.
Operations Of Commercial Bank Dashboard Tracking Customer Activities And Revenue Generated Inspiration PDF
This slide contains dashboard that will allow bank to track the customer activities in terms of new customer acquired, customer acquisition cost and overall revenue generated. Deliver and pitch your topic in the best possible manner with this operations of commercial bank dashboard tracking customer activities and revenue generated inspiration pdf. Use them to share invaluable insights on avg revenue per customer, customers acquisition cost, compared to previous year and impress your audience. This template can be altered and modified as per your expectations. So, grab it now.
Executing Online Solution In Banking Dashboard Tracking Customer Activities And Revenue Generated Information PDF
This slide contains dashboard that will allow bank to track the customer activities in terms of new customer acquired, customer acquisition cost and overall revenue generated. Deliver and pitch your topic in the best possible manner with this executing online solution in banking dashboard tracking customer activities and revenue generated information pdf. Use them to share invaluable insights on compared to previous year, target achievement, customers acquisition, actual revenue and impress your audience. This template can be altered and modified as per your expectations. So, grab it now.

Key Components Critical To Devops Viability IT Devops Activities Management Dashboard Revenue Ideas PDF
This slide provides information regarding essential DevOps activities management dashboard in terms of revenue by hour, storefront users, errors by host, response time by app, etc. Deliver an awe inspiring pitch with this creative key components critical to devops viability it devops activities management dashboard revenue ideas pdf bundle. Topics like revenue by hour, storefront users, errors by host, response time by app can be discussed with this completely editable template. It is available for immediate download depending on the needs and requirements of the user.

Sustainability Calculation With KPI Customer Service Dashboard Revenue Ideas PDF Graphics PDF
Following slide illustrates customer service dashboard covering details such as request answered, total requests, total revenue and support cost revenue. It also includes customer satisfaction score, customer retention in a 12 months format. Deliver and pitch your topic in the best possible manner with this sustainability calculation with kpi customer service dashboard microsoft pdf. Use them to share invaluable insights on customer satisfaction, revenue, customer retention and impress your audience. This template can be altered and modified as per your expectations. So, grab it now.

Promotion Strategies For New Service Launch Service Subscription And Revenue Assessment Dashboard Mockup PDF
This slide showcases dashboard that can help organization to identify the new customers acquired and revenue generated by service subscriptions. Its key components are average weekly subscription revenue, subscription sales target, customer lifetime value and customer acquisition cost. There are so many reasons you need a Promotion Strategies For New Service Launch Service Subscription And Revenue Assessment Dashboard Mockup PDF. The first reason is you can not spend time making everything from scratch, Thus, Slidegeeks has made presentation templates for you too. You can easily download these templates from our website easily.

Dashboard To Track Revenue After Global Expansion Ppt PowerPoint Presentation File Example PDF
This slide showcase dashboard that can help organization track revenue after global expansion. Its key components are average revenue per customer, customer acquisition cost, customer lifetime value and new customers acquired.Take your projects to the next level with our ultimate collection of Dashboard To Track Revenue After Global Expansion Ppt PowerPoint Presentation File Example PDF. Slidegeeks has designed a range of layouts that are perfect for representing task or activity duration, keeping track of all your deadlines at a glance. Tailor these designs to your exact needs and give them a truly corporate look with your own brand colors they all make your projects stand out from the rest.
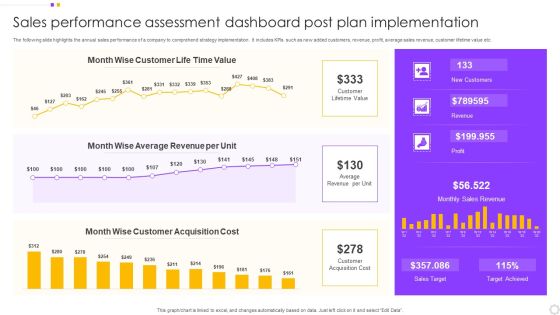
Sales Performance Assessment Dashboard Post Plan Implementation Introduction PDF
The following slide highlights the annual sales performance of a company to comprehend strategy implementation. It includes KPIs such as new added customers, revenue, profit, average sales revenue, customer lifetime value etc. Pitch your topic with ease and precision using this Sales Performance Assessment Dashboard Post Plan Implementation Introduction PDF. This layout presents information on Customer, Value, Average Revenue. It is also available for immediate download and adjustment. So, changes can be made in the color, design, graphics or any other component to create a unique layout.
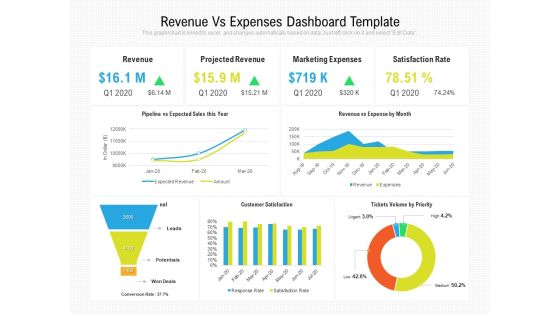
Revenue Vs Expenses Dashboard Template Ppt PowerPoint Presentation Slides Tips PDF
Presenting this set of slides with name revenue vs expenses dashboard template ppt powerpoint presentation slides tips pdf. The topics discussed in these slides are revenue, projected revenue, marketing expenses, satisfaction rate, pipeline vs expected sales this year, revenue vs expense by month, customer satisfaction, tickets volume by priority. This is a completely editable PowerPoint presentation and is available for immediate download. Download now and impress your audience.
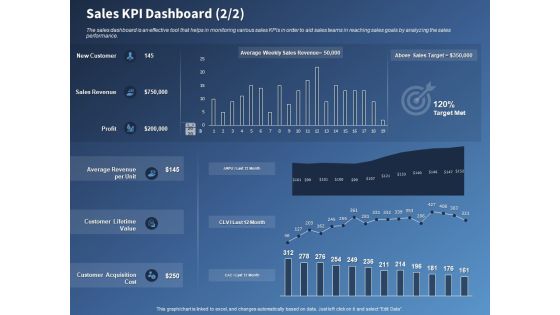
Performance Assessment Sales Initiative Report Sales KPI Dashboard Revenue Ppt Inspiration Slide Portrait PDF
Presenting this set of slides with name performance assessment sales initiative report sales kpi dashboard revenue ppt inspiration slide portrait pdf. The topics discussed in these slides are value, revenue, acquisition, cost. This is a completely editable PowerPoint presentation and is available for immediate download. Download now and impress your audience.
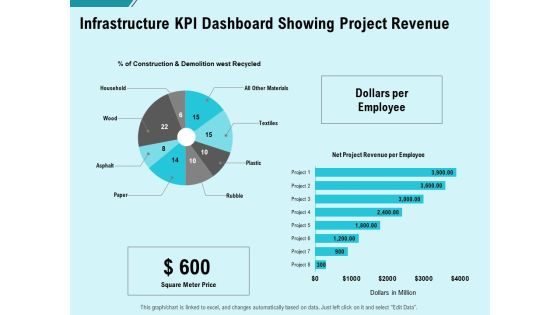
Facility Operations Contol Infrastructure Kpi Dashboard Showing Project Revenue Clipart PDF
Presenting this set of slides with name facility operations contol infrastructure kpi dashboard showing project revenue clipart pdf. The topics discussed in these slides are net project revenue per employee, construction and demolition west recycled. This is a completely editable PowerPoint presentation and is available for immediate download. Download now and impress your audience.

Construction Production Facilities Infrastructure KPI Dashboard Showing Project Revenue Elements PDF
Presenting this set of slides with name construction production facilities infrastructure kpi dashboard showing project revenue elements pdf. The topics discussed in these slides are net project revenue per employee, construction and demolition west recycled. This is a completely editable PowerPoint presentation and is available for immediate download. Download now and impress your audience.
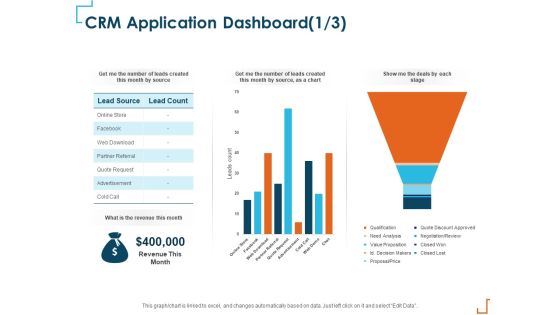
Introducing CRM Framework Within Organization CRM Application Dashboard Revenue Elements PDF
Presenting this set of slides with name introducing crm framework within organization crm application dashboard revenue elements pdf. The topics discussed in these slides are lead source, lead count, revenue, advertisement, quote request, partner referral. This is a completely editable PowerPoint presentation and is available for immediate download. Download now and impress your audience.
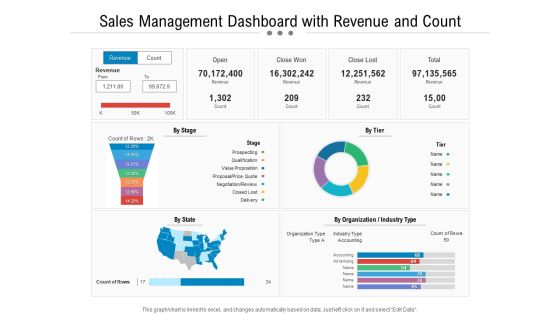
Sales Management Dashboard With Revenue And Count Ppt PowerPoint Presentation Layouts Template PDF
Presenting this set of slides with name sales management dashboard with revenue and count ppt powerpoint presentation layouts template pdf. The topics discussed in these slides are revenue, by organization, industry type, close won, close lost, by organization, industry type. This is a completely editable PowerPoint presentation and is available for immediate download. Download now and impress your audience.

Competition In Market Marketing Management Dashboard Revenue Ppt Ideas Templates PDF
Deliver an awe-inspiring pitch with this creative competition in market marketing management dashboard revenue ppt ideas templates pdf bundle. Topics like display, organic, paid, referral, revenue, roi per marketing channel can be discussed with this completely editable template. It is available for immediate download depending on the needs and requirements of the user.

Overview Of Hospitality Industry Hospitality Management KPI Dashboard Revenue Topics PDF
Deliver an awe inspiring pitch with this creative overview of hospitality industry hospitality management kpi dashboard revenue topics pdf bundle. Topics like employee, cost, revenue can be discussed with this completely editable template. It is available for immediate download depending on the needs and requirements of the user.
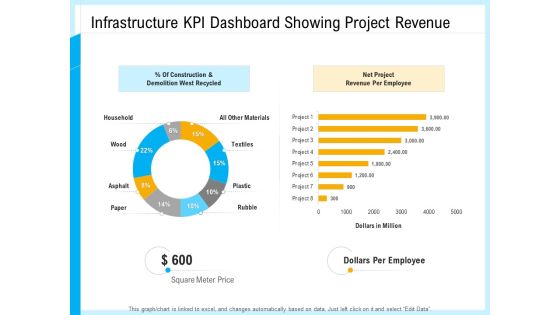
IT And Cloud Facilities Management Infrastructure KPI Dashboard Showing Project Revenue Net Project Template PDF
Deliver an awe-inspiring pitch with this creative it and cloud facilities management infrastructure kpi dashboard showing project revenue clipart pdf bundle. Topics like construction and demolition west recycled, household, other materials, net project, revenue per employee can be discussed with this completely editable template. It is available for immediate download depending on the needs and requirements of the user.

IT Infrastructure Governance Infrastructure KPI Dashboard Showing Project Revenue Ppt Infographic Template Guide PDF
Deliver and pitch your topic in the best possible manner with this it infrastructure governance infrastructure kpi dashboard showing project revenue ppt infographic template guide pdf. Use them to share invaluable insights on employee, revenue, construction, demolition, materials and impress your audience. This template can be altered and modified as per your expectations. So, grab it now.

Advertisement Administration Marketing Management Dashboard Revenue Ppt Gallery Layout Ideas PDF
Deliver an awe-inspiring pitch with this creative advertisement administration marketing management dashboard revenue ppt gallery layout ideas pdf bundle. Topics like display, organic, paid, referral, roi per marketing channel, spend, revenue, roi can be discussed with this completely editable template. It is available for immediate download depending on the needs and requirements of the user.
Strategic Marketing Plan Marketing Management Dashboard Revenue Ppt PowerPoint Presentation Icon Layout PDF
Deliver an awe-inspiring pitch with this creative strategic marketing plan marketing management dashboard revenue ppt powerpoint presentation icon layout pdf bundle. Topics like active customers, solid units, total revenue, net profit, customers region, new customer signups can be discussed with this completely editable template. It is available for immediate download depending on the needs and requirements of the user.

Substructure Segment Analysis Infrastructure KPI Dashboard Showing Project Revenue Summary PDF
Deliver and pitch your topic in the best possible manner with this substructure segment analysis infrastructure kpi dashboard showing project revenue summary pdf. Use them to share invaluable insights on square meter price, dollars per employee, net project revenue per employee and impress your audience. This template can be altered and modified as per your expectations. So, grab it now.
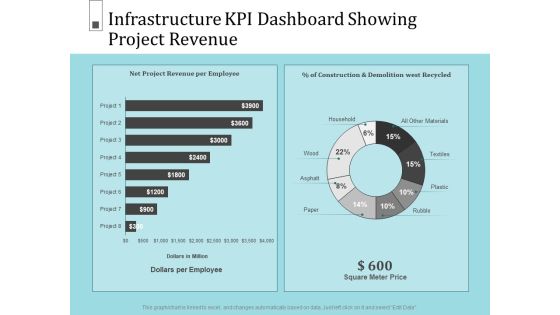
Infrastructure Project Management In Construction Infrastructure KPI Dashboard Showing Project Revenue Portrait PDF
Deliver an awe inspiring pitch with this creativeinfrastructure project management in construction infrastructure kpi dashboard showing project revenue portrait pdf. bundle. Topics like net project revenue per employee, construction and demolition west recycled, project can be discussed with this completely editable template. It is available for immediate download depending on the needs and requirements of the user.
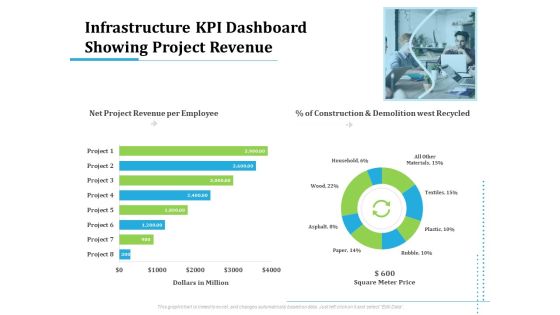
Information Technology Functions Management Infrastructure KPI Dashboard Showing Project Revenue Ppt Show Information PDF
Deliver an awe-inspiring pitch with this creative information technology functions management infrastructure kpi dashboard showing project revenue ppt show information pdf bundle. Topics like net project revenue per employee, construction and demolition west recycled, dollars million, square meter price, project can be discussed with this completely editable template. It is available for immediate download depending on the needs and requirements of the user.

Utilizing Infrastructure Management Using Latest Methods Infrastructure KPI Dashboard Showing Project Revenue Background PDF
Deliver an awe-inspiring pitch with this creative utilizing infrastructure management using latest methods infrastructure kpi dashboard showing project revenue background pdf bundle. Topics like net project revenue per employee, construction and demolition west recycled, dollars million, square meter price, project can be discussed with this completely editable template. It is available for immediate download depending on the needs and requirements of the user.
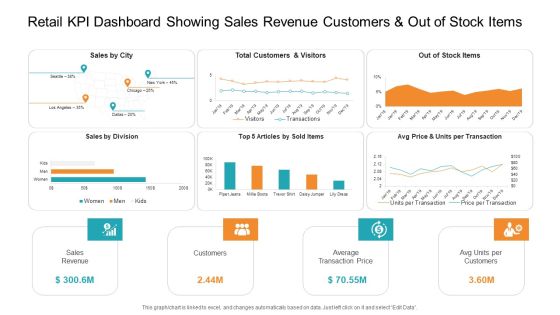
Retail KPI Dashboard Showing Sales Revenue Customers And Out Of Stock Items Introduction PDF
Deliver an awe-inspiring pitch with this creative retail KPI dashboard showing sales revenue customers and out of stock items introduction pdf. bundle. Topics like sales revenue, average transaction price, sales by division can be discussed with this completely editable template. It is available for immediate download depending on the needs and requirements of the user.
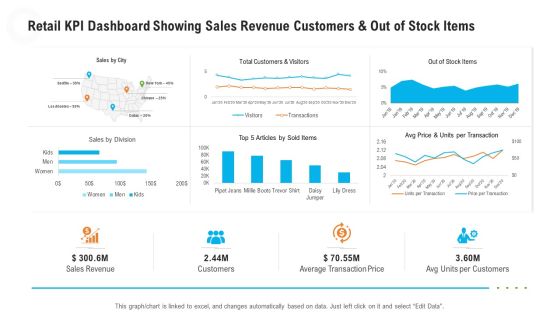
Retail KPI Dashboard Showing Sales Revenue Customers And Out Of Stock Items Guidelines PDF
Deliver an awe-inspiring pitch with this creative retail KPI dashboard showing sales revenue customers and out of stock items guidelines pdf. bundle. Topics like sales revenue, average transaction price can be discussed with this completely editable template. It is available for immediate download depending on the needs and requirements of the user.

Civil Infrastructure Designing Services Management Infrastructure Kpi Dashboard Showing Project Revenue Topics PDF
Deliver an awe inspiring pitch with this creative civil infrastructure designing services management infrastructure kpi dashboard showing project revenue topics pdf bundle. Topics like revenue, employee, materials can be discussed with this completely editable template. It is available for immediate download depending on the needs and requirements of the user.

Construction Management Services And Action Plan Infrastructure KPI Dashboard Showing Project Revenue Graphics PDF
Deliver an awe inspiring pitch with this creative construction management services and action plan infrastructure kpi dashboard showing project revenue graphics pdf bundle. Topics like construction and demolition west recycled, net project revenue per employee can be discussed with this completely editable template. It is available for immediate download depending on the needs and requirements of the user.
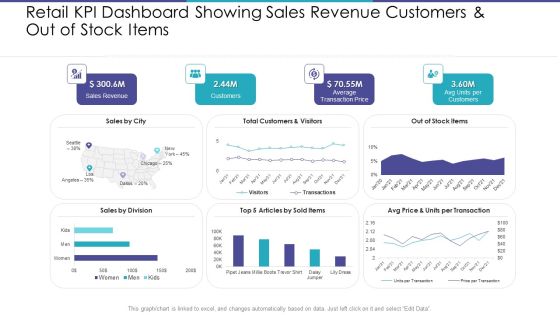
Retail KPI Dashboard Showing Sales Revenue Customers And Out Of Stock Items Elements PDF
Deliver an awe-inspiring pitch with this creative retail kpi dashboard showing sales revenue customers and out of stock items elements pdf. bundle. Topics like sales revenue, average transaction price, avg units per customers can be discussed with this completely editable template. It is available for immediate download depending on the needs and requirements of the user.

Infrastructure Building Administration Infrastructure KPI Dashboard Showing Project Revenue Clipart PDF
Deliver an awe inspiring pitch with this creative infrastructure building administration infrastructure kpi dashboard showing project revenue clipart pdf bundle. Topics like square meter price, net project revenue per employee, dollars per employee can be discussed with this completely editable template. It is available for immediate download depending on the needs and requirements of the user.

Digital Marketing Dashboard With Conversions And Revenue Growth Rate Ppt Outline Elements PDF
Deliver and pitch your topic in the best possible manner with this digital marketing dashboard with conversions and revenue growth rate ppt outline elements pdf. Use them to share invaluable insights on revenue, cost, growth, value and impress your audience. This template can be altered and modified as per your expectations. So, grab it now.

Dashboard Related To The Company Products And Operations Revenue Rules PDF
Deliver and pitch your topic in the best possible manner with this dashboard related to the company products and operations revenue rules pdf. Use them to share invaluable insights on area population, largest bottler, employees, net revenue, vending equipment and impress your audience. This template can be altered and modified as per your expectations. So, grab it now.

Managing New Service Roll Out And Marketing Procedure Service Subscription And Revenue Assessment Dashboard Themes PDF
Deliver an awe inspiring pitch with this creative Managing New Service Roll Out And Marketing Procedure Service Subscription And Revenue Assessment Dashboard Themes PDF bundle. Topics like New Customers Acquired, Subscription Revenue, Profit can be discussed with this completely editable template. It is available for immediate download depending on the needs and requirements of the user.
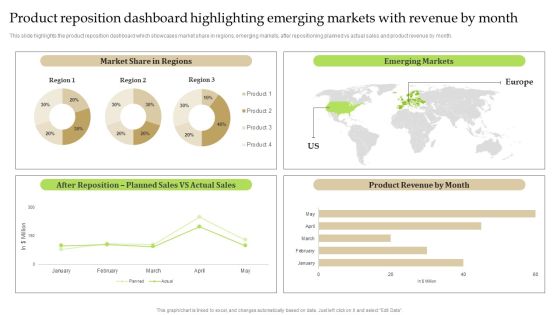
Product Reposition Dashboard Highlighting Emerging Markets With Revenue By Month Brochure PDF
This slide highlights the product reposition dashboard which showcases market share in regions, emerging markets, after repositioning planned vs actual sales and product revenue by month. Are you searching for a Product Reposition Dashboard Highlighting Emerging Markets With Revenue By Month Brochure PDF that is uncluttered, straightforward, and original Its easy to edit, and you can change the colors to suit your personal or business branding. For a presentation that expresses how much effort you have put in, this template is ideal. With all of its features, including tables, diagrams, statistics, and lists, its perfect for a business plan presentation. Make your ideas more appealing with these professional slides. Download Product Reposition Dashboard Highlighting Emerging Markets With Revenue By Month Brochure PDF from Slidegeeks today.
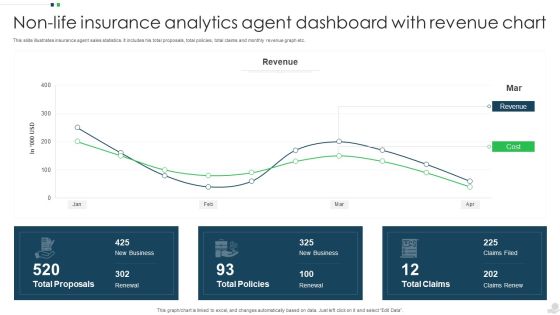
Non Life Insurance Analytics Agent Dashboard With Revenue Chart Infographics PDF
This slide illustrates insurance agent sales statistics. It includes his total proposals, total policies, total claims and monthly revenue graph etc. Showcasing this set of slides titled Non Life Insurance Analytics Agent Dashboard With Revenue Chart Infographics PDF. The topics addressed in these templates are Revenue, Cost, Total Proposals. All the content presented in this PPT design is completely editable. Download it and make adjustments in color, background, font etc. as per your unique business setting.
Product Sales Performance Tracking Dashboard Introduction PDF
This slide provides information regarding dashboard utilized by firm to monitor sales performance of products offered. The performance is tracked through revenues generated, online vs offline purchases, cost of goods sold, etc. Are you in need of a template that can accommodate all of your creative concepts This one is crafted professionally and can be altered to fit any style. Use it with Google Slides or PowerPoint. Include striking photographs, symbols, depictions, and other visuals. Fill, move around, or remove text boxes as desired. Test out color palettes and font mixtures. Edit and save your work, or work with colleagues. Download Product Sales Performance Tracking Dashboard Introduction PDF and observe how to make your presentation outstanding. Give an impeccable presentation to your group and make your presentation unforgettable.
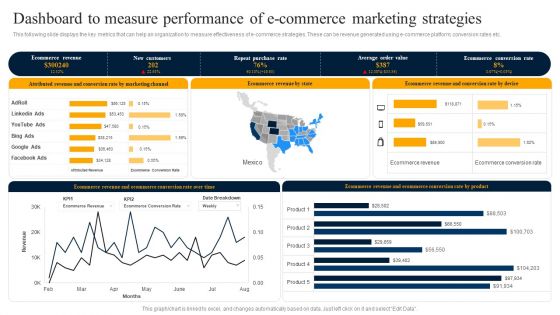
Dashboard To Measure Performance Of E Commerce Marketing Strategies Rules PDF
This following slide displays the key metrics that can help an organization to measure effectiveness of e commerce strategies. These can be revenue generated using e commerce platform, conversion rates etc. Whether you have daily or monthly meetings, a brilliant presentation is necessary. Dashboard To Measure Performance Of E Commerce Marketing Strategies Rules PDF can be your best option for delivering a presentation. Represent everything in detail using Dashboard To Measure Performance Of E Commerce Marketing Strategies Rules PDF and make yourself stand out in meetings. The template is versatile and follows a structure that will cater to your requirements. All the templates prepared by Slidegeeks are easy to download and edit. Our research experts have taken care of the corporate themes as well. So, give it a try and see the results.
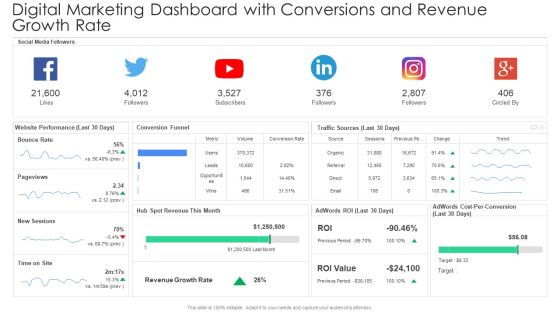
Digital Marketing Dashboard With Conversions And Revenue Growth Rate Template PDF
Deliver and pitch your topic in the best possible manner with this digital marketing dashboard with conversions and revenue growth rate template pdf. Use them to share invaluable insights on bounce rate, pageviews, new sessions and impress your audience. This template can be altered and modified as per your expectations. So, grab it now.
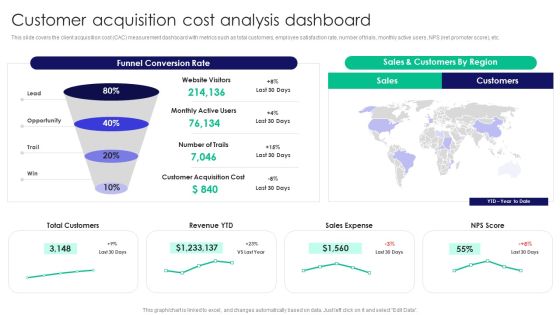
Guide To Business Customer Acquisition Customer Acquisition Cost Analysis Dashboard Download PDF
This slide covers the client acquisition cost CAC measurement dashboard with metrics such as total customers, employee satisfaction rate, number of trials, monthly active users, NPS net promoter score, etc. Make sure to capture your audiences attention in your business displays with our gratis customizable Guide To Business Customer Acquisition Customer Acquisition Cost Analysis Dashboard Download PDF. These are great for business strategies, office conferences, capital raising or task suggestions. If you desire to acquire more customers for your tech business and ensure they stay satisfied, create your own sales presentation with these plain slides.

Agriculture Marketing Strategy To Improve Revenue Performance Dashboard Depicting Production Global Food Market Brochure PDF
This slide provides an overview of the dashboard that exhibits the situation of the global food market. It includes production, import, exports information for wheat, maize, rice and soybean. If you are looking for a format to display your unique thoughts, then the professionally designed Agriculture Marketing Strategy To Improve Revenue Performance Dashboard Depicting Production Global Food Market Brochure PDF is the one for you. You can use it as a Google Slides template or a PowerPoint template. Incorporate impressive visuals, symbols, images, and other charts. Modify or reorganize the text boxes as you desire. Experiment with shade schemes and font pairings. Alter, share or cooperate with other people on your work. Download Agriculture Marketing Strategy To Improve Revenue Performance Dashboard Depicting Production Global Food Market Brochure PDF and find out how to give a successful presentation. Present a perfect display to your team and make your presentation unforgettable.
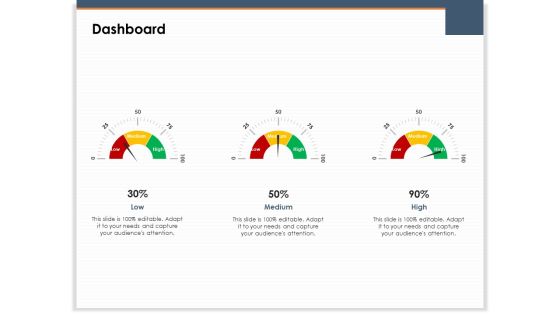
Main Revenues Progress Levers For Each Firm And Sector Dashboard Ppt PowerPoint Presentation File Images PDF
Presenting this set of slides with name main revenues progress levers for each firm and sector dashboard ppt powerpoint presentation file images pdf. The topics discussed in these slides are low, medium, high. This is a completely editable PowerPoint presentation and is available for immediate download. Download now and impress your audience.
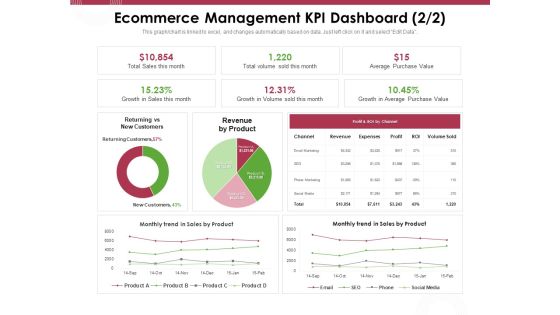
Online Product Planning Ecommerce Management KPI Dashboard Revenue Ppt Gallery Master Slide PDF
Presenting this set of slides with name online product planning ecommerce management kpi dashboard revenue ppt gallery master slide pdf. The topics discussed in these slides are salesforce accounts by country, sales by product, visitors online now, conversion. This is a completely editable PowerPoint presentation and is available for immediate download. Download now and impress your audience.

Cross Channel Marketing Plan For Clients Omnichannel Marketing Dashboard With Revenue And Total Spend Slides PDF
Presenting this set of slides with name cross channel marketing plan for clients omnichannel marketing dashboard with revenue and total spend slides pdf. The topics discussed in these slides are direct mall, events, online display, paid social. This is a completely editable PowerPoint presentation and is available for immediate download. Download now and impress your audience.
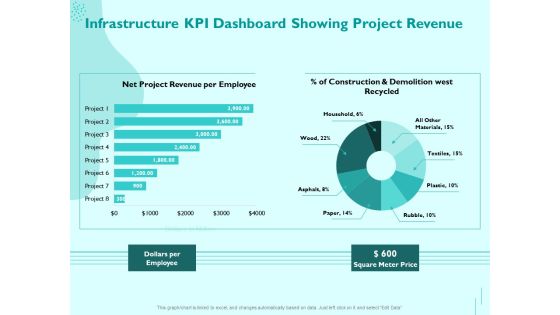
Managing IT Operating System Infrastructure KPI Dashboard Showing Project Revenue Diagrams PDF
Presenting this set of slides with name managing it operating system infrastructure kpi dashboard showing project revenue diagrams pdf. The topics discussed in these slides are dollars per employee, square meter price. This is a completely editable PowerPoint presentation and is available for immediate download. Download now and impress your audience.
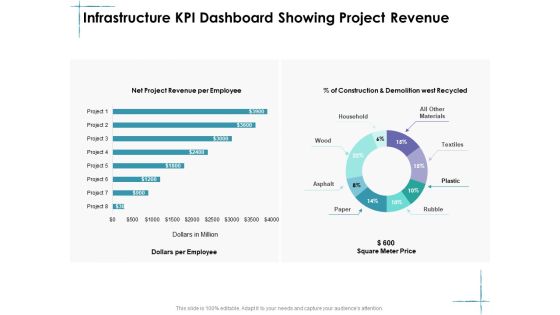
Facility Management Infrastructure KPI Dashboard Showing Project Revenue Ppt Slides Example File PDF
Deliver and pitch your topic in the best possible manner with this facility management infrastructure kpi dashboard showing project revenue ppt slides example file pdf. Use them to share invaluable insights on household, textiles, plastic, rubble, paper, asphalt and impress your audience. This template can be altered and modified as per your expectations. So, grab it now.

Infrastructure Strategies Infrastructure KPI Dashboard Showing Project Revenue Ppt Styles Show PDF
Deliver and pitch your topic in the best possible manner with this infrastructure strategies infrastructure kpi dashboard showing project revenue ppt styles show pdf. Use them to share invaluable insights on household, textiles, plastic, rubble, paper, asphalt and impress your audience. This template can be altered and modified as per your expectations. So, grab it now.
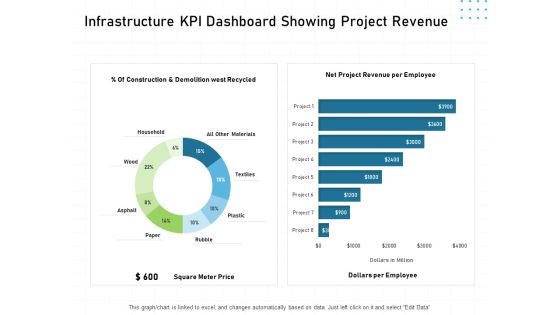
IT Infrastructure Administration Infrastructure KPI Dashboard Showing Project Revenue Ppt Summary Grid PDF
Deliver and pitch your topic in the best possible manner with this it infrastructure administration infrastructure kpi dashboard showing project revenue ppt summary grid pdf. Use them to share invaluable insights on household, textiles, plastic, rubble, paper, asphalt and impress your audience. This template can be altered and modified as per your expectations. So, grab it now.

Improving Operational Activities Enterprise Infrastructure Kpi Dashboard Showing Project Revenue Professional PDF
Deliver an awe inspiring pitch with this creative improving operational activities enterprise infrastructure kpi dashboard showing project revenue professional pdf bundle. Topics like square meter price, dollars per employee can be discussed with this completely editable template. It is available for immediate download depending on the needs and requirements of the user.

Construction Engineering And Industrial Facility Management Infrastructure KPI Dashboard Showing Project Revenue Formats PDF
Deliver and pitch your topic in the best possible manner with this construction engineering and industrial facility management infrastructure kpi dashboard showing project revenue formats pdf. Use them to share invaluable insights on all other materials, 15percent, household, asphalt and impress your audience. This template can be altered and modified as per your expectations. So, grab it now.
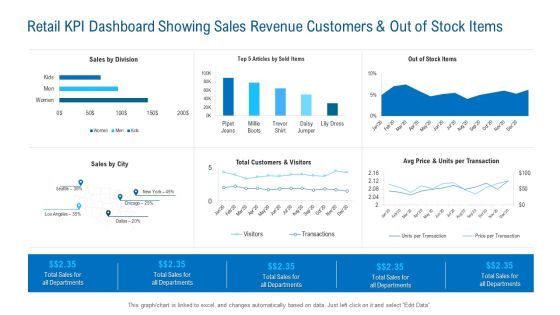
Retail KPI Dashboard Showing Sales Revenue Customers And Out Of Stock Items Rules PDF
Deliver an awe inspiring pitch with this creative retail kpi dashboard showing sales revenue customers and out of stock items rules pdf bundle. Topics like sales by division, sales by city, customers and visitors can be discussed with this completely editable template. It is available for immediate download depending on the needs and requirements of the user.
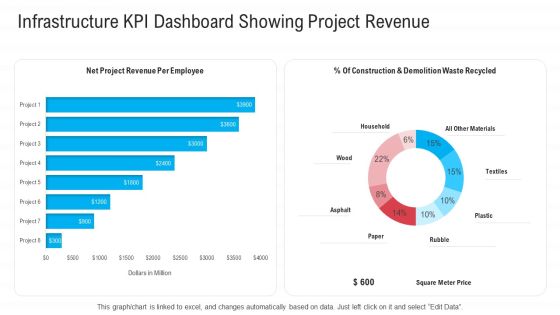
Infrastructure Designing And Administration Infrastructure KPI Dashboard Showing Project Revenue Professional PDF
Deliver and pitch your topic in the best possible manner with this infrastructure designing and administration infrastructure kpi dashboard showing project revenue professional pdf. Use them to share invaluable insights on household, textiles, plastic, rubble, paper, asphalt and impress your audience. This template can be altered and modified as per your expectations. So, grab it now.
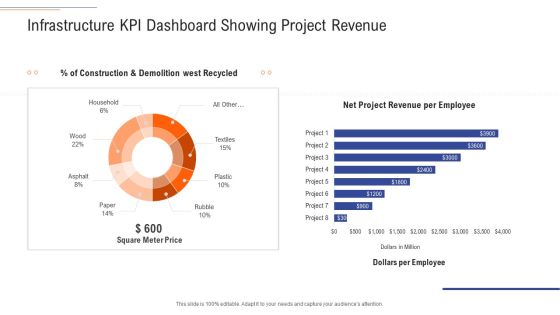
Support Services Management Infrastructure KPI Dashboard Showing Project Revenue Topics PDF
Deliver and pitch your topic in the best possible manner with this support services management infrastructure kpi dashboard showing project revenue topics pdf. Use them to share invaluable insights on household, textiles, plastic, rubble, paper, asphalt and impress your audience. This template can be altered and modified as per your expectations. So, grab it now.
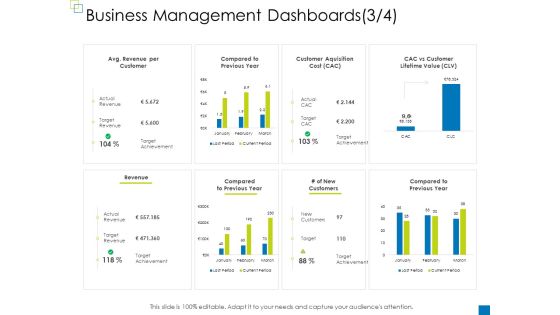
Enterprise Management Business Management Dashboards New Portrait PDF
Deliver an awe-inspiring pitch with this creative enterprise management business management dashboards new portrait pdf bundle. Topics like customer aquisition cost, customer lifetime value, revenue, revenue per customer, compared to previous year can be discussed with this completely editable template. It is available for immediate download depending on the needs and requirements of the user.
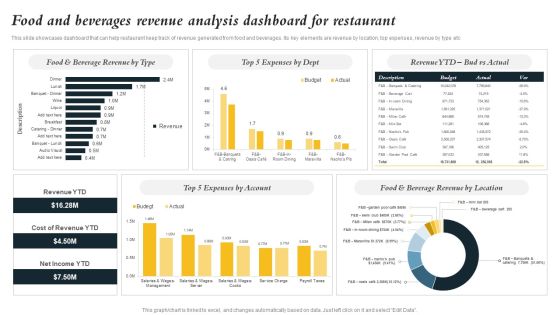
Marketing Initiatives To Promote Fast Food Cafe Food And Beverages Revenue Analysis Dashboard Demonstration PDF
This slide showcases dashboard that can help restaurant keep track of revenue generated from food and beverages. Its key elements are revenue by location, top expenses, revenue by type etc Are you in need of a template that can accommodate all of your creative concepts This one is crafted professionally and can be altered to fit any style. Use it with Google Slides or PowerPoint. Include striking photographs, symbols, depictions, and other visuals. Fill, move around, or remove text boxes as desired. Test out color palettes and font mixtures. Edit and save your work, or work with colleagues. Download Marketing Initiatives To Promote Fast Food Cafe Food And Beverages Revenue Analysis Dashboard Demonstration PDF and observe how to make your presentation outstanding. Give an impeccable presentation to your group and make your presentation unforgettable.

Coffeehouse Promotion Techniques To Boost Revenue Dashboard To Track Sales Expenses Restaurant Clipart PDF
This slide showcases dashboard that can help restaurant to keep track of sales and expenses. Its key elements are total sales, average transactions, non labor margin, expenses by category etc. If your project calls for a presentation, then Slidegeeks is your go-to partner because we have professionally designed, easy-to-edit templates that are perfect for any presentation. After downloading, you can easily edit Coffeehouse Promotion Techniques To Boost Revenue Dashboard To Track Sales Expenses Restaurant Clipart PDF and make the changes accordingly. You can rearrange slides or fill them with different images. Check out all the handy templates
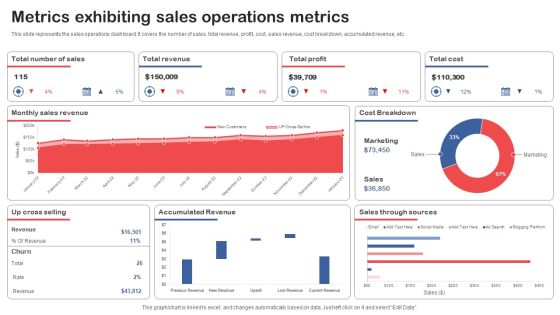
Metrics Exhibiting Sales Operations Metrics Topics PDF
This slide represents the sales operations dashboard. It covers the number of sales, total revenue, profit, cost, sales revenue, cost breakdown, accumulated revenue, etc. Showcasing this set of slides titled Metrics Exhibiting Sales Operations Metrics Topics PDF. The topics addressed in these templates are Total Revenue, Total Profit, Total Cost. All the content presented in this PPT design is completely editable. Download it and make adjustments in color, background, font etc. as per your unique business setting.

Landing Page Leads And Revenue Generation Analytics For User Experience Optimization Dashboard Formats PDF
This slide covers website analytics based on revenue earned. It also included leads generated, bounce rates, customer churn stats, annual and monthly recurring revenue, etc. Pitch your topic with ease and precision using this Landing Page Leads And Revenue Generation Analytics For User Experience Optimization Dashboard Formats PDF. This layout presents information on Monthly Recurring Revenue, Bounce Rate, Gross Volume. It is also available for immediate download and adjustment. So, changes can be made in the color, design, graphics or any other component to create a unique layout.

Stock Photo 3d Dollars Stack With Unlocked Lock And Keys PowerPoint Slide
This power point template has been designed with graphic of dollars and lock. We have used open lock with keys, in this image dollars are used to show finance while lock and key are used to display security concept. Use this image in your business and finance related presentations.

Competitive Analysis By Key Performance Indicators 2020 Designs PDF
The slide shows the comparison of major KPIs key performance indicators of the company with its competitors. Major KPIs include Revenue, net profit, number of flights, number of passengers, number of pilots etc.Deliver an awe-inspiring pitch with this creative competitive analysis by key performance indicators 2020 designs pdf. bundle. Topics like net profits, revenue, number of passengers can be discussed with this completely editable template. It is available for immediate download depending on the needs and requirements of the user.

Competitive Analysis By Key Performance Indicators 2020 Professional PDF
The slide shows the comparison of major KPIs key performance indicators of the company with its competitors. Major KPIs include Revenue, net profit, number of flights, number of passengers, number of pilots etc. Deliver an awe inspiring pitch with this creative competitive analysis by key performance indicators 2020 professional pdf bundle. Topics like revenue, net profits can be discussed with this completely editable template. It is available for immediate download depending on the needs and requirements of the user.

Social Economic And Environmental Indicators Structure PDF
The slide exhibits various sustainable development global goals for society, economy and environmental improvements. It highlights indicators such as poverty, hunger, heath and wellbeing, education, gender equality, water and sanitation, energy systems, climate change, inequalities, etc. Slidegeeks is here to make your presentations a breeze with Social Economic And Environmental Indicators Structure PDF With our easy to use and customizable templates, you can focus on delivering your ideas rather than worrying about formatting. With a variety of designs to choose from, you are sure to find one that suits your needs. And with animations and unique photos, illustrations, and fonts, you can make your presentation pop. So whether you are giving a sales pitch or presenting to the board, make sure to check out Slidegeeks first.

Product Portfolios And Strategic Dashboard To Measure Business Performance Portrait PDF
This slide illustrates a dashboard that can be used by a product manager to measure the business performance. Metrics covered in the dashboard are revenue, launches, cash flow, EPS, average revenue by product and average cost by phase. Do you have an important presentation coming up Are you looking for something that will make your presentation stand out from the rest Look no further than Product Portfolios And Strategic Dashboard To Measure Business Performance Portrait PDF. With our professional designs, you can trust that your presentation will pop and make delivering it a smooth process. And with Slidegeeks, you can trust that your presentation will be unique and memorable. So why wait Grab Product Portfolios And Strategic Dashboard To Measure Business Performance Portrait PDF today and make your presentation stand out from the rest.
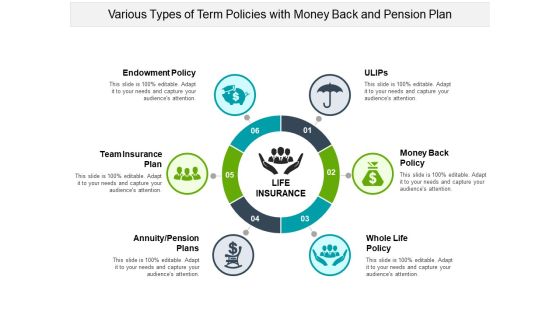
Various Types Of Term Policies With Money Back And Pension Plan Ppt PowerPoint Presentation Infographic Template Pictures PDF
Presenting this set of slides with name various types of term policies with money back and pension plan ppt powerpoint presentation infographic template pictures pdf. This is a six stage process. The stages in this process are ulips, money back policy, whole life policy, annuity, pension plans, team insurance plan, endowment policy. This is a completely editable PowerPoint presentation and is available for immediate download. Download now and impress your audience.

Food And Beverage Industry Kpi Dashboard Professional PDF
This slide covers the food and beverage analysis dashboard. It include KPIs such as revenue by location, top five expenses by account, revenue by type, top five expenses by department, etc.Showcasing this set of slides titled Food And Beverage Industry Kpi Dashboard Professional PDF. The topics addressed in these templates are Food And Beverage Industry KPI Dashboard. All the content presented in this PPT design is completely editable. Download it and make adjustments in color, background, font etc. as per your unique business setting

Customer Goods Production Manufacturing Company Dashboard With Downtime Pictures PDF
This slide showcases the manufacturing company dashboard which showcases downtime causes top 5 products with price with sold items and revenue, it also includes production volume by top machines. This Customer Goods Production Manufacturing Company Dashboard With Downtime Pictures PDF is perfect for any presentation, be it in front of clients or colleagues. It is a versatile and stylish solution for organizing your meetings. The Customer Goods Production Manufacturing Company Dashboard With Downtime Pictures PDF features a modern design for your presentation meetings. The adjustable and customizable slides provide unlimited possibilities for acing up your presentation. Slidegeeks has done all the homework before launching the product for you. So, dont wait, grab the presentation templates today.

Go To Market Approach For New Product KPI Dashboard To Monitor Sales Performance Clipart PDF
This slide shows sales performance monitoring dashboard. Metrics included in the dashboard are sales revenue, sales growth, average revenue per unit, customer lifetime value and customer acquisition cost.Deliver and pitch your topic in the best possible manner with this Go To Market Approach For New Product KPI Dashboard To Monitor Sales Performance Clipart PDF Use them to share invaluable insights on Kpi Dashboard To Monitor Sales Performance and impress your audience. This template can be altered and modified as per your expectations. So, grab it now.

Online Marketing Techniques For Acquiring Clients Dashboard To Measure Performance Of Social Media Guidelines PDF
This following slide displays the key metrics that can help an organization to measure effectiveness of e commerce strategies. These can be revenue generated using e-commerce platform, conversion rates etc. This Online Marketing Techniques For Acquiring Clients Dashboard To Measure Performance Of Social Media Guidelines PDF from Slidegeeks makes it easy to present information on your topic with precision. It provides customization options, so you can make changes to the colors, design, graphics, or any other component to create a unique layout. It is also available for immediate download, so you can begin using it right away. Slidegeeks has done good research to ensure that you have everything you need to make your presentation stand out. Make a name out there for a brilliant performance.
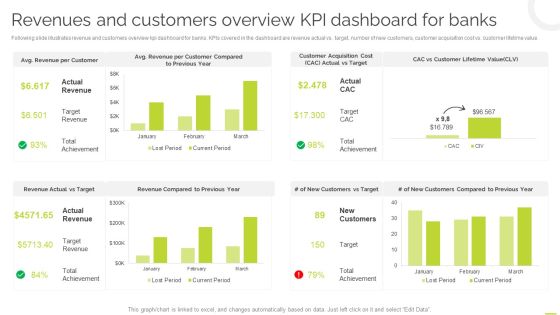
Effective BPM Tool For Business Process Management Revenues And Customers Overview KPI Dashboard For Banks Elements PDF
Following slide illustrates revenue and customers overview kpi dashboard for banks. KPIs covered in the dashboard are revenue actual vs target, number of new customers, customer acquisition cost vs. customer lifetime value. This Effective BPM Tool For Business Process Management Revenues And Customers Overview KPI Dashboard For Banks Elements PDF is perfect for any presentation, be it in front of clients or colleagues. It is a versatile and stylish solution for organizing your meetings. The Effective BPM Tool For Business Process Management Revenues And Customers Overview KPI Dashboard For Banks Elements PDF features a modern design for your presentation meetings. The adjustable and customizable slides provide unlimited possibilities for acing up your presentation. Slidegeeks has done all the homework before launching the product for you. So, do not wait, grab the presentation templates today.
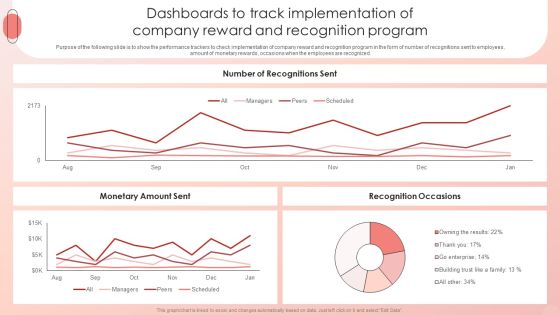
Improving HRM Process Dashboards To Track Implementation Of Company Reward Themes PDF
Purpose of the following slide is to show the performance trackers to check implementation of company reward and recognition program in the form of number of recognitions sent to employees, amount of monetary rewards, occasions when the employees are recognized. Make sure to capture your audiences attention in your business displays with our gratis customizable Improving HRM Process Dashboards To Track Implementation Of Company Reward Themes PDF. These are great for business strategies, office conferences, capital raising or task suggestions. If you desire to acquire more customers for your tech business and ensure they stay satisfied, create your own sales presentation with these plain slides.
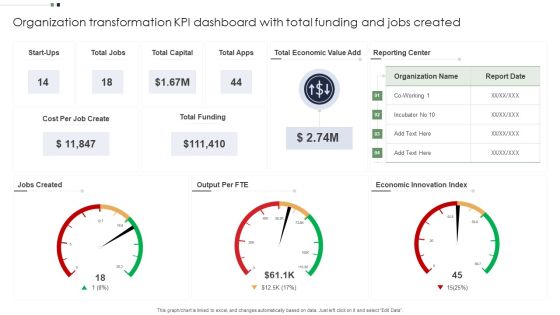
Organization Transformation KPI Dashboard With Total Funding And Jobs Created Information PDF
Pitch your topic with ease and precision using this Organization Transformation KPI Dashboard With Total Funding And Jobs Created Information PDF. This layout presents information on Organization Transformation KPI Dashboard, Economic, Capital. It is also available for immediate download and adjustment. So, changes can be made in the color, design, graphics or any other component to create a unique layout.
