Financial Snapshot

Dashboard Report Ppt Powerpoint Ideas
This is a dashboard report ppt powerpoint ideas. This is a six stage process. The stages in this process are sales vs quotes, target for week, the sales, inventory, revenue.

Crm Dashboard Sales Dashboard Template Ppt PowerPoint Presentation Inspiration
This is a crm dashboard sales dashboard template ppt powerpoint presentation inspiration. This is a five stage process. The stages in this process are sales by product march, lead owner breakdown, total lead ownership, month over month closing trend.

Corporate Dashboard Template Presentation Portfolio
This is a corporate dashboard template presentation portfolio. This is a five stage process. The stages in this process are product, strategy, marketing, customer, management.

Dashboard Analytics Diagram Presentation Powerpoint
This is a dashboard analytics diagram presentation powerpoint. This is a three stage process. The stages in this process are value, analytic, reporting.
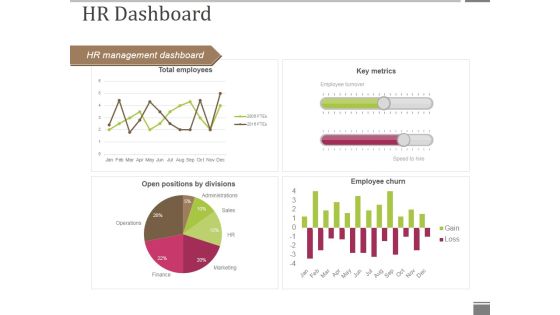
Hr Dashboard Template 1 Ppt PowerPoint Presentation Infographic Template Format Ideas
This is a hr dashboard template 1 ppt powerpoint presentation infographic template format ideas. This is a four stage process. The stages in this process are hr management dashboard, key metrics, employee churn, open positions by divisions, total employees.
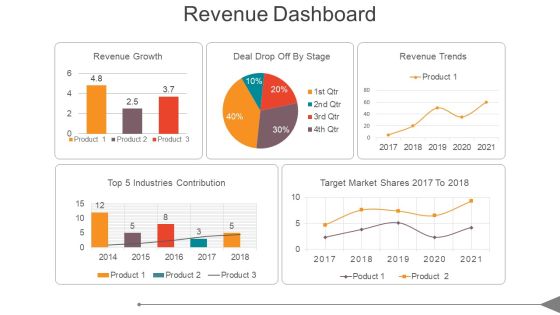
Revenue Dashboard Ppt PowerPoint Presentation Show
This is a revenue dashboard ppt powerpoint presentation show. This is a five stage process. The stages in this process are top 5 industries contribution, revenue growth, deal drop off by stage, revenue trends, target market shares 2017 to 2018.
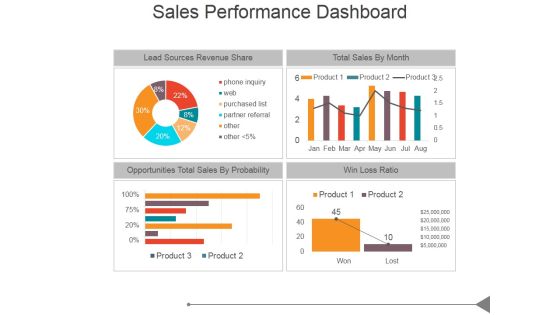
Sales Performance Dashboard Ppt PowerPoint Presentation Good
This is a sales performance dashboard ppt powerpoint presentation good. This is a four stage process. The stages in this process are lead sources revenue share, total sales by month, opportunities total sales by probability, win loss ratio.

Cost Reporting Dashboard Example Powerpoint Slides
This is a cost reporting dashboard example powerpoint slides. This is a five stage process. The stages in this process are cost, quality, project, process planning, analysis.

Data Analytics Ppt PowerPoint Presentation Guide
This is a data analytics ppt powerpoint presentation guide. This is a five stage process. The stages in this process are data analysis, business, marketing, success, graph.

Accounting Key Performance Indicators Ppt Powerpoint
This is a accounting key performance indicators ppt powerpoint. This is a four stage process. The stages in this process are cost per invoice, invoice processing speed, productivity per team member, variance analysis.
Sales Product Performance Dashboard Ppt PowerPoint Presentation Summary Icon
This is a sales product performance dashboard ppt powerpoint presentation infographics samples. This is a four stage process. The stages in this process are top products in revenue, incremental sales campaign, sales product performance, cost of goods sold.

Project Management Dashboard Ppt PowerPoint Presentation Outline Summary
This is a project management dashboard ppt powerpoint presentation outline summary. This is a three stage process. The stages in this process are overall task status, budget, pending items, complete, overdue.
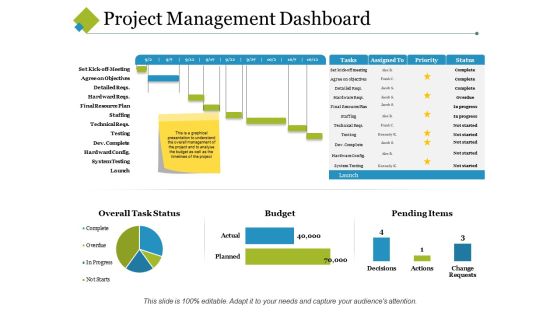
Project Management Dashboard Ppt PowerPoint Presentation Model Graphics Template
This is a project management dashboard ppt powerpoint presentation model graphics template. This is a four stage process. The stages in this process are assigned to, task, priority, cost, budget.

Business Research And Analysis Ppt PowerPoint Presentation Ideas Graphics Design
This is a business research and analysis ppt powerpoint presentation ideas graphics design. This is a three stage process. The stages in this process are support, assistance, hand holding.
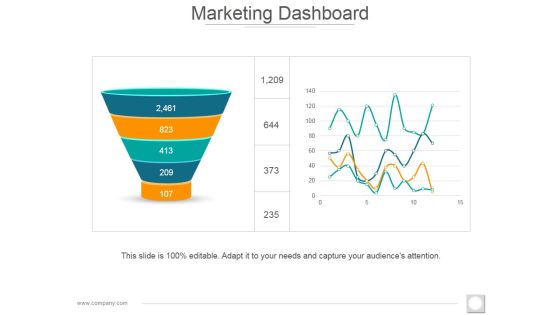
Marketing Dashboard Ppt PowerPoint Presentation Infographic Template Clipart
This is a marketing dashboard ppt powerpoint presentation infographic template clipart. This is a two stage process. The stages in this process are funnel, filter, step, business, marketing.
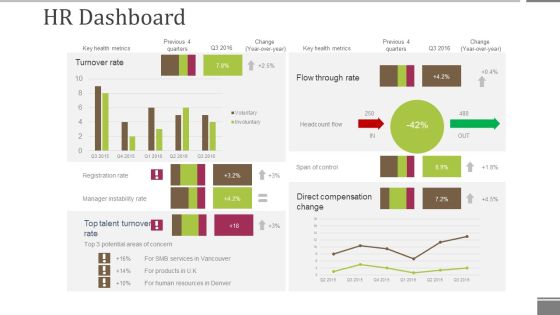
Hr Dashboard Template 2 Ppt PowerPoint Presentation File Grid
This is a hr dashboard template 2 ppt powerpoint presentation file grid. This is a four stage process. The stages in this process are turnover rate, direct compensation change, span of control, headcount flow, flow through rate.
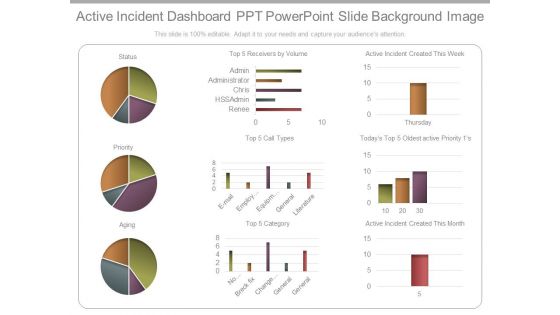
Active Incident Dashboard Ppt Powerpoint Slide Background Image
This is a active incident dashboard ppt powerpoint slide background image. This is a three stage process. The stages in this process are status, priority, aging, receivers by volume, renee, hssadmin, chris, administrator, admin, category, email, employee setup, equipment, general, literature, no category, breck fix, change management, general, active incident created this week, oldest active priority, active incident created this month, thursday.

Chart With Magnifying Glass For Business Research Ppt PowerPoint Presentation Inspiration Shapes
This is a chart with magnifying glass for business research ppt powerpoint presentation inspiration shapes. This is a two stage process. The stages in this process are metrics icon, kpis icon, statistics icon.

Cash Flow Statement Kpis Template 1 Ppt PowerPoint Presentation Gallery Diagrams
This is a cash flow statement kpis template 1 ppt powerpoint presentation gallery diagrams. This is a four stage process. The stages in this process are operations, financing activities, investing activities, net increase in cash.

Telemarketing Report Template 1 Ppt PowerPoint Presentation Show Structure
This is a telemarketing report template 1 ppt powerpoint presentation show structure. This is a four stage process. The stages in this process are inbound calls connected, appointment requested, appointment results, key data, daily connected calls.
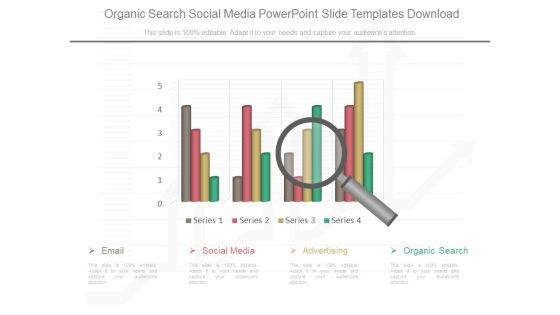
Organic Search Social Media Powerpoint Slide Templates Download
This is a organic search social media powerpoint slide templates download. This is a four stage process. The stages in this process are email, social media, advertising, organic search, series.
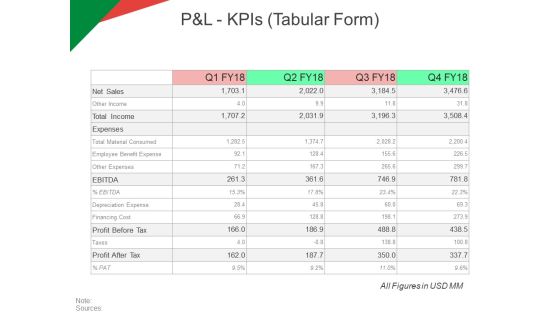
P And L Kpis Tabular Form Ppt PowerPoint Presentation Model Ideas
This is a p and l kpis tabular form ppt powerpoint presentation model ideas. This is a four stage process. The stages in this process are revenue, operating profit, cogs, net profit.

Cash Flow Statement Kpis Tabular Form Ppt PowerPoint Presentation Model Graphic Tips
This is a cash flow statement kpis tabular form ppt powerpoint presentation model graphic tips. This is a four stage process. The stages in this process are operations, investing activities, net increase in cash, financing activities.

Clustered Bar Ppt PowerPoint Presentation Good
This is a clustered bar ppt powerpoint presentation good. This is a five stage process. The stages in this process are product, circular, business, marketing, bar graph.

Competitive Analysis Template 7 Bubble Chart Ppt PowerPoint Presentation Deck
This is a competitive analysis template 7 bubble chart ppt powerpoint presentation deck. This is a six stage process. The stages in this process are users interface, data import, example, pricing, support, update, tutorials, easy to use, table.
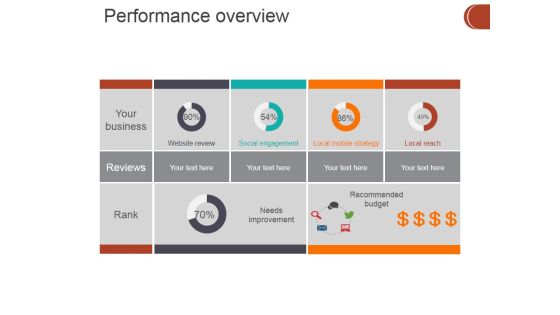
Performance Overview Ppt PowerPoint Presentation Pictures Vector
This is a performance overview ppt powerpoint presentation pictures vector. This is a five stage process. The stages in this process are website review, social engagement, local mobile strategy, local reach, needs improvement , recommended budget.

How Much Money We Need Ppt PowerPoint Presentation Pictures
This is a how much money we need ppt powerpoint presentation pictures. This is a two stage process. The stages in this process are business, marketing, management, production, planning.

Clustered Column Ppt PowerPoint Presentation Picture
This is a clustered column ppt powerpoint presentation picture. This is a two stage process. The stages in this process are product, jan, feb, mar, apr.

Bar Graph Ppt PowerPoint Presentation File Picture
This is a bar graph ppt powerpoint presentation file picture. This is a six stage process. The stages in this process are management, planning, marketing, business, strategy.

Stacked Column Ppt PowerPoint Presentation Ideas Pictures
This is stacked column ppt powerpoint presentation ideas pictures. This is a two stage process. The stages in this process are product, in million, strategy management, business, finance.

Clustered Bar Ppt PowerPoint Presentation Pictures Demonstration
This is a clustered bar ppt powerpoint presentation pictures demonstration. This is a two stage process. The stages in this process are clustered bar, finance, marketing, analysis, business.

Cost Analysis Powerpoint Slide Background Picture
This is a cost analysis powerpoint slide background picture. This is a four stage process. The stages in this process are cost analysis, cost prediction, workflow processes, monitoring and escalation.

Competitor Positioning Ppt PowerPoint Presentation Professional Picture
This is a competitor positioning ppt powerpoint presentation professional picture. This is a two stage process. The stages in this process are company growth, percentage, market growth , business.
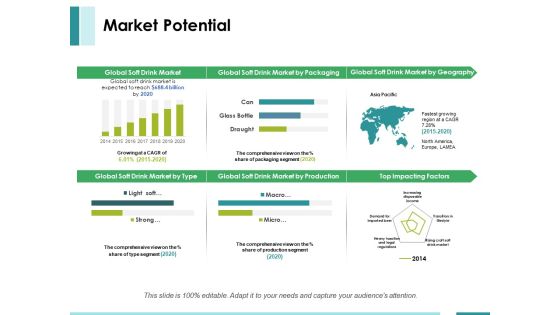
Market Potential Ppt PowerPoint Presentation Pictures Infographics
This is a market potential ppt powerpoint presentation pictures infographics. This is a two stage process. The stages in this process are top impacting factors, asia pacific, global soft drink market by type, global soft drink market.
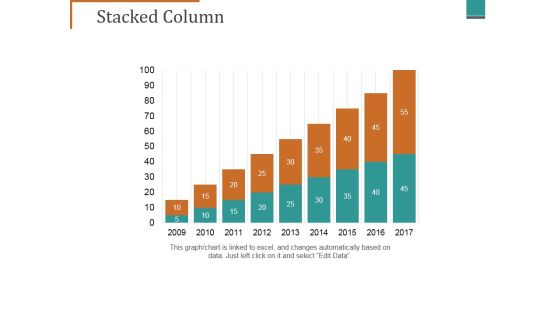
Stacked Column Ppt PowerPoint Presentation Pictures Graphics Design
This is a stacked column ppt powerpoint presentation pictures graphics design. This is a nine stage process. The stages in this process are business, finance, growth, analysis, marketing.

Area Chart Ppt PowerPoint Presentation Pictures Graphics Design
This is a area chart ppt powerpoint presentation pictures graphics design. This is a two stage process. The stages in this process are charts, success, finance, percentage, growth.

Marketing Research By Ppt PowerPoint Presentation Pictures Graphic Images
This is a marketing research by ppt powerpoint presentation pictures graphic images. This is a eight stage process. The stages in this process are business, growth, marketing, strategy, management.

Line Chart Ppt PowerPoint Presentation Visual Aids Pictures
This is a line chart ppt powerpoint presentation visual aids pictures. This is a three stage process. The stages in this process are business, marketing, line chart, analysis, growth.

Competitive Analysis Template 2 Ppt PowerPoint Presentation Pictures Slide
This is a competitive analysis template 2 ppt powerpoint presentation pictures slide. This is a six stage process. The stages in this process are competitive, analysis, business, marketing, competitor.

Sales Team Target And Achievement Ppt PowerPoint Presentation Pictures Deck
This is a sales team target and achievement ppt powerpoint presentation pictures deck. This is a four stage process. The stages in this process are john allen, anita smith, peter smith, mary smith.

Web Traffic Insights Ppt PowerPoint Presentation Pictures Slides
This is a web traffic insights ppt powerpoint presentation pictures slides. This is a five stage process. The stages in this process are engagement in july, avg page views, global rank, country rank, category rank, bounce rate.
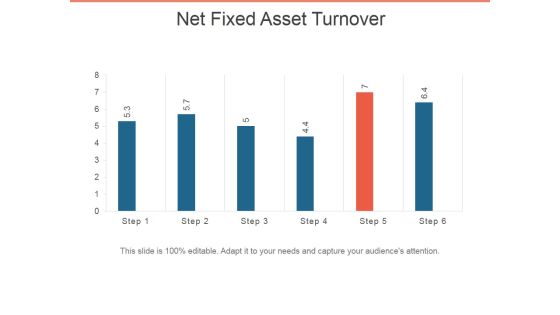
Net Fixed Asset Turnover Ppt PowerPoint Presentation Infographic Template Pictures
This is a net fixed asset turnover ppt powerpoint presentation infographic template pictures. This is a six stage process. The stages in this process are bar graph, business, marketing, presentation, success.

Employee Turnover Rate Formula Ppt PowerPoint Presentation Pictures Aids
This is a employee turnover rate formula ppt powerpoint presentation pictures aids. This is a five stage process. The stages in this process are employee turnover, rate of tune over, business, marketing, bar graph.
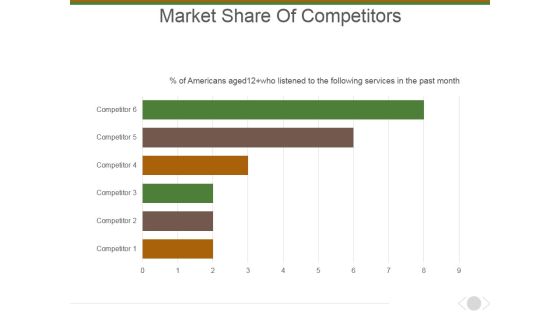
Market Share Of Competitors Ppt PowerPoint Presentation Layouts Picture
This is a market share of competitors ppt powerpoint presentation layouts picture. This is a six stage process. The stages in this process are marketing, business, management, bar graph, presentation.

Profitability Ratios Template 2 Ppt PowerPoint Presentation Outline Graphics Pictures
This is a profitability ratios template 2 ppt powerpoint presentation outline graphics pictures. This is a two stage process. The stages in this process are business, finance, marketing, analysis, investment.

Clustered Column Ppt PowerPoint Presentation Pictures Graphics Template
This is a clustered column ppt powerpoint presentation pictures graphics template. This is a two stage process. The stages in this process are product, growth, success, business, bar graph.
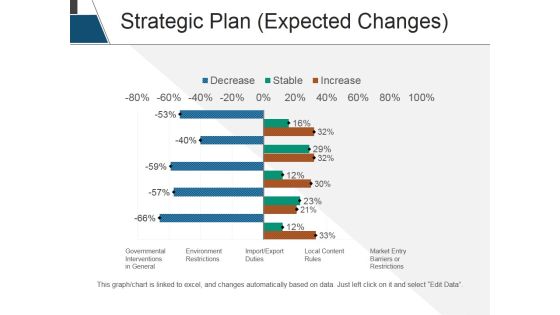
Strategic Plan Expected Changes Ppt PowerPoint Presentation Pictures Vector
This is a strategic plan expected changes ppt powerpoint presentation pictures vector. This is a two stage process. The stages in this process are government interventions in general, environment restrictions, import export duties, local content rules, market entry barriers or restrictions.

Changes In Competitive Environment Template 2 Ppt PowerPoint Presentation Pictures Ideas
This is a changes in competitive environment template 2 ppt powerpoint presentation pictures ideas. This is a four stage process. The stages in this process are business, strategy, marketing, analysis, engagement, monthly weekly.

Geographical Reach By Region Template 1 Ppt PowerPoint Presentation Show Picture
This is a geographical reach by region template 1 ppt powerpoint presentation show picture. This is a five stage process. The stages in this process are ocation, geography, information, donut chart, success, finance.

Combo Chart Finance Ppt PowerPoint Presentation Clipart
This is a combo chart finance ppt powerpoint presentation pictures show. This is a two stage process. The stages in this process are finance, marketing, management, investment, analysis.
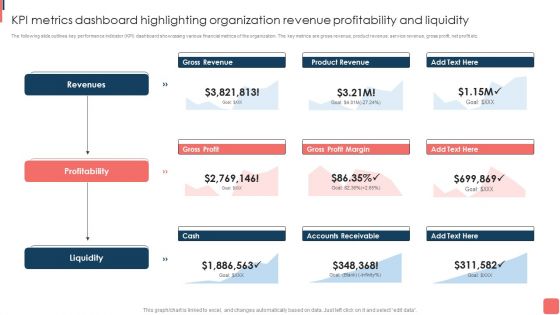
KPI Metrics Dashboard Highlighting Organization Revenue Profitability And Liquidity Template PDF
The following slide outlines key performance indicator KPI dashboard showcasing various financial metrics of the organization. The key metrics are gross revenue, product revenue, service revenue, gross profit, net profit etc. This KPI Metrics Dashboard Highlighting Organization Revenue Profitability And Liquidity Template PDF from Slidegeeks makes it easy to present information on your topic with precision. It provides customization options, so you can make changes to the colors, design, graphics, or any other component to create a unique layout. It is also available for immediate download, so you can begin using it right away. Slidegeeks has done good research to ensure that you have everything you need to make your presentation stand out. Make a name out there for a brilliant performance.

Estimating Business Overall Kpi Metrics Dashboard Highlighting Organization Revenue Clipart PDF
The following slide outlines key performance indicator KPI dashboard showcasing various financial metrics of the organization. The key metrics are gross revenue, product revenue, service revenue, gross profit, net profit etc. Formulating a presentation can take up a lot of effort and time, so the content and message should always be the primary focus. The visuals of the PowerPoint can enhance the presenters message, so our Estimating Business Overall Kpi Metrics Dashboard Highlighting Organization Revenue Clipart PDF was created to help save time. Instead of worrying about the design, the presenter can concentrate on the message while our designers work on creating the ideal templates for whatever situation is needed. Slidegeeks has experts for everything from amazing designs to valuable content, we have put everything into Estimating Business Overall Kpi Metrics Dashboard Highlighting Organization Revenue Clipart PDF.

Monetary Planning And Evaluation Guide KPI Metrics Dashboard Highlighting Organization Revenue Profitability And Liquidity Ppt Diagram Images PDF
The following slide outlines key performance indicator KPI dashboard showcasing various financial metrics of the organization. The key metrics are gross revenue, product revenue, service revenue, gross profit, net profit etc. Coming up with a presentation necessitates that the majority of the effort goes into the content and the message you intend to convey. The visuals of a PowerPoint presentation can only be effective if it supplements and supports the story that is being told. Keeping this in mind our experts created Monetary Planning And Evaluation Guide KPI Metrics Dashboard Highlighting Organization Revenue Profitability And Liquidity Ppt Diagram Images PDF to reduce the time that goes into designing the presentation. This way, you can concentrate on the message while our designers take care of providing you with the right template for the situation.

KPI Dashboard To Track Brand Performance Ppt Ideas Pictures PDF
Mentioned slide showcases KPI dashboard that can be used to check the financial performance of a brand. Metrics covered in the dashboard are return on assets, working capital ratio, return on equity etc. Formulating a presentation can take up a lot of effort and time, so the content and message should always be the primary focus. The visuals of the PowerPoint can enhance the presenters message, so our KPI Dashboard To Track Brand Performance Ppt Ideas Pictures PDF was created to help save time. Instead of worrying about the design, the presenter can concentrate on the message while our designers work on creating the ideal templates for whatever situation is needed. Slidegeeks has experts for everything from amazing designs to valuable content, we have put everything into KPI Dashboard To Track Brand Performance Ppt Ideas Pictures PDF.

Ecommerce KPI Dashboard With Pand L Statement Download PDF
This slide showcases ecommerce key performance indicators KPI dashboard with financial statement. It provides information about total sales, orders, net profit, net profit margin, average order value, channels, etc. This Ecommerce KPI Dashboard With Pand L Statement Download PDF from Slidegeeks makes it easy to present information on your topic with precision. It provides customization options, so you can make changes to the colors, design, graphics, or any other component to create a unique layout. It is also available for immediate download, so you can begin using it right away. Slidegeeks has done good research to ensure that you have everything you need to make your presentation stand out. Make a name out there for a brilliant performance.
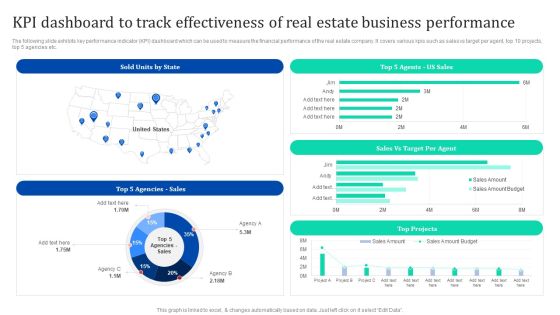
KPI Dashboard To Track Effectiveness Of Real Estate Business Enhancing Process Improvement By Regularly Themes PDF
The following slide exhibits key performance indicator KPI dashboard which can be used to measure the financial performance of the real estate company. It covers various kpis such as sales vs target per agent, top 10 projects, top 5 agencies etc. Welcome to our selection of the KPI Dashboard To Track Effectiveness Of Real Estate Business Enhancing Process Improvement By Regularly Themes PDF. These are designed to help you showcase your creativity and bring your sphere to life. Planning and Innovation are essential for any business that is just starting out. This collection contains the designs that you need for your everyday presentations. All of our PowerPoints are 100 parcent editable, so you can customize them to suit your needs. This multi-purpose template can be used in various situations. Grab these presentation templates today.

Executing Risk Mitigation KPI Dashboard To Track Effectiveness Of Real Estate Rules PDF
The following slide exhibits key performance indicator KPI dashboard which can be used to measure the financial performance of the real estate company. It covers various KPIs such as sales vs target per agent, top 10 projects, top 5 agencies etc. Find highly impressive Executing Risk Mitigation KPI Dashboard To Track Effectiveness Of Real Estate Rules PDF on Slidegeeks to deliver a meaningful presentation. You can save an ample amount of time using these presentation templates. No need to worry to prepare everything from scratch because Slidegeeks experts have already done a huge research and work for you. You need to download Executing Risk Mitigation Kpi Dashboard To Track Effectiveness Of Real Estate Rules PDF for your upcoming presentation. All the presentation templates are 100 percent editable and you can change the color and personalize the content accordingly. Download now.
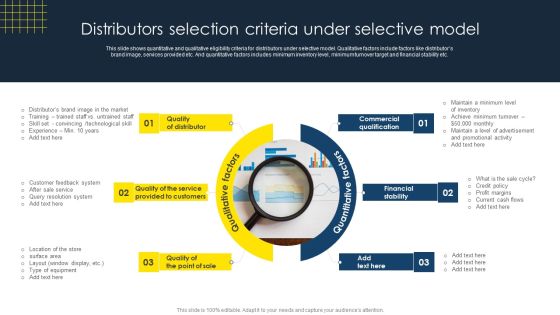
Optimize Business Sales Distributors Selection Criteria Under Selective Model Structure PDF
This slide shows quantitative and qualitative eligibility criteria for distributors under selective model. Qualitative factors include factors like distributors brand image, services provided etc. And quantitative factors includes minimum inventory level, minimum turnover target and financial stability etc. This Optimize Business Sales Distributors Selection Criteria Under Selective Model Structure PDF from Slidegeeks makes it easy to present information on your topic with precision. It provides customization options, so you can make changes to the colors, design, graphics, or any other component to create a unique layout. It is also available for immediate download, so you can begin using it right away. Slidegeeks has done good research to ensure that you have everything you need to make your presentation stand out. Make a name out there for a brilliant performance.

KPI Dashboard To Track Brand Performance Information PDF
Mentioned slide showcases KPI dashboard that can be used to check the financial performance of a brand. Metrics covered in the dashboard are return on assets, working capital ratio, return on equity etc. Do you know about Slidesgeeks KPI Dashboard To Track Brand Performance Information PDF These are perfect for delivering any kind od presentation. Using it, create PowerPoint presentations that communicate your ideas and engage audiences. Save time and effort by using our pre designed presentation templates that are perfect for a wide range of topic. Our vast selection of designs covers a range of styles, from creative to business, and are all highly customizable and easy to edit. Download as a PowerPoint template or use them as Google Slides themes.

Data Quality Dashboard For Linked Data Integrating Linked Data To Enhance Operational Template PDF
This slide describes the data quality dashboard for linked data by covering details of account information quality, contact details quality, financial data quality, and missing account information.This Data Quality Dashboard For Linked Data Integrating Linked Data To Enhance Operational Template PDF from Slidegeeks makes it easy to present information on your topic with precision. It provides customization options, so you can make changes to the colors, design, graphics, or any other component to create a unique layout. It is also available for immediate download, so you can begin using it right away. Slidegeeks has done good research to ensure that you have everything you need to make your presentation stand out. Make a name out there for a brilliant performance.

 Home
Home