AI PPT Maker
Templates
PPT Bundles
Design Services
Business PPTs
Business Plan
Management
Strategy
Introduction PPT
Roadmap
Self Introduction
Timelines
Process
Marketing
Agenda
Technology
Medical
Startup Business Plan
Cyber Security
Dashboards
SWOT
Proposals
Education
Pitch Deck
Digital Marketing
KPIs
Project Management
Product Management
Artificial Intelligence
Target Market
Communication
Supply Chain
Google Slides
Research Services
 One Pagers
All Categories
-
Home
- Customer Favorites
- Financial Snapshot
Financial Snapshot
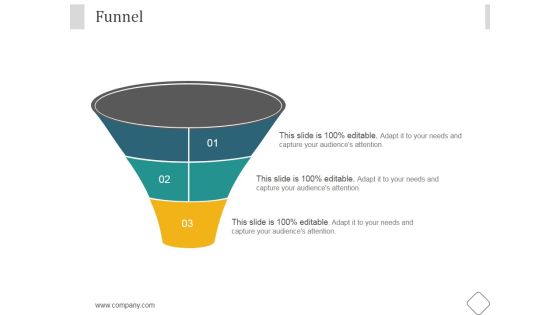
Funnel Ppt PowerPoint Presentation Backgrounds
This is a funnel ppt powerpoint presentation backgrounds. This is a three stage process. The stages in this process are business, marketing, management, funnel, planning.

Benefits Of Big Data Ppt PowerPoint Presentation Example 2015
This is a benefits of big data ppt powerpoint presentation example 2015. This is a four stage process. The stages in this process are business, marketing, success, finance, analysis.
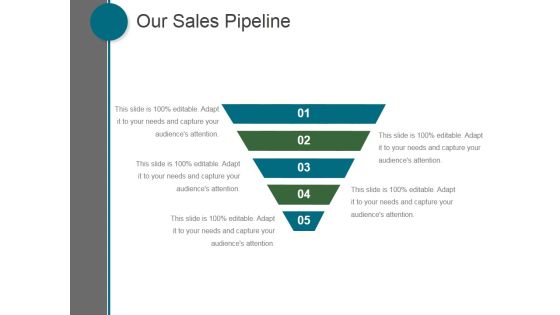
Our Sales Pipeline Ppt PowerPoint Presentation Picture
This is a our sales pipeline ppt powerpoint presentation picture. This is a five stage process. The stages in this process are business, marketing, management, process, funnel.
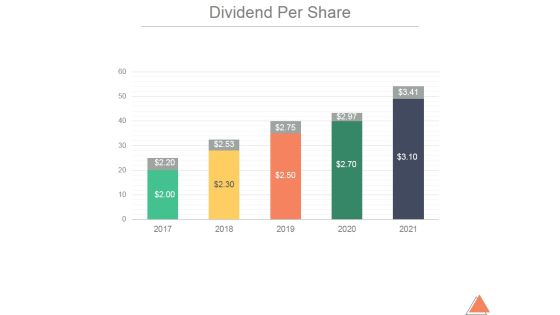
Dividend Per Share Ppt PowerPoint Presentation Pictures
This is a dividend per share ppt powerpoint presentation pictures. This is a five stage process. The stages in this process are business, marketing, management, growth, finance.

Bar Graph Ppt PowerPoint Presentation Styles Picture
This is a bar graph ppt powerpoint presentation styles picture. This is a four stage process. The stages in this process are business, strategy, marketing, analysis, chart and graph, bar graph.

Market Trends Percentage Spending By Region Ppt PowerPoint Presentation Picture
This is a market trends percentage spending by region ppt powerpoint presentation picture. This is a seven stage process. The stages in this process are business, marketing, growth, planning, management.

Hiring Plan Ppt PowerPoint Presentation Pictures Graphic Images
This is a hiring plan ppt powerpoint presentation pictures graphic images. This is a five stage process. The stages in this process are engineering, sales, marketing, product, support, finance.
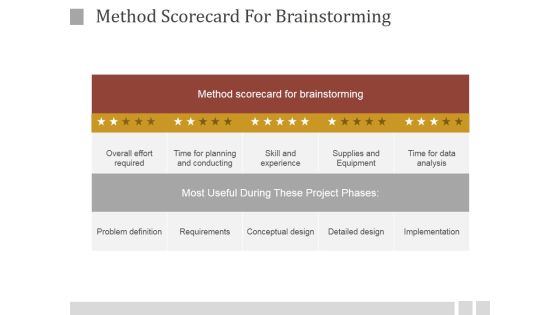
Method Scorecard For Brainstorming Ppt PowerPoint Presentation Visuals
This is a method scorecard for brainstorming ppt powerpoint presentation visuals. This is a five stage process. The stages in this process are method scorecard for brainstorming, overall effort required, time for planning and conducting, skill and experience, supplies and equipment, time for data analysis.

Benefits Of Big Data Ppt PowerPoint Presentation Inspiration
This is a benefits of big data ppt powerpoint presentation inspiration. This is a four stage process. The stages in this process are increased efficiency, better business decision making, improved customer experience and engagement, achieved financial savings.
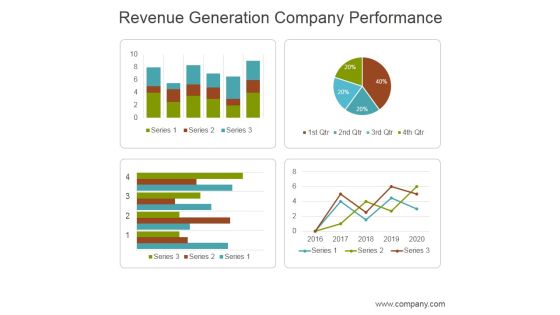
Revenue Generation Company Performance Ppt PowerPoint Presentation Layouts
This is a revenue generation company performance ppt powerpoint presentation layouts. This is a four stage process. The stages in this process are business, marketing, management, revenue, performance.

Crm Marketing Dashboard Ppt PowerPoint Presentation Designs
This is a crm marketing dashboard ppt powerpoint presentation designs. This is a two stage process. The stages in this process are leads per week, leads this week target.

Crm Marketing Dashboard Ppt PowerPoint Presentation Icon Graphic Tips
This is a crm marketing dashboard ppt powerpoint presentation icon graphic tips. This is a two stage process. The stages in this process are leads per week, leads this week.

Crm Dashboard Kpis Ppt PowerPoint Presentation Infographic Template Designs
This is a crm dashboard kpis ppt powerpoint presentation infographic template designs. This is a three stage process. The stages in this process are active subscribers, acquisition, revenue.

Crm Dashboard Sales Dashboard Template Ppt PowerPoint Presentation Professional Layout
This is a crm dashboard sales dashboard template ppt powerpoint presentation professional layout. This is a four stage process. The stages in this process are lead owner breakdown, sales by product march 2017, total lead ownership, month over month closing trend.

Website Performance Review Template 2 Ppt PowerPoint Presentation Gallery Objects
This is a website performance review template 2 ppt powerpoint presentation gallery objects. This is a three stage process. The stages in this process are margin, revenue, expense, support, other operational.
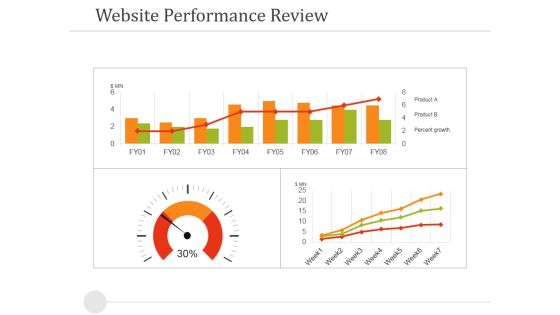
Website Performance Review Template 1 Ppt PowerPoint Presentation Portfolio Guide
This is a website performance review template 1 ppt powerpoint presentation portfolio guide. This is a four stage process. The stages in this process are website performance review, dashboard, business, marketing, finance.

Marketing Dashboard Ppt PowerPoint Presentation Visual Aids Example 2015
This is a marketing dashboard ppt powerpoint presentation visual aids example 2015. This is a two stage process. The stages in this process are marketing, dashboard, funnel, business, process.

Brand Performance Dashboard Template 1 Ppt PowerPoint Presentation Microsoft
This is a brand performance dashboard template 1 ppt powerpoint presentation microsoft. This is a two stage process. The stages in this process are business, brand, performance, dashboard, marketing.

Crm Dashboard Top Customers Ppt PowerPoint Presentation Infographics Format
This is a crm dashboard top customers ppt powerpoint presentation infographics format. This is a ten stage process. The stages in this process are top customers, people, management, business, marketing.

Crm Rep Dashboard Ppt PowerPoint Presentation Styles Objects
This is a crm rep dashboard ppt powerpoint presentation styles objects. This is a three stage process. The stages in this process are negotiation, proposal, develop, qualification, identity.

Crm Sales Rep Dashboard Ppt PowerPoint Presentation Influencers
This is a crm sales rep dashboard ppt powerpoint presentation influencers. This is a three stage process. The stages in this process are opp duration by pipeline, actual vs goal, opportunities est close next 25 days.

Portfolio Revision Ppt PowerPoint Presentation Slide
This is a portfolio revision ppt powerpoint presentation slide. This is a two stage process. The stages in this process are current portfolio, new portfolio, data analysis.

Analyze Results Ppt PowerPoint Presentation Slide
This is a analyze results ppt powerpoint presentation slide. This is a two stage process. The stages in this process are analysis, business, marketing, finance, pie chart.

Bar Graph Ppt PowerPoint Presentation Layouts Pictures
This is a bar graph ppt powerpoint presentation layouts pictures. This is a four stage process. The stages in this process are fire, earthquake, axis title, in percentage.

Area Chart Ppt PowerPoint Presentation Pictures Rules
This is a area chart ppt powerpoint presentation pictures rules. This is a two stage process. The stages in this process are area chart, business, marketing, strategy, success.
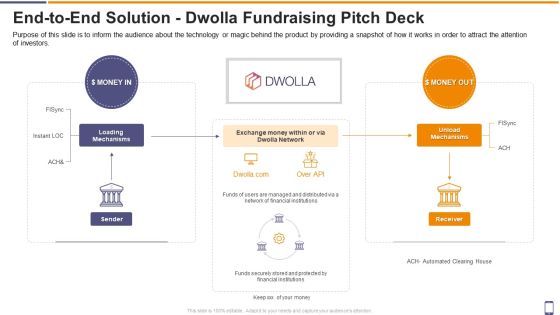
End To End Solution Dwolla Fundraising Pitch Deck Ppt Model Maker PDF
Purpose of this slide is to inform the audience about the technology or magic behind the product by providing a snapshot of how it works in order to attract the attention of investors. Deliver an awe inspiring pitch with this creative end to end solution dwolla fundraising pitch deck ppt model maker pdf bundle. Topics like network, financial can be discussed with this completely editable template. It is available for immediate download depending on the needs and requirements of the user.

Dashboard Ppt PowerPoint Presentation Example 2015
This is a dashboard ppt powerpoint presentation example 2015. This is a four stage process. The stages in this process are business, marketing, management, analysis, dashboard.
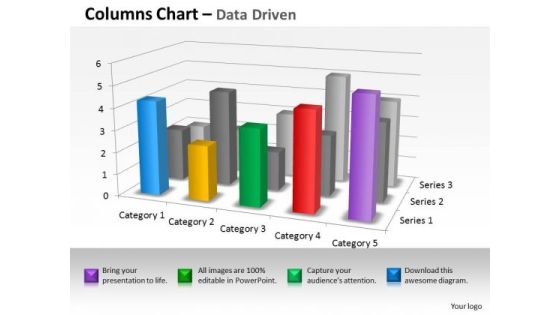
Quantitative Data Analysis 3d Interpretation Of Statistical Quality Control PowerPoint Templates
Land The Idea With Our quantitative data analysis 3d interpretation of statistical quality control Powerpoint Templates . Help It Grow With Your Thoughts.
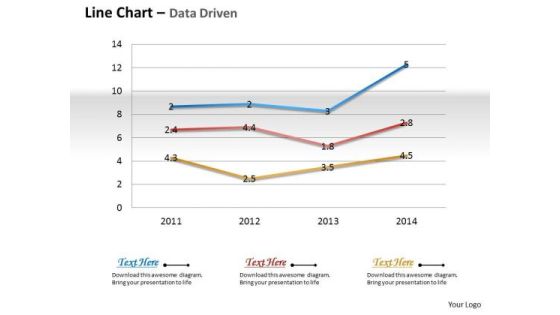
Business Data Analysis Chart Shows Changes Over The Time PowerPoint Templates
Document The Process On Our business data analysis chart shows changes over the time Powerpoint Templates. Make A Record Of Every Detail.

Data Analysis Excel Driven Multiple Series Scatter Chart PowerPoint Slides Templates
Your Listeners Will Never Doodle. Our data analysis excel driven multiple series scatter chart powerpoint slides Templates Will Hold Their Concentration.

Business Diagram Four Colored Pie Charts For Result Analysis Data Driven PowerPoint Slide
This business diagram displays graphic of pie charts. This business slide is suitable to present and compare business data. Use this diagram to build professional presentations for your viewers.
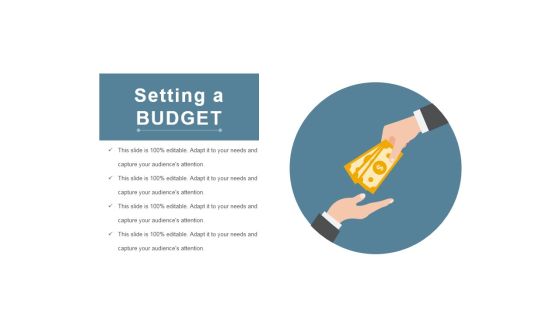
Setting A Budget Ppt PowerPoint Presentation Outline Pictures
This is a setting a budget ppt powerpoint presentation outline pictures. This is a two stage process. The stages in this process are setting a budget, opperchunity, success, strategy, marketing.
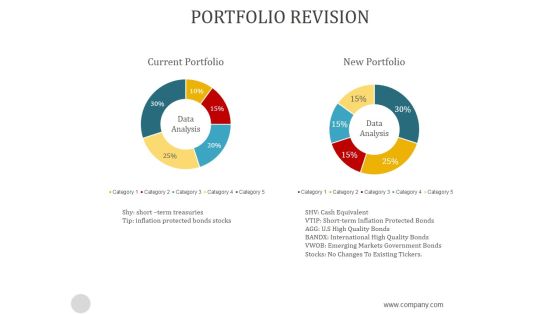
Portfolio Revision Ppt PowerPoint Presentation Template
This is a portfolio revision ppt powerpoint presentation template. This is a two stage process. The stages in this process are data analysis, current portfolio, new portfolio.

Coinbase Capital Raising Pitch Deck Coinbase A Hosted Bitcoin Wallet Ppt Inspiration Information PDF
Purpose of this slide is to entice the audience into wanting to know everything about the product. Here the customer will add a demo video or snapshot in order to attract the attention of investors. Presenting coinbase capital raising pitch deck coinbase a hosted bitcoin wallet ppt inspiration information pdf to provide visual cues and insights. Share and navigate important information on one stages that need your due attention. This template can be used to pitch topics like coinbase a hosted bitcoin wallet. In addtion, this PPT design contains high resolution images, graphics, etc, that are easily editable and available for immediate download.
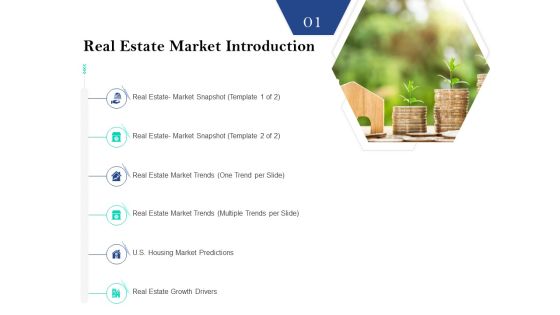
Property Investment Strategies Real Estate Market Introduction Ppt PowerPoint Presentation Pictures Layout PDF
Presenting property investment strategies real estate market introduction ppt powerpoint presentation pictures layout pdf. to provide visual cues and insights. Share and navigate important information on six stages that need your due attention. This template can be used to pitch topics like real estate market snapshot , real estate market trends, real estate market trends multiple trends per slide, u.s. housing market predictions, real estate growth drivers. In addtion, this PPT design contains high resolution images, graphics, etc, that are easily editable and available for immediate download.

Linkedin Company Outline Executive Summary Portrait PDF
The slide highlights the company snapshot to provide the overview of LinkedIn corporation. It showcases company logo, chief executive officer, estimated revenue, revenue CAGR, key stats and company market value.Deliver an awe inspiring pitch with this creative Linkedin Company Outline Executive Summary Portrait PDF bundle. Topics like Talent Solutions, Marketing Solutions, Learning Solutions can be discussed with this completely editable template. It is available for immediate download depending on the needs and requirements of the user.
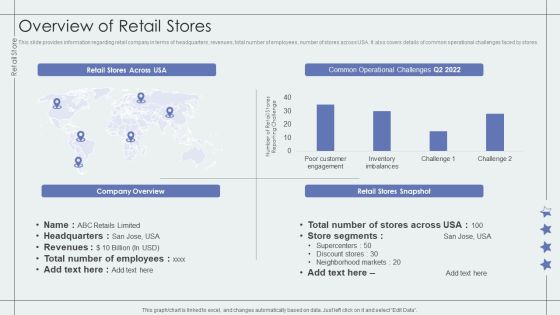
Overview Of Retail Stores Retail Outlet Performance Assessment Structure PDF
This slide provides information regarding retail company in terms of headquarters, revenues, total number of employees, number of stores across USA. It also covers details of common operational challenges faced by stores.Deliver an awe inspiring pitch with this creative Overview Of Retail Stores Retail Outlet Performance Assessment Structure PDF bundle. Topics like Common Operation, Neighborhood Markets, Stores Snapshot can be discussed with this completely editable template. It is available for immediate download depending on the needs and requirements of the user.
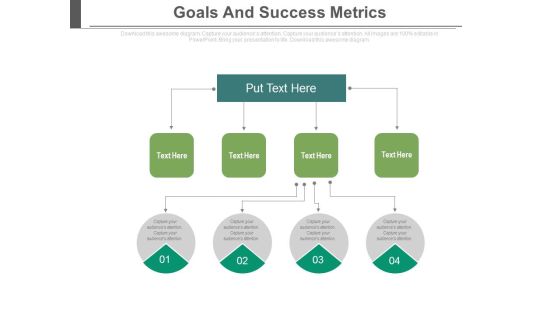
Goals And Success Metrics Ppt Slides
This is a goals and success metrics ppt slides. This is a four stage process. The stages in this process are process and flows, success, business.

Key Evaluation Metrics Ppt Slides
This is a key evaluation metrics ppt slides. This is a five stage process. The stages in this process are business, finance, marketing, symbol.

Stock Photo Pile Of Dollars With Chain Lock PowerPoint Slide
This image displays dollars locked with chain. This PowerPoint template contains the concept of financial security. Use this slide to represent topics related to financial security.
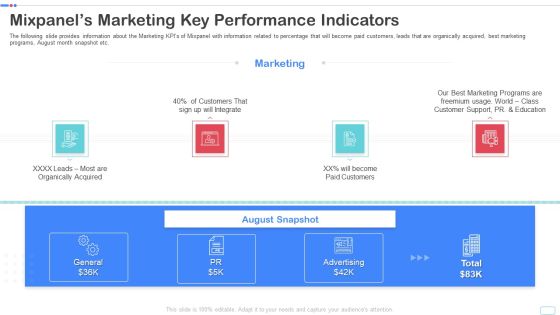
Mixpanel Capital Raising Pitch Deck Mixpanels Marketing Key Performance Indicators Portrait PDF
The following slide provides information about the Marketing KPIs of Mixpanel with information related to percentage that will become paid customers, leads that are organically acquired, best marketing programs, August month snapshot etc. Presenting mixpanel capital raising pitch deck mixpanels marketing key performance indicators portrait pdf to provide visual cues and insights. Share and navigate important information on four stages that need your due attention. This template can be used to pitch topics like mixpanels marketing key performance indicators. In addtion, this PPT design contains high resolution images, graphics, etc, that are easily editable and available for immediate download.
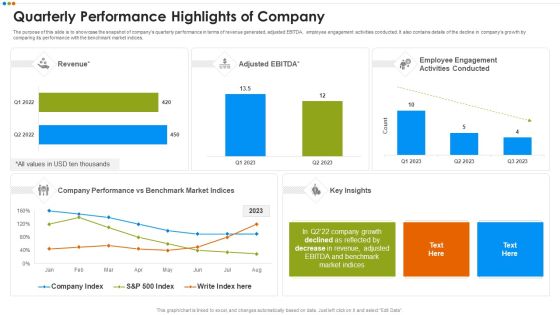
Quarterly Budget Analysis Of Business Organization Quarterly Performance Highlights Of Company Graphics PDF
The purpose of this slide is to showcase the snapshot of companys quarterly performance in terms of revenue generated, adjusted EBITDA, employee engagement activities conducted. It also contains details of the decline in companys growth by comparing its performance with the benchmark market indices.This is a Quarterly Budget Analysis Of Business Organization Quarterly Performance Highlights Of Company Graphics PDF template with various stages. Focus and dispense information on two stages using this creative set, that comes with editable features. It contains large content boxes to add your information on topics like Quarterly Performance Highlights Of Company You can also showcase facts, figures, and other relevant content using this PPT layout. Grab it now.

One Page Summary Template 344 One Pager Documents
This slide provides a snapshot of the publisher annual report. It includes details of publishing company operating segments. It also provides information about the past three years revenue generated and the chairmans address to the stakeholders. It also covers the firms sustainability plans along with the board of directors structure. Presenting you a fantastic One Page Summary Template 344 One Pager Documents. This piece is crafted on hours of research and professional design efforts to ensure you have the best resource. It is completely editable and its design allow you to rehash its elements to suit your needs. Get this One Page Summary Template 344 One Pager Documents A4 One-pager now.
Gathering Relevant Information Ppt Powerpoint Templates
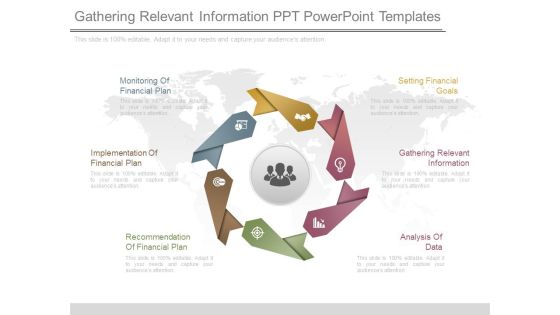
This is a gathering relevant information ppt powerpoint templates. This is a six stage process. The stages in this process are setting financial goals, gathering relevant information, analysis of data, recommendation of financial plan, implementation of financial plan, monitoring of financial plan.
Underlying Magic Behind The Product Ppt Styles Guidelines PDF
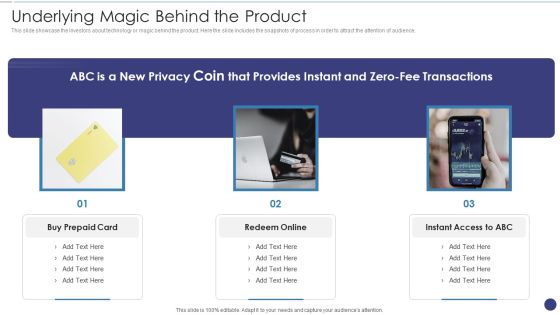
This slide showcase the investors about technology or magic behind the product. Here the slide includes the snapshots of process in order to attract the attention of audience. Presenting underlying magic behind the product ppt styles guidelines pdf to provide visual cues and insights. Share and navigate important information on three stages that need your due attention. This template can be used to pitch topics like underlying magic behind the product. In addtion, this PPT design contains high resolution images, graphics, etc, that are easily editable and available for immediate download.

Stock Photo Golden Dollar Symbol With Pie Graph PowerPoint Slide
This Power Point template has been crafted with graphic of golden dollar symbol and pie chart on a tablet. Display the concept of financial data analysis with this image. Use this image to present financial reports in business presentations.

Performance Measures Ppt PowerPoint Presentation Inspiration Skills
This is a performance measures ppt powerpoint presentation inspiration skills. This is a two stage process. The stages in this process are non financial measures, financial measures, growth, business, marketing.
Performance Measures Ppt PowerPoint Presentation Layouts Clipart Images
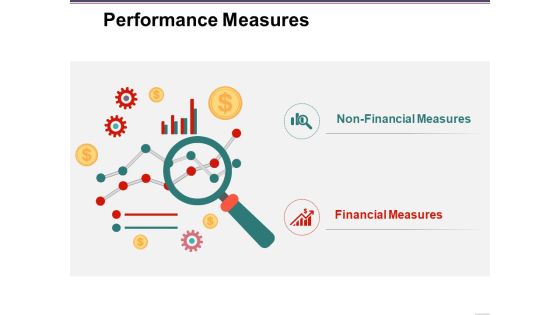
This is a performance measures ppt powerpoint presentation layouts clipart images. This is a two stage process. The stages in this process are non financial measures, financial measures, business, icons, marketing.

0814 Stock Photo Dollar On Top Of Books Graph PowerPoint Slide
The above image represent concept of financial growth. Adjust the above image of dollar currency symbol on top of books graph in order to show financial growth. Dazzle the audience with your thoughts.

0814 Stock Photo Growth Graph Of Books With Dollar Symbol PowerPoint Slide
The above image represent concept of financial growth. Adjust the above image of dollar currency symbol on top of books graph in order to show financial growth. Dazzle the audience with your thoughts.

Credit Monitoring Example Powerpoint Slide Background Picture
This is a credit monitoring example powerpoint slide background picture. This is a four stage process. The stages in this process are client relationship, financial spreading, financial statement analysis, credit appraisal.

Two Weeks Schedule Showing Highlighting Business Tasks Ppt PowerPoint Presentation Pictures Background Designs PDF
Presenting this set of slides with name two weeks schedule showing highlighting business tasks ppt powerpoint presentation pictures background designs pdf. This is a two stage process. The stages in this process are announcement of financial statements, payment of dividends, financial performance review, monthly financial reporting, expense audit, ledger review, financial planning, budget optimization. This is a completely editable PowerPoint presentation and is available for immediate download. Download now and impress your audience.

Ways To Overcome Organization Failure Ppt PowerPoint Presentation Portfolio Picture PDF
Presenting this set of slides with name ways to overcome organization failure ppt powerpoint presentation portfolio picture pdf. This is a four stage process. The stages in this process are financial transactions, financial affairs, target industry, financial forecasting, skills and knowledge. This is a completely editable PowerPoint presentation and is available for immediate download. Download now and impress your audience.

Business Connection Network Company Outline Executive Summary Template PDF
The slide highlights the company snapshot to provide the overview of LinkedIn corporation. It showcases company logo, chief executive officer, estimated revenue, revenue CAGR, key stats and company market value. Crafting an eye catching presentation has never been more straightforward. Let your presentation shine with this tasteful yet straightforward Business Connection Network Company Outline Executive Summary Template PDF template. It offers a minimalistic and classy look that is great for making a statement. The colors have been employed intelligently to add a bit of playfulness while still remaining professional. Construct the ideal Business Connection Network Company Outline Executive Summary Template PDF that effortlessly grabs the attention of your audience Begin now and be certain to wow your customers.

Quarterly Performance Highlights Of Company Brochure PDF
The purpose of this slide is to showcase the snapshot of companys quarterly performance in terms of revenue generated, adjusted EBITDA, employee engagement activities conducted. It also contains details of the decline in companys growth by comparing its performance with the benchmark market indices. This Quarterly Performance Highlights Of Company Brochure PDF is perfect for any presentation, be it in front of clients or colleagues. It is a versatile and stylish solution for organizing your meetings. The Quarterly Performance Highlights Of Company Brochure PDF features a modern design for your presentation meetings. The adjustable and customizable slides provide unlimited possibilities for acing up your presentation. Slidegeeks has done all the homework before launching the product for you. So, do not wait, grab the presentation templates today.
Company Budget Analysis Quarterly Performance Highlights Of Company Ideas PDF
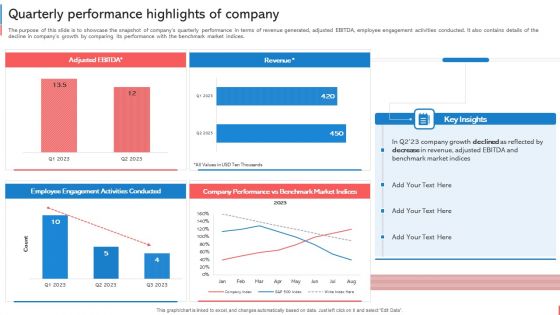
The purpose of this slide is to showcase the snapshot of companys quarterly performance in terms of revenue generated, adjusted EBITDA, employee engagement activities conducted. It also contains details of the decline in companys growth by comparing its performance with the benchmark market indices. Formulating a presentation can take up a lot of effort and time, so the content and message should always be the primary focus. The visuals of the PowerPoint can enhance the presenters message, so our Company Budget Analysis Quarterly Performance Highlights Of Company Ideas PDF was created to help save time. Instead of worrying about the design, the presenter can concentrate on the message while our designers work on creating the ideal templates for whatever situation is needed. Slidegeeks has experts for everything from amazing designs to valuable content, we have put everything into Company Budget Analysis Quarterly Performance Highlights Of Company Ideas PDF.
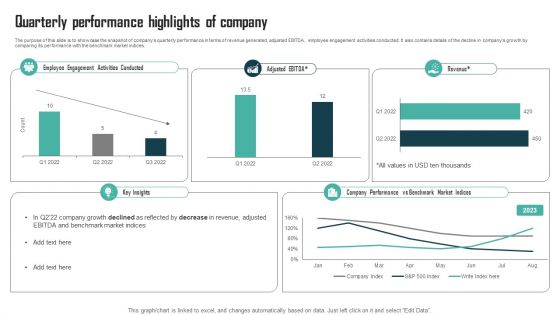
Expenses Management Plan Quarterly Performance Highlights Of Company Download PDF
The purpose of this slide is to showcase the snapshot of companys quarterly performance in terms of revenue generated, adjusted EBITDA, employee engagement activities conducted. It also contains details of the decline in companys growth by comparing its performance with the benchmark market indices. Crafting an eye-catching presentation has never been more straightforward. Let your presentation shine with this tasteful yet straightforward Expenses Management Plan Quarterly Performance Highlights Of Company Download PDF template. It offers a minimalistic and classy look that is great for making a statement. The colors have been employed intelligently to add a bit of playfulness while still remaining professional. Construct the ideal Expenses Management Plan Quarterly Performance Highlights Of Company Download PDF that effortlessly grabs the attention of your audience Begin now and be certain to wow your customers.

Activities In Project Budget Planning Monitoring And Control Rules PDF
This slide covers different activities involved in financial management which helps in monitoring and control the business project activities. It also includes accounting, financial audit, cash flow analysis and financial reporting. Presenting activities in project budget planning monitoring and control rules pdf to dispense important information. This template comprises four stages. It also presents valuable insights into the topics including accounting, financial audits, cash flow analysis, financial reporting. This is a completely customizable PowerPoint theme that can be put to use immediately. So, download it and address the topic impactfully.

Strategic Monetary Business Planning Checklist Pictures PDF
This slide shows the checklist for monetary planning. It includes points such as monetary goal setting, financial planning proposal creation, etc. Presenting Strategic Monetary Business Planning Checklist Pictures PDF to dispense important information. This template comprises one stage. It also presents valuable insights into the topics including Financial Goals Setting, Financial Planning, Proposal Preparation. This is a completely customizable PowerPoint theme that can be put to use immediately. So, download it and address the topic impactfully.

Economic Planning Process To Enhance Stability Pictures PDF
This slide covers five steps financial planning process for successful financial stability. It involve five steps such as define, gather, analyze, develop and implement.Presenting Economic Planning Process To Enhance Stability Pictures PDF to dispense important information. This template comprises five stages. It also presents valuable insights into the topics including Agreeing Financial, Personal Information, Developing Presenting. This is a completely customizable PowerPoint theme that can be put to use immediately. So, download it and address the topic impactfully.

Stock Photo Lock On Dollar Bundle For Money Safety PowerPoint Slide
This image displays graphic of locked dollars. This slide contains the concept of financial security. Use this image slide for your business and finance related presentations.
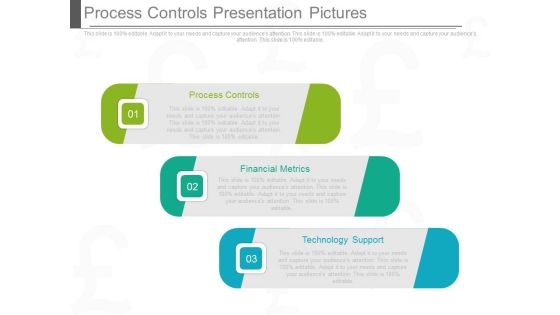
Process Controls Presentation Pictures
This is a process controls presentation pictures. This is a three stage process. The stages in this process are process controls, financial metrics, technology support.

Identify Csr Leaders Ppt PowerPoint Presentation Pictures
This is a identify csr leaders ppt powerpoint presentation pictures. This is a four stage process. The stages in this process are Ceo, financial advisor, manager, designer.

Bar Graph Ppt PowerPoint Presentation Pictures Display
This is a bar graph ppt powerpoint presentation pictures display. This is a one stage process. The stages in this process are sales in percentage, financial year.

Line Chart Ppt PowerPoint Presentation Pictures Maker
This is a line chart ppt powerpoint presentation pictures maker. This is a two stage process. The stages in this process are financial years, product, growth, success.

Line Chart Ppt PowerPoint Presentation Pictures Layout
This is a line chart ppt powerpoint presentation pictures layout. This is a two stage process. The stages in this process are product, financial years, sales in percentage.
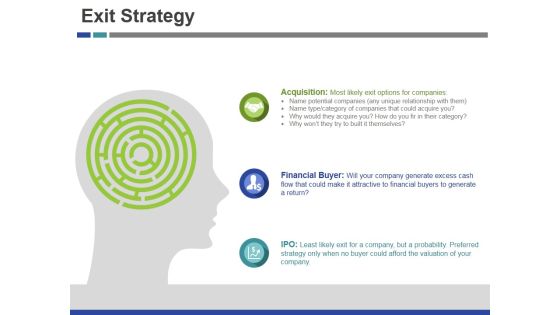
Exit Strategy Ppt PowerPoint Presentation Professional Graphics Pictures
This is a exit strategy ppt powerpoint presentation professional graphics pictures. This is a three stage process. The stages in this process are acquisition, financial buyer, ipo, maze.
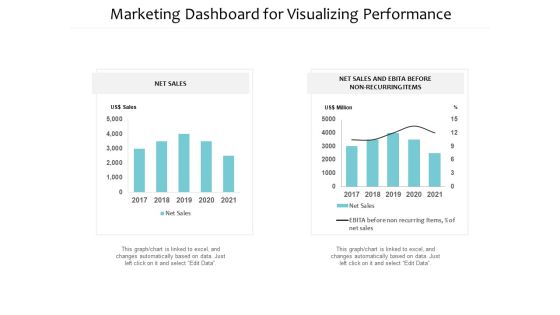
Marketing Dashboard For Visualizing Performance Ppt PowerPoint Presentation Summary Slide Download
Presenting this set of slides with name marketing dashboard for visualizing performance ppt powerpoint presentation summary slide download. The topics discussed in these slides are financial targets, financial goals, growth profitability. This is a completely editable PowerPoint presentation and is available for immediate download. Download now and impress your audience.

Stock Photo 3d Globe With Chains Global Safety PowerPoint Slide
Display the global business concept in any business presentation with the help of this unique image. This image contains the graphic of 3d globe. This image shows the financial reporting for global business. Use this image in global financial topic related presentation.

Stock Photo Path To Target Dollar Symbol PowerPoint Slide
This image slide displays graphic of maze with arrow leading to dollar symbol. This image slide displays path to financial success. Use this image slide, in your presentations to express views on financial goals, targets, achievements and success. This image may also be used to depict strategic business management. This image slide will enhance the quality of your presentations.

Stock Photo Path To Target Euro Currency Symbol PowerPoint Slide
This image slide displays graphic of maze with arrow leading to euro symbol. This image slide displays path to financial success. Use this image slide, in your presentations to express views on financial goals, targets, achievements and success. This image may also be used to depict strategic business management. This image slide will enhance the quality of your presentations.

Stock Photo Path To Target Pound Symbol PowerPoint Slide
This image slide displays graphic of maze with arrow leading to pound symbol. This image slide displays path to financial success. Use this image slide, in your presentations to express views on financial goals, targets, achievements and success. This image may also be used to depict strategic business management. This image slide will enhance the quality of your presentations.

Cyber Security Implementation Framework Present Concerns Impeding Cybersecurity Clipart PDF
Presenting this set of slides with name cyber security implementation framework present concerns impeding cybersecurity clipart pdf. The topics discussed in these slides are data breaches and records exposed, reported financial losses due to increase cybercrimes, financial losses, cybercrimes incidents. This is a completely editable PowerPoint presentation and is available for immediate download. Download now and impress your audience.

Picture Of Chess Game For Strategic Planning Ppt PowerPoint Presentation Summary Deck
Presenting this set of slides with name picture of chess game for strategic planning ppt powerpoint presentation summary deck. This is a seven stage process. The stages in this process are financial strategy, business financial trend, business strategy. This is a completely editable PowerPoint presentation and is available for immediate download. Download now and impress your audience.

Bar Graph For Marketing Research Data Powerpoint Slides
This PowerPoint template has been designed with diagram of bar graph. This PPT slide can be used to prepare presentations for profit growth report and also for financial data analysis. You can download finance PowerPoint template to prepare awesome presentations.

Bar Graph For Marketing Research Process Powerpoint Slides
This PowerPoint template has been designed with diagram of bar graph. This PPT slide can be used to prepare presentations for profit growth report and also for financial data analysis. You can download finance PowerPoint template to prepare awesome presentations.

Circle Diagram For Business Marketing Mix Powerpoint Slides
This PowerPoint template has been designed with nine steps circle chart. This PPT slide can be used to prepare presentations for profit growth report and also for financial data analysis. You can download finance PowerPoint template to prepare awesome presentations.

Bar Chart Ppt PowerPoint Presentation Model Picture
This is a bar chart ppt powerpoint presentation model picture. This is a two stage process. The stages in this process are product, sales in percentage, financial years, bar chart.
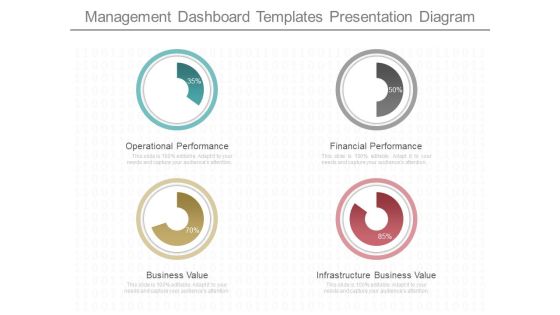
Management Dashboard Templates Presentation Diagram
This is a management dashboard templates presentation diagram. This is a four stage process. The stages in this process are operational performance, business value, financial performance, infrastructure business value.
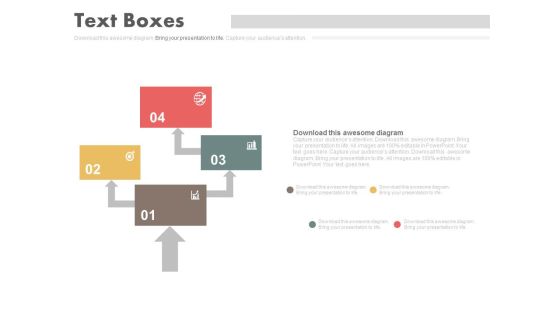
Four Steps Arrow Chart Design Powerpoint Slides
This PowerPoint template has been designed with four steps arrow chart. This PPT slide can be used to prepare presentations for marketing reports and also for financial data analysis. You can download finance PowerPoint template to prepare awesome presentations.
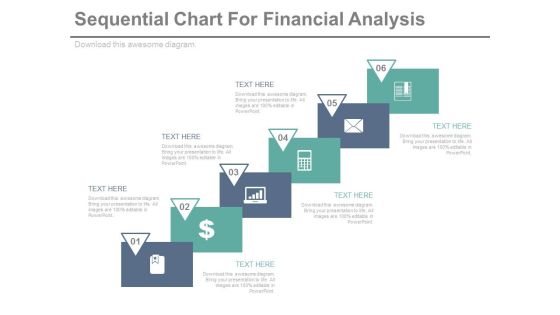
Sequential Steps Chart For Data Analysis Powerpoint Slides
This PowerPoint template has been designed sequential steps chart with icons. This PPT slide can be used to display corporate level financial strategy. You can download finance PowerPoint template to prepare awesome presentations.

Cash Flow Statement Kpis Template 2 Ppt PowerPoint Presentation Layouts Visuals
This is a cash flow statement kpis template 2 ppt powerpoint presentation layouts visuals. This is a four stage process. The stages in this process are operations, financial activities, investing activities, net increase in cash.

Cash Flow Statement Kpis Tabular Form Ppt PowerPoint Presentation Summary Elements
This is a cash flow statement kpis tabular form ppt powerpoint presentation summary elements. This is a four stage process. The stages in this process are net increase cash, financial activities, operations, investing activities.
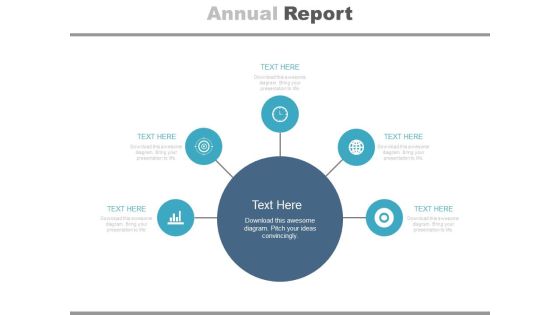
Diagram For Market Research Analysis Powerpoint Slides
This PowerPoint template has been designed with circular infographic diagram. It can be used to display steps for market research and also for financial data analysis. You can download finance PowerPoint template to prepare awesome presentations.

Clustered Column Ppt PowerPoint Presentation Pictures Mockup
This is a clustered column ppt powerpoint presentation pictures mockup. This is a two stage process. The stages in this process are product, sales in percentage, financial year, graph, business.

Bar Chart Ppt PowerPoint Presentation Pictures Background Image
This is a bar chart ppt powerpoint presentation pictures background image. This is a seven stage process. The stages in this process are financial years, sales in percentage, graph, business.

Area Chart Ppt PowerPoint Presentation Outline Graphics Pictures
This is a area chart ppt powerpoint presentation outline graphics pictures. This is a two stage process. The stages in this process are financial year, in percentage, business, marketing, finance.

Circles With Percentage Values Powerpoint Templates
This PowerPoint template displays circles with percentage values. This business diagram is suitable for financial data analysis. Use this business diagram slide to highlight the key issues of your presentation.

Quarterly Revenue And Loss Statement Comparison Dashboard Portrait PDF
This slide showcases a comprehensive P and L report for representing the financial outcomes. It also helps to take financial performance management decisions. It includes financial analysis KPIs such as p and l statements, p and l structure dynamics, sales or margin quality performance analysis, DUPONT ratio, etc. Showcasing this set of slides titled Quarterly Revenue And Loss Statement Comparison Dashboard Portrait PDF. The topics addressed in these templates are Profitability, Debt Coverage Ratios, Margin Quality Performa. All the content presented in this PPT design is completely editable. Download it and make adjustments in color, background, font etc. as per your unique business setting.
Developing Business Analytics Framework Current Potential Implications Faced By Firm Graphics PDF
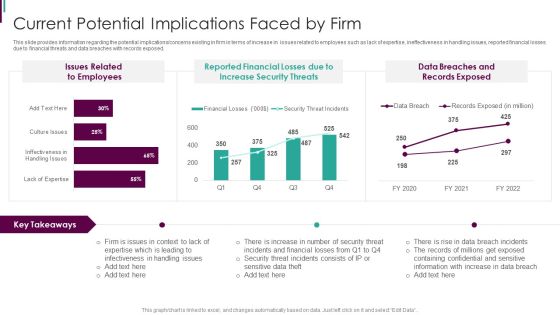
This slide provides information regarding the potential implications concerns existing in firm in terms of increase in issues related to employees such as lack of expertise, ineffectiveness in handling issues, reported financial losses due to financial threats and data breaches with records exposed. Deliver and pitch your topic in the best possible manner with this Developing Business Analytics Framework Current Potential Implications Faced By Firm Graphics PDF Use them to share invaluable insights on Reported Financial, Increase Security, Data Breaches and impress your audience. This template can be altered and modified as per your expectations. So, grab it now.
Evolving BI Infrastructure Current Potential Implications Faced By Firm Threats Portrait PDF
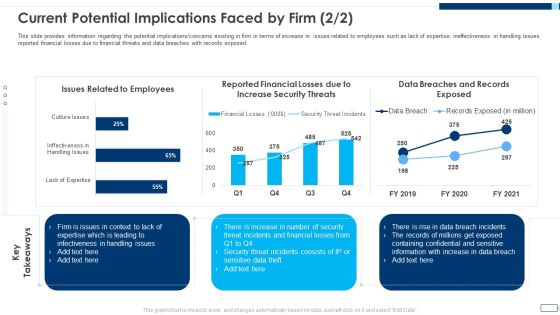
This slide provides information regarding the potential implications or concerns existing in firm in terms of increase in issues related to employees such as lack of expertise, ineffectiveness in handling issues, reported financial losses due to financial threats and data breaches with records exposed. Deliver an awe inspiring pitch with this creative evolving bi infrastructure current potential implications faced by firm threats portrait pdf bundle. Topics like issues related to employees, reported financial losses due to increase security threats, data breaches and records exposed can be discussed with this completely editable template. It is available for immediate download depending on the needs and requirements of the user.
Risk Management For Organization Essential Assets Current Potential Implications Faced Graphics PDF
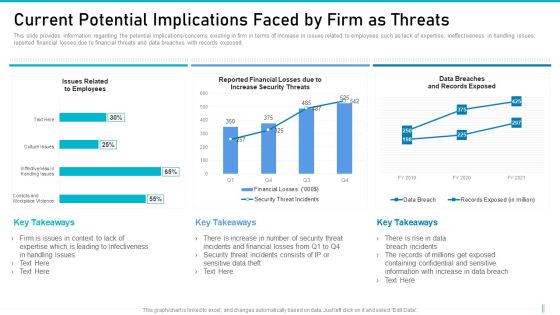
This slide provides information regarding the potential implications or concerns existing in firm in terms of increase in issues related to employees such as lack of expertise, ineffectiveness in handling issues, reported financial losses due to financial threats and data breaches with records exposed. Deliver an awe inspiring pitch with this creative risk management for organization essential assets current potential implications faced graphics pdf bundle. Topics like issues related to employees, reported financial losses due to increase security threats, data breaches and records exposed can be discussed with this completely editable template. It is available for immediate download depending on the needs and requirements of the user.

Cyber Safety Incident Management Current Potential Implications Faced By Firm As Threats Clipart PDF
This slide provides information regarding the potential implications or concerns existing in firm in terms of increase in issues related to employees such as lack of expertise, ineffectiveness in handling issues, reported financial losses due to financial threats and data breaches with records exposed. Deliver an awe inspiring pitch with this creative cyber safety incident management current potential implications faced by firm as threats clipart pdf bundle. Topics like issues related to employees, data breaches and records exposed, reported financial losses due to increase security threats can be discussed with this completely editable template. It is available for immediate download depending on the needs and requirements of the user.

Current Potential Implications Faced By Firm Intelligent Infrastructure Rules PDF
This slide provides information regarding the potential implications or concerns existing in firm in terms of increase in issues related to employees such as lack of expertise, ineffectiveness in handling issues, reported financial losses due to financial threats and data breaches with records exposed. Deliver an awe inspiring pitch with this creative Current Potential Implications Faced By Firm Intelligent Infrastructure Rules PDF bundle. Topics like Issues Related To Employees, Reported Financial Losses, Due To Increase Security Threats, Data Breaches And can be discussed with this completely editable template. It is available for immediate download depending on the needs and requirements of the user.
Threat Management At Workplace Current Potential Implications Faced By Firm As Threats Professional Pdf
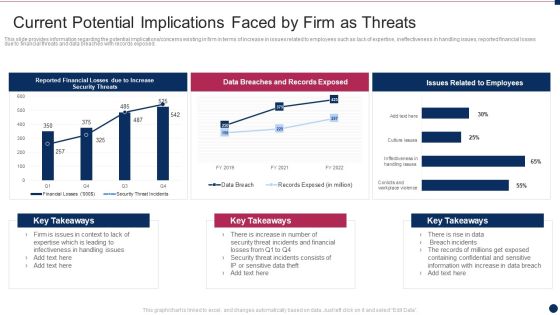
This slide provides information regarding the potential implications concerns existing in firm in terms of increase in issues related to employees such as lack of expertise, ineffectiveness in handling issues, reported financial losses due to financial threats and data breaches with records exposed. Deliver and pitch your topic in the best possible manner with this threat management at workplace current potential implications faced by firm as threats professional pdf. Use them to share invaluable insights on data breaches and records exposed, breach incidents, financial losses and impress your audience. This template can be altered and modified as per your expectations. So, grab it now.

Various Solutions For Effective Project Budget Planning Pictures PDF
This slide covers project and financial management solution which helps in managing income and expenses. It also includes strategic alignment, process automation, financial management and value realization. Presenting various solutions for effective project budget planning pictures pdf to dispense important information. This template comprises four stages. It also presents valuable insights into the topics including strategic alignment, process automation, financial management, value realization. This is a completely customizable PowerPoint theme that can be put to use immediately. So, download it and address the topic impactfully.

Facilitating IT Intelligence Architecture Current Potential Implications Faced By Firm Slides PDF
This slide provides information regarding the potential implications or poncerns existing in firm in terms of increase in issues related to employees such as lack of expertise, ineffectiveness in handling issues, reported financial losses due to financial threats and data breaches with records exposed. Deliver an awe inspiring pitch with this creative Facilitating IT Intelligence Architecture Current Potential Implications Faced By Firm Slides PDF bundle. Topics like Infectiveness In Handling, Expertise Which Is Leading, Incidents And Financial can be discussed with this completely editable template. It is available for immediate download depending on the needs and requirements of the user.
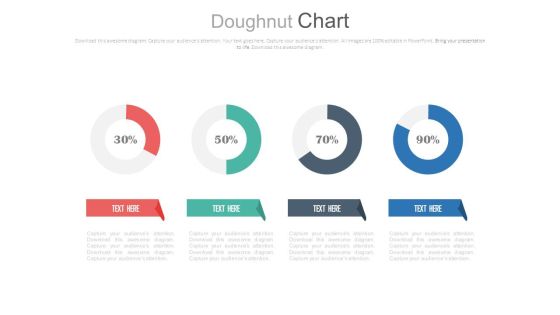
Four Circle Chart With Percentage Ratios Powerpoint Slides
This PowerPoint template has been designed with graphics of four circles and percentage ratios. You may use this dashboard slide design for topics like profit growth and financial planning. This PPT slide is powerful tool to describe your ideas.

Linear Circles Percentage Analysis Charts Powerpoint Slides
This PowerPoint template has been designed with graphics of three circles and percentage ratios. You may use this dashboard slide design for topics like profit growth and financial planning. This PPT slide is powerful tool to describe your ideas.
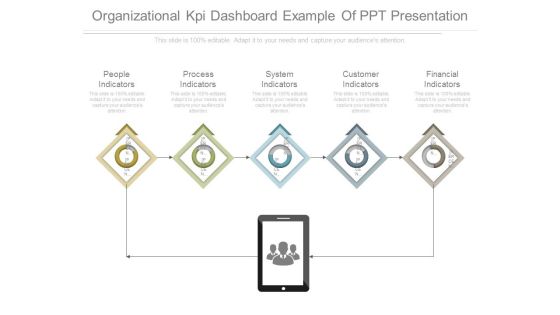
Organizational Kpi Dashboard Example Of Ppt Presentation
This is a organizational kpi dashboard example of ppt presentation. This is a five stage process. The stages in this process are people indicators, process indicators, system indicators, customer indicators, financial indicators.

Corporate Earnings And Risk Metrics Dashboard Guidelines PDF
This slide illustrates graphical representation of risk key performance indicators. It includes financial risks, operational risk and risk expenditure etc. Pitch your topic with ease and precision using this Corporate Earnings And Risk Metrics Dashboard Guidelines PDF. This layout presents information on Financial Risk, Operational Risk Expenditure. It is also available for immediate download and adjustment. So, changes can be made in the color, design, graphics or any other component to create a unique layout.

Finance Dashboard Ppt PowerPoint Presentation Diagrams
This is a finance dashboard ppt powerpoint presentation diagrams. This is a four stage process. The stages in this process are increased efficiency, better business decision making, improved customer experience and engagement, achieved financial savings.

Clear Point Strategy Dashboard Ppt Presentation
This is a clear point strategy dashboard ppt presentation. This is a four stage process. The stages in this process are financial perspective, internal processes perspective, learning and growth perspective, customer perspective.
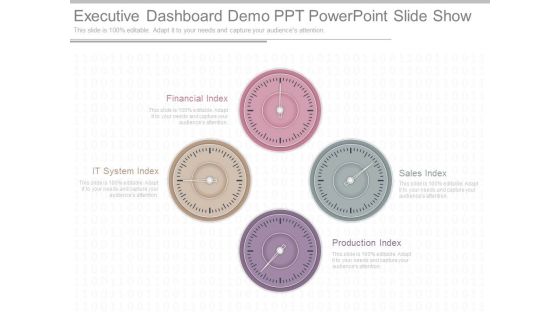
Executive Dashboard Demo Ppt Powerpoint Slide Show
This is a executive dashboard demo ppt powerpoint slide show. This is a four stage process. The stages in this process are financial index, it system index, production index, sales index.

Dashboard Diagram For Finance And Strategic Analysis Powerpoint Slides
This PowerPoint template display graphics of clock with arrows around it and dollar symbol in center. You may use this PPT slide for financial and strategic analysis. This dashboard slide may useful for multilevel status report creation and approval process.

Four Companies With Web Services Powerpoint Slides
This PowerPoint template display graphics of four corporate buildings. You may use this PPT slide for financial and strategic analysis for web services companies. This dashboard slide may useful for multilevel status report creation and approval process.
Four Circles With Percentage Values And Icons Powerpoint Slides
This PowerPoint template displays info graphic diagram of linear circles. This diagram may be used to exhibit financial growth and analysis. Grab center stage with this slide and capture the attention of your audience.

Balanced Scorecard Success Layout Ppt Slide Show
This is a balanced scorecard success layout ppt slide show. This is a four stage process. The stages in this process are clinical quality, customer loyalty, financial viability, operational effectiveness.

Cash Conversion Cycle Ppt PowerPoint Presentation Outline Example Introduction
This is a cash conversion cycle ppt powerpoint presentation outline example introduction. This is a six stage process. The stages in this process are financial capital, working capital management, companys managerial accounting.

Corporate Performance Management Dashboard Ppt Powerpoint Topics
This is a corporate performance management dashboard ppt powerpoint topics. This is a eight stage process. The stages in this process are analysis, reporting, dashboards, financial consolidation, budgeting, forecasting, detailed planning, operational planning, corporate performance management.
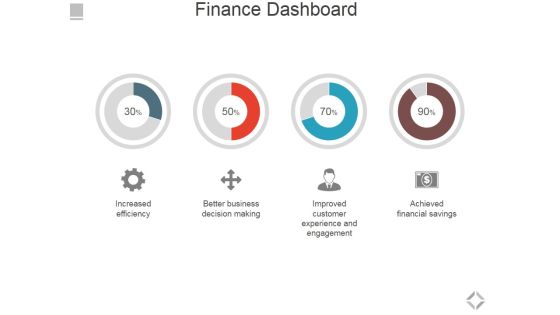
Finance Dashboard Ppt PowerPoint Presentation Layouts Infographics
This is a finance dashboard ppt powerpoint presentation layouts infographics. This is a four stage process. The stages in this process are increased efficiency, better business decision making, improved customer experience and engagement, achieved financial savings.

Clear Point Community Dashboard Example Ppt Slide
This is a clear point community dashboard example ppt slide. This is a four stage process. The stages in this process are internal perspective, learning and growth, financial perspective, customer perspective.

Packaging And Delivering Dashboard With Monthly Key Performance Metrics Microsoft PDF
The following slide showcases dashboard of supply chain with order status key metrics. Main KPIs covered are volume today, global financial performance and inventory. Pitch your topic with ease and precision using this Packaging And Delivering Dashboard With Monthly Key Performance Metrics Microsoft PDF. This layout presents information on Customer, Global Financial Performance, Inventory Distribution. It is also available for immediate download and adjustment. So, changes can be made in the color, design, graphics or any other component to create a unique layout.

Service Resource Planning Ppt PowerPoint Presentation Styles
This is a service resource planning ppt powerpoint presentation styles. This is a five stage process. The stages in this process are crm, demand and capacity planning, engagement management, service delivery management, erp and corporate dashboards, financial management.
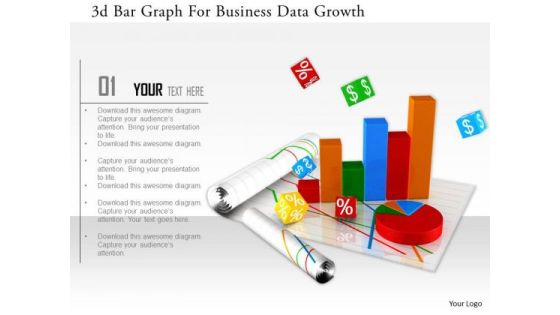
Stock Photo 3d Bar Graph For Business Data Growth Image Graphics For PowerPoint Slide
This image slide has graphics of financial charts and reports. This contains bar graph and pie chart to present business reports. Build an innovative presentations using this professional image slide.

Data Quality Dashboard For Linked Data Download PDF
This slide describes the data quality dashboard for linked data by covering details of account information quality, contact details quality, financial data quality, and missing account information. Deliver an awe inspiring pitch with this creative Data Quality Dashboard For Linked Data Download PDF bundle. Topics like Account Data Quality, Contact Data Quality, Financial Data Quality can be discussed with this completely editable template. It is available for immediate download depending on the needs and requirements of the user.

Knowledge Management Process Model Ppt Slides
This is a knowledge management process model ppt slides. This is a six stage process. The stages in this process are knowledge manager, reports dashboard, metrics manager, financial tracker, resource manager, project tracker, result, strategy, execution.

Business Diagram Diagram For Visual Data Display Presentation Template
Four colored cylindrical bars with percentage values are used to design this power point template. This diagram slide helps to display financial data analysis. Use this diagram for your business and finance related presentations.

Customer Service Focus Ppt PowerPoint Presentation Model
This is a customer service focus ppt powerpoint presentation model. This is a one stage process. The stages in this process are marketing automation, customer service automation, sales force automation, financial system integration.

Customer Service Focus Ppt PowerPoint Presentation Model Icon
This is a customer service focus ppt powerpoint presentation model icon. This is a four stage process. The stages in this process are marketing automation, sales force automation, customer service automation, financial system integration.
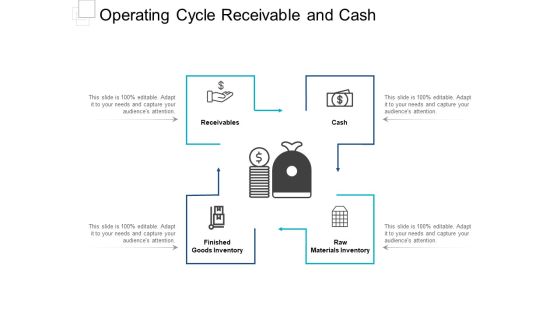
Operating Cycle Receivable And Cash Ppt PowerPoint Presentation Gallery
This is a operating cycle receivable and cash ppt powerpoint presentation gallery. This is a four stage process. The stages in this process are financial capital, working capital management, companys managerial accounting.

Account Aggregation Document Management Presentation Portfolio
This is a account aggregation document management presentation portfolio. This is a nine stage process. The stages in this process are custodian, trading rebalancing, portfolio analytic reporting, account aggregation, data input tools, document management, portfolio accounting, financial planning, crm.

Organizational Kpis Process Indicators Ppt Presentation
This is a organizational kpis process indicators ppt presentation. This is a five stage process. The stages in this process are people indicators, process indicators, system indicators, customer indicators, financial indicators, organizational kpis.

Proposed Services Ppt PowerPoint Presentation Pictures Backgrounds
This is a proposed services ppt powerpoint presentation pictures backgrounds. This is a five stage process. The stages in this process are secondary research, financial analysis, big data analytics, market research.

Advanced Email Metrics And Analysis Services Diagram Slide
This is a advanced email metrics and analysis services diagram slide. This is a four stage process. The stages in this process are analytics data warehouse, data mining, financial modeling.

Content Ppt PowerPoint Presentation Infographics Diagrams
This is a content ppt powerpoint presentation infographics diagrams. This is a thirteen stage process. The stages in this process are business highlights, financial highlights, products offering, sales performance dashboard, sales revenue by region.

Stock Photo Pile Of Dollars Chained And Locked PowerPoint Slide
This image displays dollar bundles locked in chains. Use this image slide, in your PowerPoint presentations to express views on financial security and monetary savings. This image will enhance the quality of your presentations.

Stock Photo Red Euro Symbol With Padlock PowerPoint Slide
This image slide displays red color Euro symbol with padlock. Use this image, in your PowerPoint presentations to express views on financial security and monetary savings. This image slide will enhance the quality of your presentations.

Inventory Kpis Ppt PowerPoint Presentation Infographic Template Display
This is a inventory kpis ppt powerpoint presentation infographic template display. This is a three stage process. The stages in this process are supply chain metrics, financial metrics, percent margins, return on assets, inventory turnover.

Stock Photo 3d Dollars Stack Unlocked Security Concept PowerPoint Slide
Graphic of dollar bundle is inside the lock is used in this power point image template. We have displayed concept of financial security in this image. Use this image for security or finance related topics.
Sales Motivation Outline Ppt PowerPoint Presentation Icon
This is a sales motivation outline ppt powerpoint presentation icon. This is a seven stage process. The stages in this process are sales performance dashboard template, sales target for current financial year, talk about the mission, encourage leadership, personalize rewards.
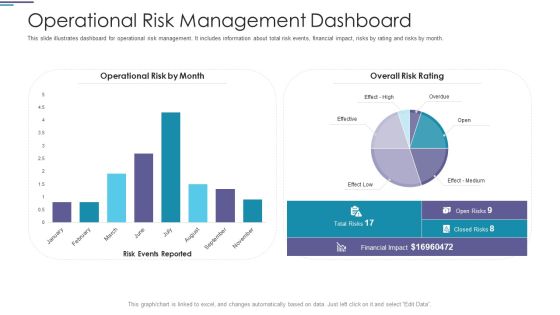
Operational Risk Management Dashboard Ppt PowerPoint Presentation Styles Pictures PDF
This slide illustrates dashboard for operational risk management. It includes information about total risk events, financial impact, risks by rating and risks by month.Deliver an awe-inspiring pitch with this creative operational risk management dashboard ppt powerpoint presentation styles pictures pdf. bundle. Topics like financial impact, operational risk by month, overall risk rating can be discussed with this completely editable template. It is available for immediate download depending on the needs and requirements of the user.

Stock Photo Lifesaving Belts On Dollars PowerPoint Slide
Define your ideas in inspiring manner with this image of lifesaving belts with dollars. Use this image to describe the concept of financial crisis. You may use this image to share a plan to achieve the desired goals.

Stock Photo Calculator On Dollars Background PowerPoint Slide
This image slide displays calculator on dollar notes. This PowerPoint template contains the concept of monetary calculation. Use this slide for displaying financial calculation in any presentation and get noticed by your viewers.

Stock Photo Graphics Of Padlock With Us Dollar Pwerpoint Slide
This business image has been designed with graphic of padlock with US dollar. This image contains the concept of finance and security. Make a quality presentation for financial security.

Stock Photo Textured Lock With Us Dollar Pwerpoint Slide
This business image has been designed with graphic of textured lock with US dollar. This image contains the concept of finance and security. Make a quality presentation for financial security.
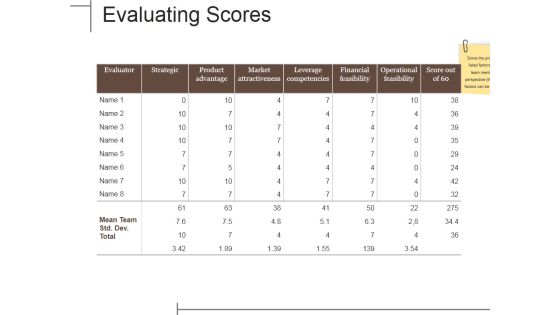
Evaluating Scores Ppt PowerPoint Presentation Infographics Rules
This is a evaluating scores ppt powerpoint presentation infographics rules. This is a seven stage process. The stages in this process are strategic, product advantage, market attractiveness, leverage competencies, financial feasibility, operational feasibility.

Operations Plan Ppt PowerPoint Presentation Model Samples
This is a operations plan ppt powerpoint presentation model samples. This is a three stage process. The stages in this process are sales, marketing, operation, people, financial and admin.

Market Competitiveness Template 1 Ppt PowerPoint Presentation Slides Template
This is a market competitiveness template 1 ppt powerpoint presentation slides template. This is a three stage process. The stages in this process are financial position, advertising, market share, brand image, customer loyalty.
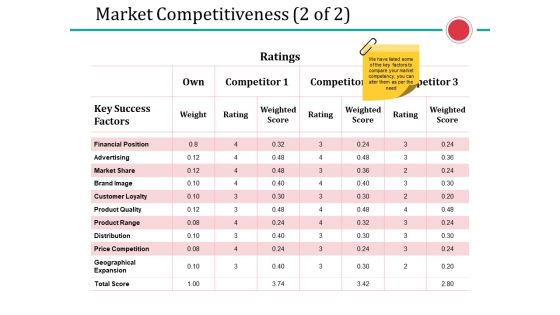
Market Competitiveness Template 2 Ppt PowerPoint Presentation Portfolio Graphic Tips
This is a market competitiveness template 2 ppt powerpoint presentation portfolio graphic tips. This is a three stage process. The stages in this process are financial position, advertising, market share, brand image, customer loyalty.
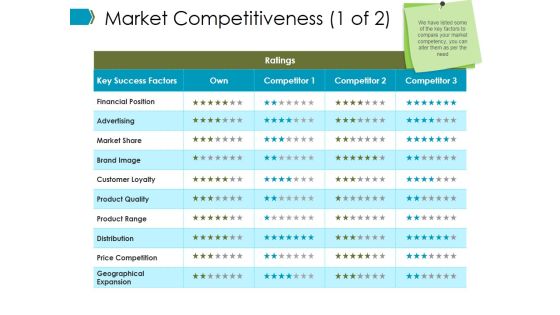
Market Competitiveness Template Ppt PowerPoint Presentation Summary Ideas
This is a market competitiveness template ppt powerpoint presentation summary ideas. This is a three stage process. The stages in this process are financial position, advertising, market share, brand image, customer loyalty.

Stock Photo Red Dollar Symbol With Metallic Combination Lock PowerPoint Slide
This image slide displays red color dollar symbol with combination lock. Use this image, in your PowerPoint presentations to express views on financial security and monetary savings. This image slide will enhance the quality of your presentations.
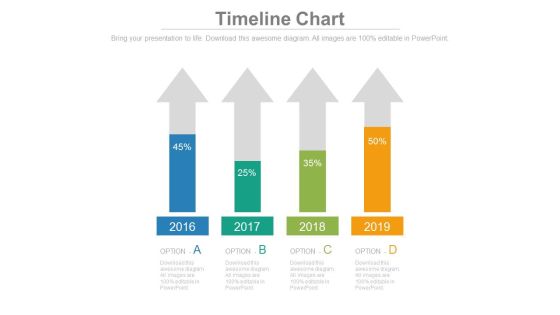
Four Arrows With Percentage Data Analysis Powerpoint Slides
This timeline template can be used for multiple purposes including financial planning, new milestones and tasks. It contains four upward arrows with percentage values. Download this PowerPoint timeline template to make impressive presentations.
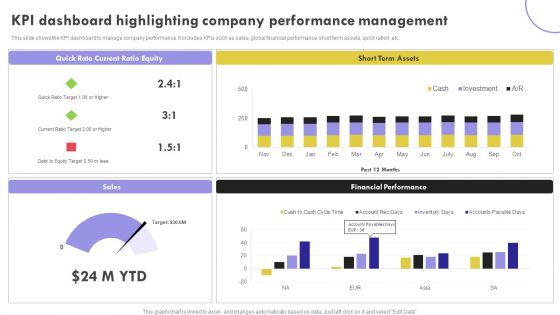
KPI Dashboard Highlighting Company Performance Management Inspiration PDF
This slide shows the KPI dashboard to manage company performance. It includes KPIs such as sales, global financial performance, short term assets, quick ration, etc.Showcasing this set of slides titled KPI Dashboard Highlighting Company Performance Management Inspiration PDF. The topics addressed in these templates are Current Ratio, Term Assets, Financial Performance. All the content presented in this PPT design is completely editable. Download it and make adjustments in color, background, font etc. as per your unique business setting.

Stock Photo Graphics For Business Reports And Charts PowerPoint Slide
This image contains graphics of business reports and charts. Download this image for business and sales presentations where you have to focus on financial growth. Dazzle the audience with your thoughts.
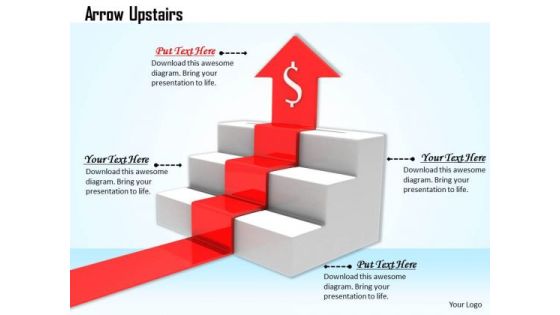
Stock Photo Red Arrow Moving Upwards In Stairs PowerPoint Slide
This image has been designed with red arrow moving upward on stairs with dollar symbol. This Image clearly relates to concept of financial growth. Use our image to drive the point to your audience and constantly attract their attention.

Stock Photo Red Growth Arrow With Percentage Symbol PowerPoint Slide
This image has been designed with red growth arrow with percentage symbol. This Image clearly relates to concept of financial growth. Use our image to drive the point to your audience and constantly attract their attention.

Stock Photo Smartphone With Red Upward Arrow PowerPoint Slide
This image displays red growth arrow on tablet. This image has been designed to display progress in your presentations. Use this image, in your presentations to express views on financial growth, success and marketing. Create eye-catching presentations using this image.
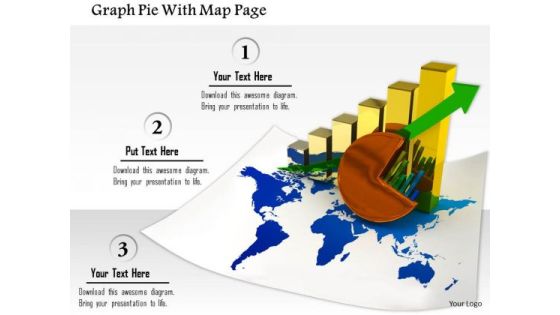
Stock Photo Graph Pie With Map Page PowerPoint Slide
This image slide contains business charts on world map. This image is designed with bar graph and pie chart on world map depicting global economy. Use this image slide to represent financial growth in any business presentation.

Stock Photo Green Numbers Of 2015 On Dollars PowerPoint Slide
Green numbers of 2015 year and dollars has been used to decorate this power point template slide. This image slide contains the concept of year based financial planning. Display planning in your finance and business related presentations.

Stock Photo Hundred Percentage Inside Lock Safety PowerPoint Slide
Concept of financial safety has been displayed in this image slide with suitable graphics. This slide has been designed with graphic of hundred percentage value and lock. Use this professional slide to make build innovative presentation on safety related topics.

Stock Photo Dollars Covered With Lock And Chain PowerPoint Slide
This Power Point image template has been designed with graphic of dollar and chain. In this image dollar is covered with chain which shows the concept of safety. Use this image template financial security related presentations.

Stock Photo Shopping Carts In Shape Of Dollar Symbol PowerPoint Slide
Use this image to make financial and business presentations. This image displays shopping carts in shape of dollar symbol. Concept of money and finance can be described with this imge.
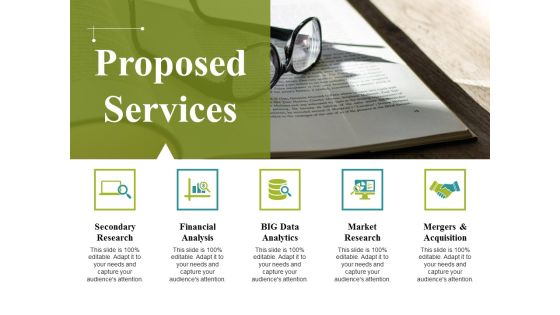
Proposed Services Ppt PowerPoint Presentation Summary Graphics
This is a proposed services ppt powerpoint presentation summary graphics. This is a five stage process. The stages in this process are secondary research, financial analysis, big data analytics, market research, mergers and acquisition.

Proposed Services Ppt PowerPoint Presentation Model Samples
This is a proposed services ppt powerpoint presentation model samples. This is a five stage process. The stages in this process are secondary research, financial analysis, big data analytics, market research, mergers and acquisition.

Stock Photo Dollar Bundles Safe With Lock And Chain Image Graphics For PowerPoint Slide
This image slide displays dollar bundle locked with chain. Use this image, in your PowerPoint presentations to express views on financial security and monetary savings. This image slide will enhance the quality of your presentations.

Stock Photo 3d Dollar Symbol With Chain And Text Boxes PowerPoint Slide
This image slide has been designed with graphic of dollar notes locked with chain. This slide depicts concept of financial security and investment. Use this editable slide for your wealth and finance related topics.

Real Estate Development Analysis Powerpoint Slides Show
This is a real estate development analysis powerpoint slides show. This is a five stage process. The stages in this process are development analysis, financial and economic analysis, environmental data impact analysis, customer base management analysis, real estate development analysis.

Stock Photo 3d Box Full With Dollars And Text Box PowerPoint Slide
Graphic of 3d box with dollars has been used to design this image slide. This slide contains money gift box depicting financial growth. Use this slide for your business and finance related presentations.
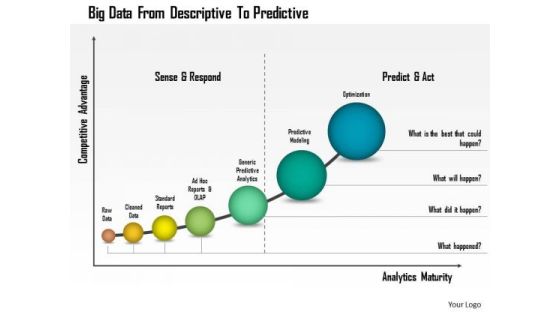
Business Diagram Big Data From Descriptive To Predictive Presentation Template
This business diagram has been designed with graphic of linear bar graph. This growing bar graph depicts the concept of big data analysis. Use this professional diagram for your financial and business analysis.
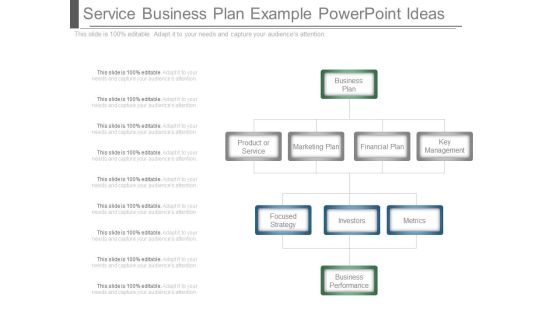
Service Business Plan Example Powerpoint Ideas
This is a service business plan example powerpoint ideas. This is a nine stage process. The stages in this process are business plan, product or service, marketing plan, financial plan, key management, focused strategy, investors, metrics.

Stock Photo Smart Phone With Downturn Arrow At Display PowerPoint Slide
This image displays yellow downward arrow on tablet. This image has been designed to display progress in your presentations. Use this image, in your presentations to express views on financial degradation and losses. Create eye-catching presentations using this image.
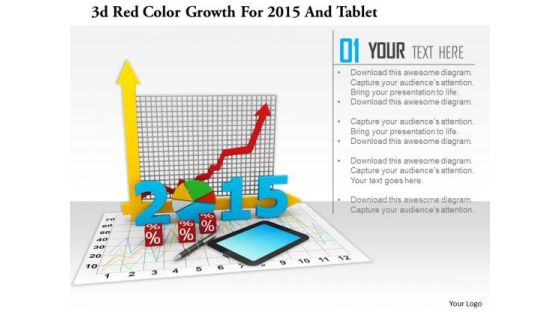
Stock Photo 3d Red Color Growth For 2015 And Tablet PowerPoint Slide
This image slide has graphics of financial charts and reports. This contains bar graph and pie chart to present business reports. Build an innovative presentation using this professional image slide.

Logistics Dashboard For XYZ Logistic Company Orders Slides PDF
The slide shows the logistic measurement dashboard for measuring order status, total orders, overdue shipments, global financial performance etc.Deliver and pitch your topic in the best possible manner with this logistics dashboard for xyz logistic company orders slides pdf. Use them to share invaluable insights on global financial performance, overdue shipments, late vendor shipments and impress your audience. This template can be altered and modified as per your expectations. So, grab it now.

Dashboard Related To Logistic Company Electronics Ideas PDF
This slide shows the dashboard related to the ABC logistic company which includes order status, global financial performance, volume, inventory details, etc. Deliver an awe inspiring pitch with this creative dashboard related to logistic company electronics ideas pdf bundle. Topics like inventory, global financial performance, product can be discussed with this completely editable template. It is available for immediate download depending on the needs and requirements of the user.
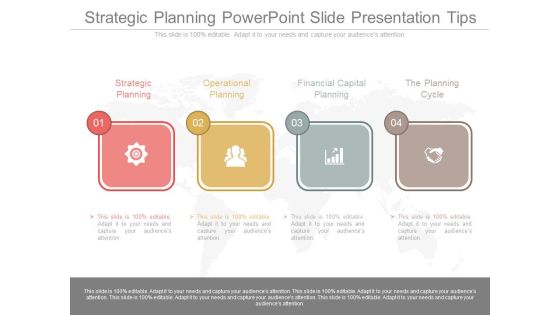
Strategic Planning Powerpoint Slide Presentation Tips
This is a strategic planning powerpoint slide presentation tips. This is a four stage process. The stages in this process are strategic planning, operational planning, financial capital planning, the planning cycle.

Enterprise Risk Management Strategy Diagram Ppt Sample
This is a enterprise risk management strategy diagram ppt sample. This is a three stage process. The stages in this process are risk management activities, input and risk identification, risk based monitoring, policy development, financial reporting, operational, contract and acquisition.\n\n\n\n\n\n\n\n

Classification Of Working Capital Ppt PowerPoint Presentation Pictures Icons
This is a classification of working capital ppt powerpoint presentation pictures icons. This is a seven stage process. The stages in this process are financial capital, working capital management, companys managerial accounting.

Business Development Powerpoint Slide Background Picture
This is a business development powerpoint slide background picture. This is a five stage process. The stages in this process are business development, public accounting, internal auditing, finance skills, financial statements.

Operations Plan Ppt PowerPoint Presentation Pictures Clipart
This is a operations plan ppt powerpoint presentation pictures clipart. This is a three stage process. The stages in this category, sales, marketing, operation, people, financial and admin, key initiatives, prioritization.

Area Chart Ppt PowerPoint Presentation Pictures Files
This is a area chart ppt powerpoint presentation pictures files. This is a two stage process. The stages in this process are product, sales, in percentage, financial year, business.

Line Chart Ppt PowerPoint Presentation Pictures Templates
This is a line chart ppt powerpoint presentation pictures templates. This is a two stage process. The stages in this process are sales in percentage, financial years, business, marketing, growth.
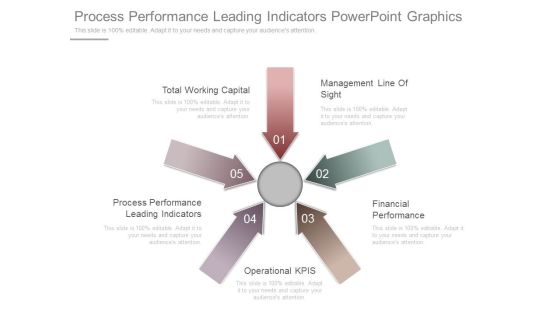
Process Performance Leading Indicators Powerpoint Graphics
This is a process performance leading indicators powerpoint graphics. This is a five stage process. The stages in this process are total working capital, management line of sight, process performance leading indicators, financial performance, operational kpis.

Project Management Key Performance Indicators Balanced Scorecard Introduction PDF
This slide shows key performance indicators scorecard for the project management of the organization. It includes financial status, consumer satisfaction, business growth and internal objectives. Pitch your topic with ease and precision using this Project Management Key Performance Indicators Balanced Scorecard Introduction PDF. This layout presents information on Financial Status, Business Growth, Consumer Satisfaction. It is also available for immediate download and adjustment. So, changes can be made in the color, design, graphics or any other component to create a unique layout.

Management Team Template 1 Ppt PowerPoint Presentation Pictures
This is a management team template 1 ppt powerpoint presentation pictures. This is a three stage process. The stages in this process are founder ceo, graphic designer, financial advisor.
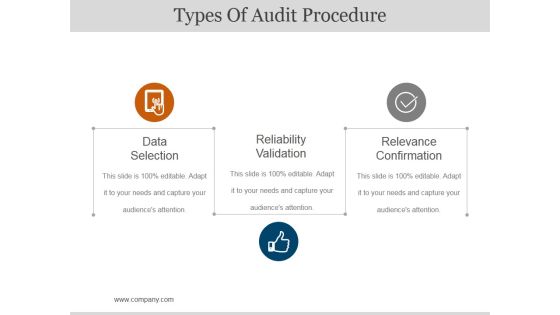
Types Of Audit Procedure Ppt PowerPoint Presentation Pictures
This is a types of audit procedure ppt powerpoint presentation pictures. This is a five stage process. The stages in this process are financial statements audit, operational audits, forensic audits, compliance audits, comprehensive audits.

Management Team Template 1 Ppt PowerPoint Presentation Pictures Templates
This is a management team template 1 ppt powerpoint presentation pictures templates. This is a three stage process. The stages in this process are mary clark, john smith, charly doe, graphic designer, financial advisor.
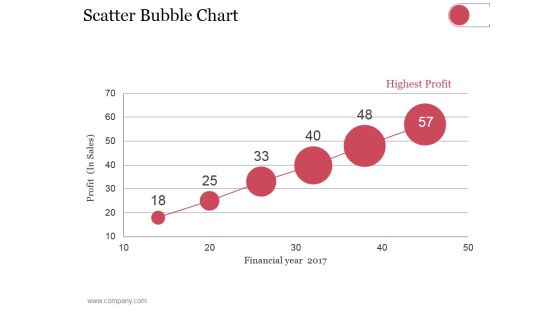
Scatter Bubble Chart Ppt PowerPoint Presentation Summary Pictures
This is a scatter bubble chart ppt powerpoint presentation summary pictures. This is a six stage process. The stages in this process are highest profit, financial year, profit in sales.

Table Of Content Ppt PowerPoint Presentation Pictures Example
This is a table of content ppt powerpoint presentation pictures example. This is a six stage process. The stages in this process are business overview, financial performance, client and project updates, competitors analysis, future roadmap.
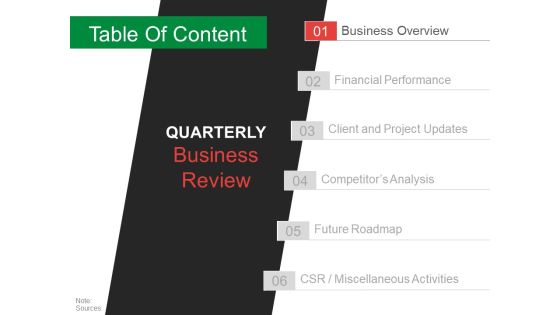
Table Of Content Template 2 Ppt PowerPoint Presentation Pictures Vector
This is a table of content template 2 ppt powerpoint presentation pictures vector. This is a six stage process. The stages in this process are business overview, financial performance, client and project updates, competitor s analysis, future roadmap.
