Financial Snapshot

Quantitative Bar Chart For Data Analysis Ppt PowerPoint Presentation Model Graphic Tips
This is a quantitative bar chart for data analysis ppt powerpoint presentation model graphic tips. This is a two stage process. The stages in this process are financial analysis, quantitative, statistical modelling.

Data Chart For Distribution Of Vehicles By Origin And Type Ppt PowerPoint Presentation Infographics Topics
This is a data chart for distribution of vehicles by origin and type ppt powerpoint presentation infographics topics. This is a four stage process. The stages in this process are financial analysis, quantitative, statistical modelling.
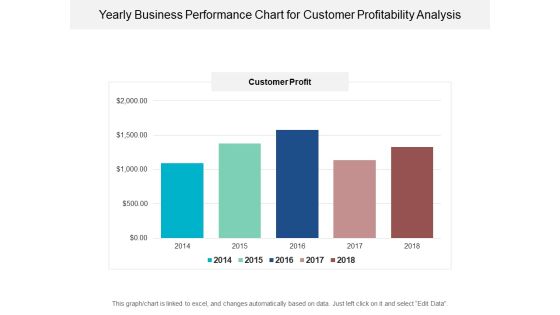
Yearly Business Performance Chart For Customer Profitability Analysis Ppt PowerPoint Presentation Ideas Picture
This is a yearly business performance chart for customer profitability analysis ppt powerpoint presentation ideas picture. This is a five stage process. The stages in this process are financial analysis, quantitative, statistical modelling.

Monthly Social Media Dashboard Ppt PowerPoint Presentation Infographics Files
This is a monthly social media dashboard ppt powerpoint presentation infographics files. This is a four stage process. The stages in this process are marketing, business, financial, data analysis, management.
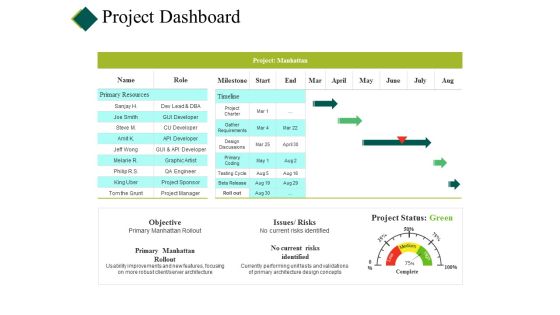
Project Dashboard Ppt PowerPoint Presentation Pictures Backgrounds
This is a project dashboard ppt powerpoint presentation pictures backgrounds. This is a four stage process. The stages in this process are cost, planning, table, project report, data management.
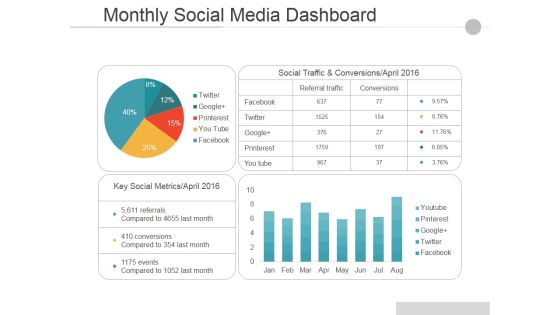
Monthly Social Media Dashboard Ppt PowerPoint Presentation Pictures Guide
This is a monthly social media dashboard ppt powerpoint presentation pictures guide. This is a two stage process. The stages in this process are social traffic and conversions april, key social metrics april, facebook, twitter, google.

Dashboard Ppt PowerPoint Presentation Infographics
This is a dashboard ppt powerpoint presentation infographics. This is a three stage process. The stages in this process are business, marketing, dashboard, analysis, finance.

Finance Dashboard Ppt PowerPoint Presentation Design Ideas
This is a finance dashboard ppt powerpoint presentation design ideas. This is a two stage process. The stages in this process are sales, operating expenses, operating income, net income.
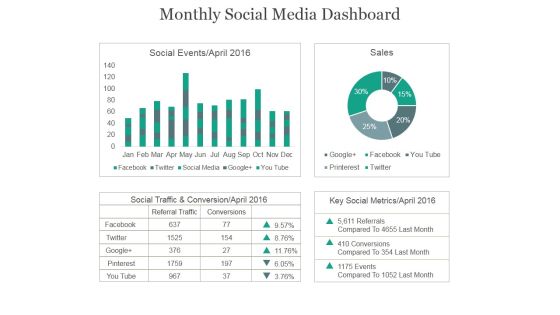
Monthly Social Media Dashboard Ppt PowerPoint Presentation Example 2015
This is a monthly social media dashboard ppt powerpoint presentation example 2015. This is a four stage process. The stages in this process are social events, sales, social traffic, conservation, key social metrics.
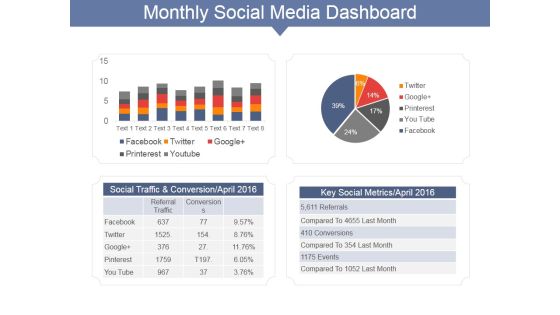
Monthly Social Media Dashboard Ppt PowerPoint Presentation Gallery Show
This is a monthly social media dashboard ppt powerpoint presentation gallery show. This is a two stage process. The stages in this process are social traffic and conversion april, key social metrics april, facebook, twitter.
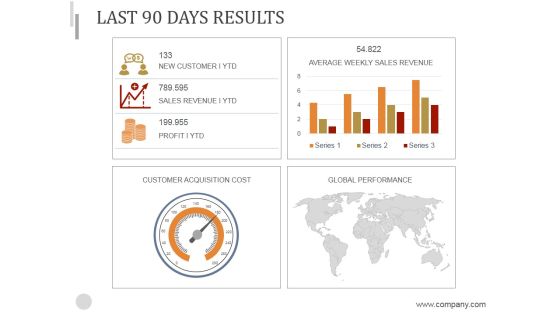
Last 90 Days Results Ppt PowerPoint Presentation Background Image
This is a last 90 days results ppt powerpoint presentation background image. This is a four stage process. The stages in this process are customer acquisition cost, global performance, average weekly sales revenue.
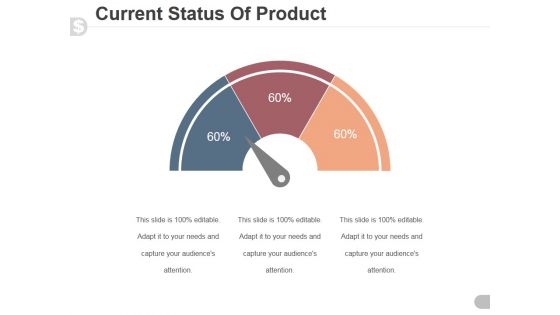
Current Status Of Product Ppt PowerPoint Presentation Designs Download
This is a current status of product ppt powerpoint presentation designs download. This is a three stage process. The stages in this process are speedometer, dashboard, business, marketing, finance.

Milestones For The Next Reporting Period Template Ppt PowerPoint Presentation Background Images
This is a milestones for the next reporting period template ppt powerpoint presentation background images. This is a six stage process. The stages in this process are jan, feb, mar, apr, may, jun.
Website Performance Review Ppt PowerPoint Presentation Icon Deck
This is a website performance review ppt powerpoint presentation icon deck. This is a three stage process. The stages in this process are conversion rate, average visit value goal, visits.

Crm Dashboard Sales Dashboard Template Ppt PowerPoint Presentation Microsoft
This is a crm dashboard sales dashboard template ppt powerpoint presentation microsoft. This is a four stage process. The stages in this process are lead owner breakdown, month over month closing trend, total lead ownership, sales by product march 2017.

Crm Dashboard Intranet Dashboard Ppt PowerPoint Presentation Outline Professional
This is a crm dashboard intranet dashboard ppt powerpoint presentation outline professional. This is a four stage process. The stages in this process are events count, page views, page views, country.
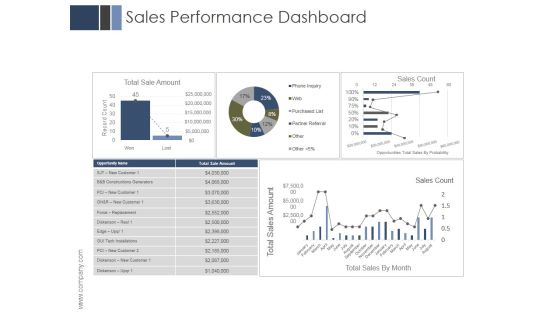
Sales Performance Dashboard Ppt PowerPoint Presentation Example 2015
This is a sales performance dashboard ppt powerpoint presentation example 2015. This is a four stage process. The stages in this process are business, marketing, management, finance, dashboard.

Crm Dashboard Top Customer Ppt PowerPoint Presentation Ideas
This is a crm dashboard top customer ppt powerpoint presentation ideas. This is a five stage process. The stages in this process are customer.

Crm Sales Rep Dashboard Ppt PowerPoint Presentation Clipart
This is a crm sales rep dashboard ppt powerpoint presentation clipart. This is a three stage process. The stages in this process are identity, qualification, develop, proposal, negotiation.
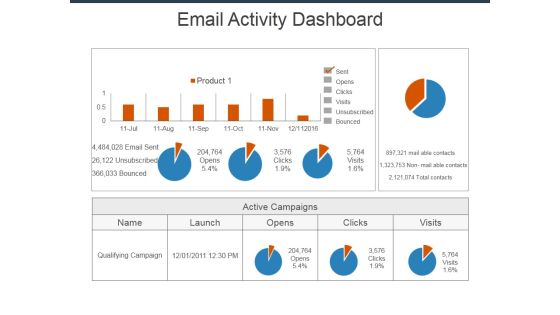
Email Activity Dashboard Ppt Powerpoint Presentation Styles Summary
This is a email activity dashboard ppt powerpoint presentation styles summary. This is a three stage process. The stages in this process are sent, opens, clicks, visits, unsubscribed, bounced, qualifying campaign.

Key Performance Indicators Template 2 Ppt PowerPoint Presentation Model Example
This is a key performance indicators template 2 ppt powerpoint presentation model example. This is a four stage process. The stages in this process are objective, measures, targets, invites, indicators.

Crm Dashboard This Year Sales Vs Last Year Sales Ppt PowerPoint Presentation Layouts Outline
This is a crm dashboard this year sales vs last year sales ppt powerpoint presentation layouts outline. This is a two stage process. The stages in this process are sales given in fiscal month, this year sales, last year sales.

Cash Flow Statement Kpis Template Ppt PowerPoint Presentation Pictures Diagrams
This is a cash flow statement kpis template ppt powerpoint presentation pictures diagrams. This is a four stage process. The stages in this process are operations, financing activities, investing activities, net increase in cash.

Data Collection And Analysis Control Chart Ppt PowerPoint Presentation Visuals
This is a data collection and analysis control chart ppt powerpoint presentation visuals. This is a ten stage process. The stages in this process are upper limit, centerline, lower limit, plotted points.
Project Health Card Ppt PowerPoint Presentation Icon Grid
This is a project health card ppt powerpoint presentation icon grid. This is a six stage process. The stages in this process are cost, planning, table, project report, data management.

Last 90 Days Results Ppt PowerPoint Presentation Graphics
This is a last 90 days results ppt powerpoint presentation graphics. This is a five stage process. The stages in this process are new customer ytd, average weekly sales revenue, above sales target i ytd, customer acquisition cost, global performance.

Balance Sheet Kpis Template 3 Ppt PowerPoint Presentation Slides Brochure
This is a balance sheet kpis template 3 ppt powerpoint presentation slides brochure. This is a four stage process. The stages in this process are current assets, current liabilities, total liabilities, total assets.
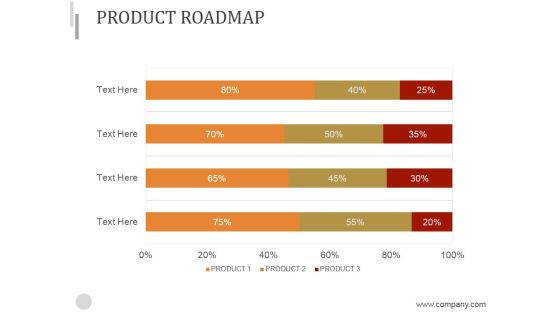
Product Roadmap Ppt PowerPoint Presentation Inspiration
This is a product roadmap ppt powerpoint presentation inspiration. This is a four stage process. The stages in this process are roadmap, finance, strategy, success, management.

P And L Kpis Template 2 Ppt PowerPoint Presentation Styles Objects
This is a p and l kpis template 2 ppt powerpoint presentation styles objects. This is a four stage process. The stages in this process are revenue, cogs, operating profit, net profit.

P And L Kpis Template 1 Ppt PowerPoint Presentation Model Inspiration
This is a p and l kpis template 1 ppt powerpoint presentation model inspiration. This is a four stage process. The stages in this process are revenue, cogs, operating profit, net profit.
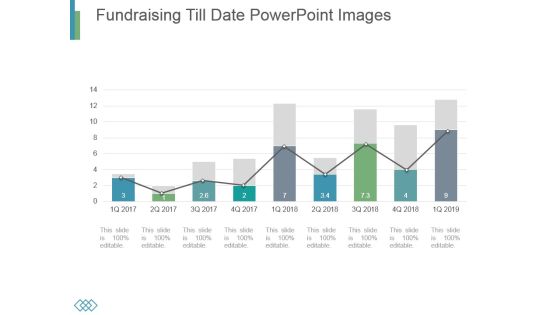
Fundraising Till Date Powerpoint Images
This is a fundraising till date powerpoint images. This is a nine stage process. The stages in this process are business, marketing, growth, timeline, management.

Adoption Curve Ppt PowerPoint Presentation Designs
This is a adoption curve ppt powerpoint presentation designs. This is a five stage process. The stages in this process are innovators, early adopters, early majority, late majority, laggards.

Addressable Market In Sector 1 Ppt PowerPoint Presentation Outline Shapes
This is a addressable market in sector 1 ppt powerpoint presentation outline shapes. This is a two stage process. The stages in this process are fossil fuels, nuclear, bioenergy, biofuels.

data collection and analysis control chart ppt powerpoint presentation styles
This is a data collection and analysis control chart ppt powerpoint presentation styles. This is a one stage process. The stages in this process are upper limit, centerline, plotted points, lower limit, point labels.

Balance Sheet Kpis Tabular Form Ppt PowerPoint Presentation Show Example Introduction
This is a balance sheet kpis tabular form ppt powerpoint presentation show example introduction. This is a four stage process. The stages in this process are current assets, current liabilities, total assets, total liabilities.

Cash Flow Statement Kpis Tabular Form Ppt PowerPoint Presentation Infographics Professional
This is a cash flow statement kpis tabular form ppt powerpoint presentation infographics professional. This is a four stage process. The stages in this process are operations, financing activities, investing activities, net increase in cash.

Balance Sheet Kpis Template 1 Ppt PowerPoint Presentation Professional Graphics Download
This is a balance sheet kpis template 1 ppt powerpoint presentation professional graphics download. This is a four stage process. The stages in this process are current assets, current liabilities, total assets, total liabilities.

Data Collection And Analysis Control Chart Ppt PowerPoint Presentation Model Backgrounds
This is a data collection and analysis control chart ppt powerpoint presentation model backgrounds. This is a two stage process. The stages in this process are business, marketing, strategy, finance, analysis.

Data Collection Histograms Ppt PowerPoint Presentation Design Templates
This is a data collection histograms ppt powerpoint presentation design templates. This is a five stage process. The stages in this process are histogram, business, marketing, analysis, chart.

data collection scatter diagram ppt powerpoint presentation inspiration
This is a data collection scatter diagram ppt powerpoint presentation inspiration. This is a three stage process. The stages in this process are business, planning, marketing, scatter diagram, finance.

Operational Highlights Ppt PowerPoint Presentation Pictures Maker
This is a operational highlights ppt powerpoint presentation pictures maker. This is a four stage process. The stages in this process are business, marketing, growth, innovation, sale.

Column Chart Ppt PowerPoint Presentation Show Pictures
This is a column chart ppt powerpoint presentation show pictures. This is a six stage process. The stages in this process are business, finance, planning, years, marketing.
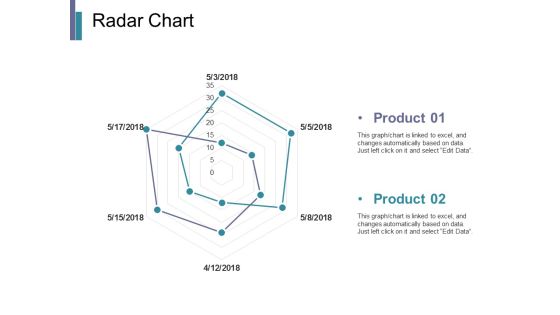
Radar Chart Ppt PowerPoint Presentation Infographics Pictures
This is a radar chart ppt powerpoint presentation infographics pictures. This is a two stage process. The stages in this process are business, marketing, strategy, planning, finance.

Clustered Column Template 1 Ppt PowerPoint Presentation Pictures
This is a clustered column template 1 ppt powerpoint presentation pictures. This is a one stage process. The stages in this process are product, business, marketing, management, strategy.

Portfolio Evaluation Template 2 Ppt PowerPoint Presentation Picture
This is a portfolio evaluation template 2 ppt powerpoint presentation picture. This is a five stage process. The stages in this process are business, strategy, marketing, analysis, finance, chart and graph.

Email Marketing Performance Chart Ppt Powerpoint Presentation Pictures Show
This is a email marketing performance chart ppt powerpoint presentation pictures show. This is a nine stage process. The stages in this process are finance, planning, marketing, business, management, strategy.

Sales Performance Reporting Ppt PowerPoint Presentation Ideas Pictures
This is a sales performance reporting ppt powerpoint presentation ideas pictures. This is a six stage process. The stages in this process are top opportunities, sales goal, sales funnel, new customers, top selling plans, top sales reps.
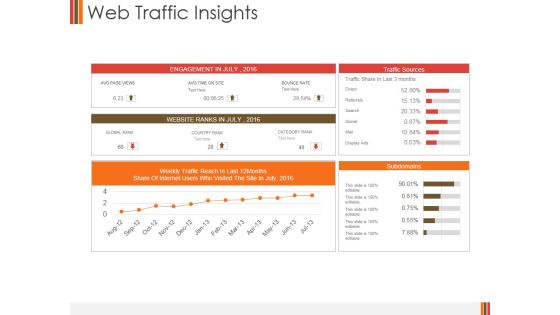
Web Traffic Insights Ppt PowerPoint Presentation Pictures Guide
This is a web traffic insights ppt powerpoint presentation pictures guide. This is a five stage process. The stages in this process are engagement in, website ranks, subdomains, traffic sources.

Competitor Analysis Template Ppt PowerPoint Presentation Pictures Graphics Template
This is a competitor analysis template ppt powerpoint presentation pictures graphics template. This is a four stage process. The stages in this process are business, strategy, marketing, planning, net profit margin.

Competitor Positioning Ppt PowerPoint Presentation Pictures File Formats
This is a competitor positioning ppt powerpoint presentation pictures file formats. This is a two stage process. The stages in this process are business, strategy, analysis, planning, market growth, company growth.
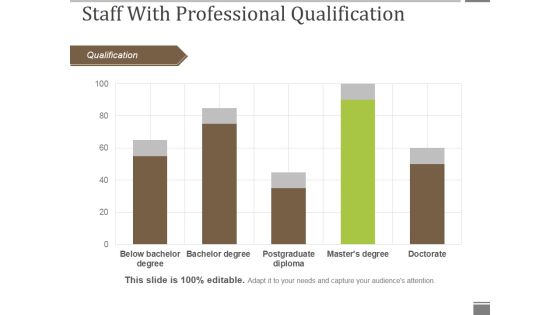
Staff With Professional Qualification Ppt PowerPoint Presentation Gallery Graphics Pictures
This is a staff with professional qualification ppt powerpoint presentation gallery graphics pictures. This is a five stage process. The stages in this process are qualification, bar graph, business, marketing, success.
Workforce Diversity By Region Ppt PowerPoint Presentation Icon Graphics Pictures
This is a workforce diversity by region ppt powerpoint presentation icon graphics pictures. This is a four stage process. The stages in this process are by region, bar graph, business, presentation, marketing.
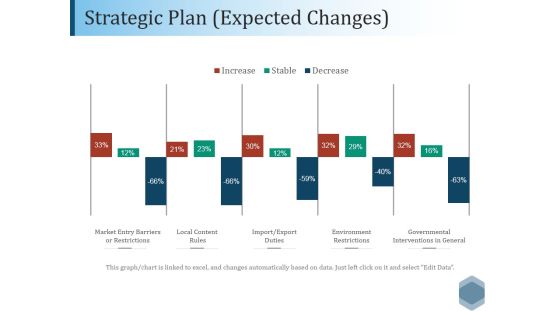
Strategic Plan Expected Changes Ppt PowerPoint Presentation Pictures Outline
This is a strategic plan expected changes ppt powerpoint presentation pictures outline. This is a five stage process. The stages in this process are market entry barriers or restrictions, local content, rules, import export, duties, environment restrictions, governmental interventions in general.

Real Estate Home Price Index Template 2 Ppt PowerPoint Presentation Pictures
This is a real estate home price index template 2 ppt powerpoint presentation pictures. This is a one stage process. The stages in this process are finance, planning, management, marketing, strategy.

Value Addition Due To Branding Template 1 Ppt PowerPoint Presentation Pictures Inspiration
This is a value addition due to branding template 1 ppt powerpoint presentation pictures inspiration. This is a three stage process. The stages in this process are business, marketing, strategy, finance, planning.

Company Cash Flow Statement Over Years Ppt PowerPoint Presentation Gallery
This is a company cash flow statement over years ppt powerpoint presentation gallery. This is ten stage process. The stages in this process are financial result, financial position, share capital, equity share data.

Cash Flow Management Order Control Ppt PowerPoint Presentation Design Ideas
This is a cash flow management order control ppt powerpoint presentation design ideas. This is a five stage process. The stages in this process are management, cash flow management, budget, financial analysis.

Bar Graph Icon For Data Analysis Ppt PowerPoint Presentation Pictures Ideas
This is a bar graph icon for data analysis ppt powerpoint presentation pictures ideas. This is a four stage process. The stages in this process are financial analysis, quantitative, statistical modelling.

Agency Performance Template 2 Ppt PowerPoint Presentation Graphics
This is a agency performance template 2 ppt powerpoint presentation graphics. This is a four stage process. The stages in this process are view ability, ad fraud, industry snapshot, brand safety, tra score.
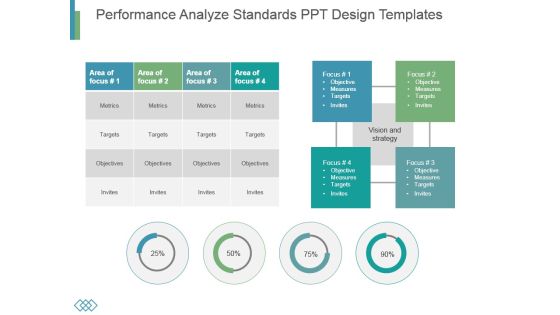
Performance Analyze Standards Ppt Design Templates
This is a performance analyze standards ppt design templates. This is a four stage process. The stages in this process are metrics, targets, objectives, invites.

 Home
Home