Financial Ratio Analysis

Business Financial Ratios Evaluation Framework Ppt PowerPoint Presentation File Tips PDF
Pitch your topic with ease and precision using this business financial ratios evaluation framework ppt powerpoint presentation file tips pdf. This layout presents information on liquidity ratio, debt ratio, profitability ratio. It is also available for immediate download and adjustment. So, changes can be made in the color, design, graphics or any other component to create a unique layout.
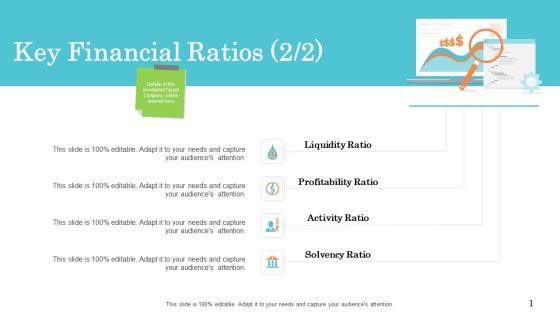
Steps In M And A Process Key Financial Ratios Grid Inspiration PDF
Presenting steps in m and a process key financial ratios grid inspiration pdf to provide visual cues and insights. Share and navigate important information on four stages that need your due attention. This template can be used to pitch topics like liquidity ratio, profitability ratio, activity ratio, solvency ratio. In addtion, this PPT design contains high resolution images, graphics, etc, that are easily editable and available for immediate download.

IT Firm Financial Statement Information Technology Company Valuation Ratios Demonstration PDF
The following slide highlights the valuation ratio of the Information technology company to assess the organizations worth on the basis of share price, sales, and market capitalization, Key ratios included are enterprise value, EV per net sales, price to book value, market cap per sales, retention ratio and Earnings yield. This modern and well arranged IT Firm Financial Statement Information Technology Company Valuation Ratios Demonstration PDF provides lots of creative possibilities. It is very simple to customize and edit with the Powerpoint Software. Just drag and drop your pictures into the shapes. All facets of this template can be edited with Powerpoint no extra software is necessary. Add your own material, put your images in the places assigned for them, adjust the colors, and then you can show your slides to the world, with an animated slide included.
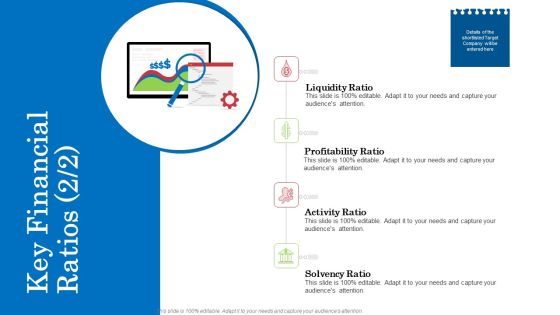
Inorganic Growth Business Key Financial Ratios Solvency Ppt File Demonstration PDF
This is a inorganic growth business key financial ratios solvency ppt file demonstration pdf template with various stages. Focus and dispense information on four stages using this creative set, that comes with editable features. It contains large content boxes to add your information on topics like liquidity ratio, profitability ratio, activity ratio, solvency ratio. You can also showcase facts, figures, and other relevant content using this PPT layout. Grab it now.

Corporate Debt Refinancing And Restructuring Key Financial Ratios FY20 Equity Information PDF
Presenting this set of slides with name corporate debt refinancing and restructuring key financial ratios fy20 equity information pdf. This is a one stage process. The stages in this process are return, equity, payable ratio, asset. This is a completely editable PowerPoint presentation and is available for immediate download. Download now and impress your audience.
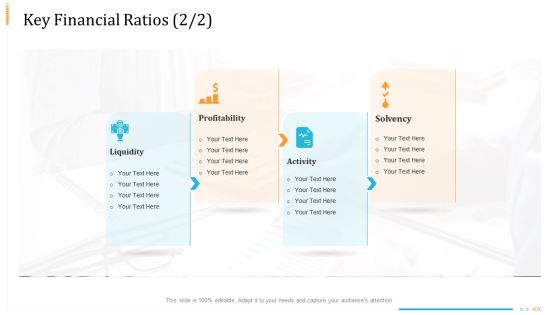
Enterprise Examination And Inspection Key Financial Ratios Profitability Ppt Outline Portrait PDF
Presenting enterprise examination and inspection key financial ratios profitability ppt outline portrait pdf to provide visual cues and insights. Share and navigate important information on four stages that need your due attention. This template can be used to pitch topics like profitability, activity, solvency. In addtion, this PPT design contains high resolution images, graphics, etc, that are easily editable and available for immediate download.

IT Firm Financial Statement Information Technology Company Profitability Ratios Clipart PDF
The following slide highlights the profitability ratio of the Information technology company to assess the organizations capability to earn compared to its revenue. Key ratios included are EBDIT margin, EBIT margin, PBT margin, Net profit margin, and asset turnover percentage. Coming up with a presentation necessitates that the majority of the effort goes into the content and the message you intend to convey. The visuals of a PowerPoint presentation can only be effective if it supplements and supports the story that is being told. Keeping this in mind our experts created IT Firm Financial Statement Information Technology Company Profitability Ratios Clipart PDF to reduce the time that goes into designing the presentation. This way, you can concentrate on the message while our designers take care of providing you with the right template for the situation.

Effective Financial Planning Assessment Techniques Leverage Ratios To Measure The Debt Level Sample PDF
The following slide outlines top 2 leverage ratios which will assist the in determining the debt level incurred by the organization. This slide provides information about debt to equity and interest coverage ratio of the company and its competitors for the period of last 3 years. This modern and well-arranged Effective Financial Planning Assessment Techniques Leverage Ratios To Measure The Debt Level Sample PDF provides lots of creative possibilities. It is very simple to customize and edit with the Powerpoint Software. Just drag and drop your pictures into the shapes. All facets of this template can be edited with Powerpoint no extra software is necessary. Add your own material, put your images in the places assigned for them, adjust the colors, and then you can show your slides to the world, with an animated slide included.
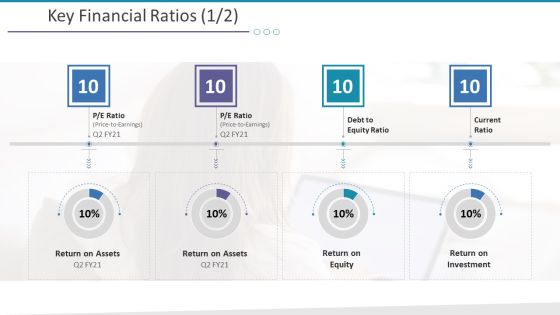
Investigation For Business Procurement Key Financial Ratios Assets Ppt Infographics Deck PDF
Deliver an awe-inspiring pitch with this creative investigation for business procurement key financial ratios assets ppt infographics deck pdf. bundle. Topics like return on assets, return on equity, return on investment can be discussed with this completely editable template. It is available for immediate download depending on the needs and requirements of the user.
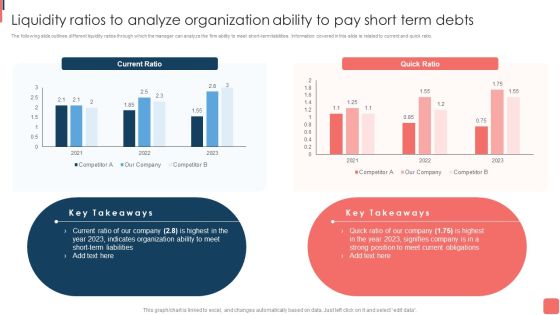
Effective Financial Planning Assessment Techniques Liquidity Ratios To Analyze Organization Ability To Pay Themes PDF
The following slide outlines different liquidity ratios through which the manager can analyze the firm ability to meet short-term liabilities. Information covered in this slide is related to current and quick ratio. This Effective Financial Planning Assessment Techniques Liquidity Ratios To Analyze Organization Ability To Pay Themes PDF is perfect for any presentation, be it in front of clients or colleagues. It is a versatile and stylish solution for organizing your meetings. The Effective Financial Planning Assessment Techniques Liquidity Ratios To Analyze Organization Ability To Pay Themes PDF features a modern design for your presentation meetings. The adjustable and customizable slides provide unlimited possibilities for acing up your presentation. Slidegeeks has done all the homework before launching the product for you. So, do not wait, grab the presentation templates today.

Investigation For Business Procurement Key Financial Ratios Profitability Ppt Show Layouts PDF
Presenting investigation for business procurement key financial ratios profitability ppt show layouts pdf. to provide visual cues and insights. Share and navigate important information on four stages that need your due attention. This template can be used to pitch topics like profitability, solvency, liquidity, activity. In addtion, this PPT design contains high resolution images, graphics, etc, that are easily editable and available for immediate download.

Effective Financial Planning Assessment Techniques Profitability Ratios To Measure The Organization Earnings Inspiration PDF
The following slide outlines different profitability ratios which can be used by the investors to measure the financial position of the company. It covers information about gross profit and net profit margin. Retrieve professionally designed Effective Financial Planning Assessment Techniques Profitability Ratios To Measure The Organization Earnings Inspiration PDF to effectively convey your message and captivate your listeners. Save time by selecting pre-made slideshows that are appropriate for various topics, from business to educational purposes. These themes come in many different styles, from creative to corporate, and all of them are easily adjustable and can be edited quickly. Access them as PowerPoint templates or as Google Slides themes. You do not have to go on a hunt for the perfect presentation because Slidegeeks got you covered from everywhere.

Company Financial Performance Indicators Dashboard With Liquidity And Turnover Ratios Formats PDF
This graph or chart is linked to excel, and changes automatically based on data. Just left click on it and select Edit Data. Pitch your topic with ease and precision using this Company Financial Performance Indicators Dashboard With Liquidity And Turnover Ratios Formats PDF. This layout presents information on Cash Balance, Days Inventory Outstanding, Days Payable Outstanding. It is also available for immediate download and adjustment. So, changes can be made in the color, design, graphics or any other component to create a unique layout.
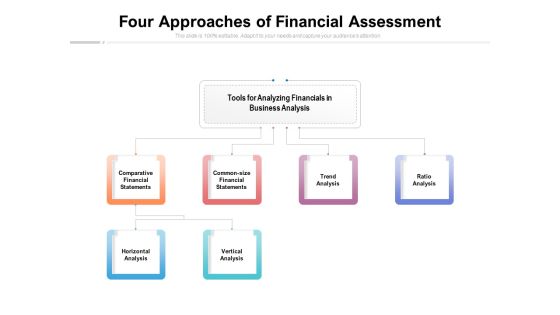
Four Approaches Of Financial Assessment Ppt PowerPoint Presentation Infographics Example
Presenting this set of slides with name four approaches of financial assessment ppt powerpoint presentation infographics example. This is a six stage process. The stages in this process are tools for analyzing financials business analysis, comparative financial statements, common size financial statements, trend analysis, ratio analysis, vertical analysis. This is a completely editable PowerPoint presentation and is available for immediate download. Download now and impress your audience.
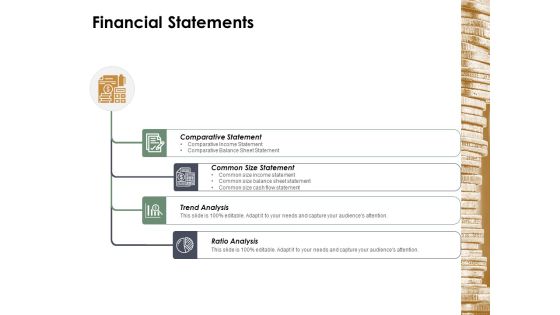
Financial Statements Ppt Powerpoint Presentation Infographic Template Sample
This is a financial statements ppt powerpoint presentation infographic template sample. This is a four stage process. The stages in this process are financial statements, comparative statement, common size statement, trend analysis, ratio analysis.
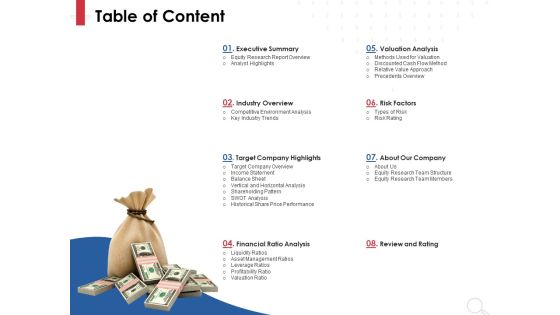
Equity Analysis Project Table Of Content Ppt PowerPoint Presentation Infographic Template Example Introduction PDF
Presenting this set of slides with name equity analysis project table of content ppt powerpoint presentation infographic template example introduction pdf. This is a eight stage process. The stages in this process are executive summary, industry overview, target company highlights, financial ratio analysis, review and rating, about our company, risk factors, valuation analysis. This is a completely editable PowerPoint presentation and is available for immediate download. Download now and impress your audience.

Major Tools For Business Financial Review Pictures PDF
This slide covers techniques to measure companys position for to provide details about it operations, sales and revenue. It includes ratio, benchmarking and common size financial analysis. Presenting Major Tools For Business Financial Review Pictures PDF to dispense important information. This template comprises three stages. It also presents valuable insights into the topics including Ratio Analysis, Benchmarking Analysis, Common Size Financial Analysis. This is a completely customizable PowerPoint theme that can be put to use immediately. So, download it and address the topic impactfully.
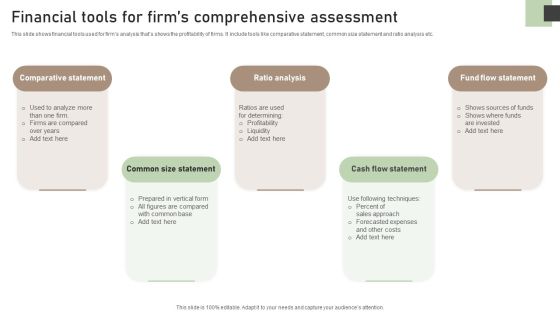
Financial Tools For Firms Comprehensive Assessment Themes PDF
This slide shows financial tools used for firms analysis thats shows the profitability of firms. It include tools like comparative statement, common size statement and ratio analysis etc. Presenting Financial Tools For Firms Comprehensive Assessment Themes PDF to dispense important information. This template comprises five stages. It also presents valuable insights into the topics including Comparative Statement, Common Size Statement, Ratio Analysis. This is a completely customizable PowerPoint theme that can be put to use immediately. So, download it and address the topic impactfully.

Assessing Stocks In Financial Market Liquidity Analysis Of Company For Equity Research Ppt PowerPoint Presentation Pictures Guidelines PDF
Presenting this set of slides with name assessing stocks in financial market liquidity analysis of company for equity research ppt powerpoint presentation pictures guidelines pdf. The topics discussed in these slides are current ratio, quick ratio, interpretation, growth, current asset. This is a completely editable PowerPoint presentation and is available for immediate download. Download now and impress your audience.

Business Finance Options Debt Vs Equity Financial Analysis Of The Companys Capital Structure Ppt Pictures Portfolio PDF
Presenting business finance options debt vs equity financial analysis of the companys capital structure ppt pictures portfolio pdf to provide visual cues and insights. Share and navigate important information on seven stages that need your due attention. This template can be used to pitch topics like cost, equity, market, value, asset ratio. In addtion, this PPT design contains high resolution images, graphics, etc, that are easily editable and available for immediate download.
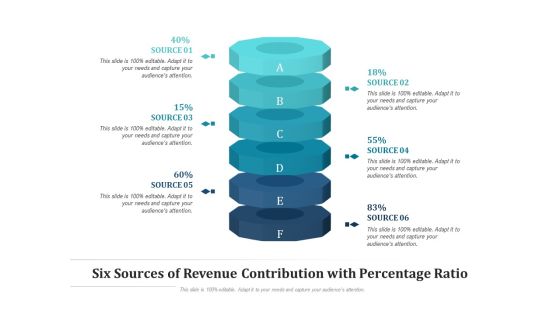
Six Sources Of Revenue Contribution With Percentage Ratio Ppt PowerPoint Presentation File Graphics Tutorials PDF
Persuade your audience using this six sources of revenue contribution with percentage ratio ppt powerpoint presentation file graphics tutorials pdf. This PPT design covers six stages, thus making it a great tool to use. It also caters to a variety of topics including six sources of revenue contribution with percentage ratio. Download this PPT design now to present a convincing pitch that not only emphasizes the topic but also showcases your presentation skills.

Debt Funding Investment Pitch Deck Companys Interest Coverage Ratio Table Portrait PDF
This is a debt funding investment pitch deck companys interest coverage ratio table portrait pdf template with various stages. Focus and dispense information on one stage using this creative set, that comes with editable features. It contains large content boxes to add your information on topics like sales revenue, gross profit, operating profit, earnings before taxes, interest coverage ratio. You can also showcase facts, figures, and other relevant content using this PPT layout. Grab it now.

Debt Funding Investment Pitch Deck Companys Debt To Equity Ratio Ppt Portfolio Graphics PDF
This is a debt funding investment pitch deck companys debt to equity ratio ppt portfolio graphics pdf template with various stages. Focus and dispense information on one stage using this creative set, that comes with editable features. It contains large content boxes to add your information on topics like common equity, additional paid capital, retained earnings, short term debt, interest expense. You can also showcase facts, figures, and other relevant content using this PPT layout. Grab it now.

Commercial Banking Template Collection Liquidity Analysis And Key Ratios Ppt Show Gridlines PDF
The slide comprises liquidity analysis of the company along with details such as networking capital, current ratio, quick ratio, current assets, current liabilities etc. It also covered the liquidity ratios current ratio, quick ratio, cash ratio, operating cash flow ratio for five years 2016 to 2020. Deliver an awe-inspiring pitch with this creative commercial banking template collection liquidity analysis and key ratios ppt show gridlines pdf bundle. Topics like inventory, operating cash flow ratio, net working capital can be discussed with this completely editable template. It is available for immediate download depending on the needs and requirements of the user.
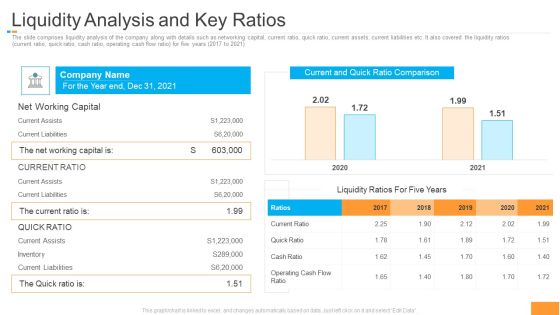
Funding Pitch Book Outline Liquidity Analysis And Key Ratios Mockup PDF
The slide comprises liquidity analysis of the company along with details such as networking capital, current ratio, quick ratio, current assets, current liabilities etc. It also covered the liquidity ratios current ratio, quick ratio, cash ratio, operating cash flow ratio for five years 2017 to 2021. Deliver and pitch your topic in the best possible manner with this inventory, current liabilities, operating cash flow ratio. Use them to share invaluable insights on inventory, current liabilities, operating cash flow ratio and impress your audience. This template can be altered and modified as per your expectations. So, grab it now.

Financial Planning And Examination Plan For Small And Large Enterprises Leverage Ratios To Measure The Debt Level Background PDF
The following slide outlines top 2 leverage ratios which will assist the in determining the debt level incurred by the organization. This slide provides information about debt to equity and interest coverage ratio of the company and its competitors for the period of last 3 years. Get a simple yet stunning designed Financial Planning And Examination Plan For Small And Large Enterprises Leverage Ratios To Measure The Debt Level Background PDF. It is the best one to establish the tone in your meetings. It is an excellent way to make your presentations highly effective. So, download this PPT today from Slidegeeks and see the positive impacts. Our easy to edit Financial Planning And Examination Plan For Small And Large Enterprises Leverage Ratios To Measure The Debt Level Background PDF can be your go to option for all upcoming conferences and meetings. So, what are you waiting for Grab this template today.

Equity Analysis Project Leverage Ratios FY19 For Equity Research Ppt PowerPoint Presentation Ideas Slide Download PDF
Presenting this set of slides with name equity analysis project leverage ratios fy19 for equity research ppt powerpoint presentation ideas slide download pdf. This is a five stage process. The stages in this process are debt to assets ratio, debt to equity ratio, debt to capital ratio, debt to ebitda ratio, asset to equity ratio, interpretation . This is a completely editable PowerPoint presentation and is available for immediate download. Download now and impress your audience.
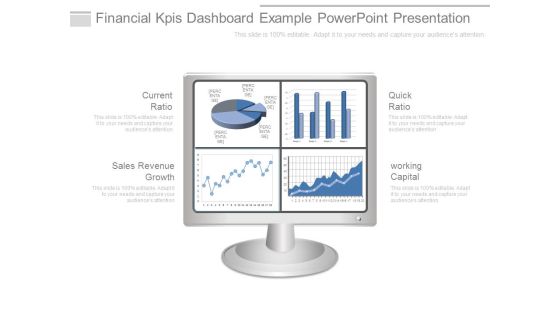
Financial Kpis Dashboard Example Powerpoint Presentation
This is a financial kpis dashboard example powerpoint presentation. This is a four stage process. The stages in this process are current ratio, sales revenue growth, quick ratio, working capital.
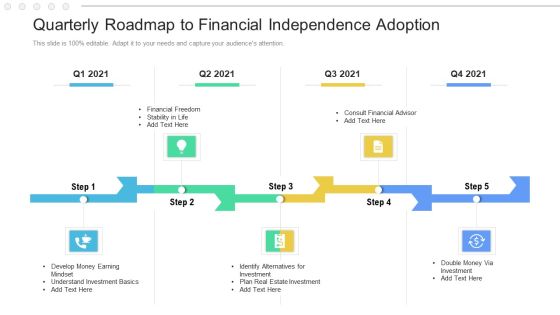
Quarterly Roadmap To Financial Independence Adoption Formats
Introducing our quarterly roadmap to financial independence adoption formats. This PPT presentation is Google Slides compatible, therefore, you can share it easily with the collaborators for measuring the progress. Also, the presentation is available in both standard screen and widescreen aspect ratios. So edit the template design by modifying the font size, font type, color, and shapes as per your requirements. As this PPT design is fully editable it can be presented in PDF, JPG and PNG formats.

Quarterly Roadmap To Financial Independence Planning Sample
Presenting the quarterly roadmap to financial independence planning sample. The template includes a roadmap that can be used to initiate a strategic plan. Not only this, the PowerPoint slideshow is completely editable and you can effortlessly modify the font size, font type, and shapes according to your needs. This PPT slide can be easily reached in standard screen and widescreen aspect ratios. The set is also available in various formats like PDF, PNG, and JPG. So download and use it multiple times as per your knowledge.
PP And E Valuation Methodology Fixed Asset Turnover Ratio Over Past 10 Years Icons PDF
Presenting this set of slides with name pp and e valuation methodology fixed asset turnover ratio over past 10 years icons pdf. The topics discussed in these slides are inefficient, utilization, assets, revenue. This is a completely editable PowerPoint presentation and is available for immediate download. Download now and impress your audience.

Fund Investment Advisory Statement Profitability Ratio FY19 For Equity Research Background PDF
Presenting this set of slides with name fund investment advisory statement profitability ratio fy19 for equity research background pdf. This is a four stage process. The stages in this process are price, value, sales, market capitalization, revenues. This is a completely editable PowerPoint presentation and is available for immediate download. Download now and impress your audience.

Staff Turnover Ratio BSC Turnover Rate Balanced Scorecard With Employee Status And Engagement Background PDF
Deliver an awe inspiring pitch with this creative staff turnover ratio bsc turnover rate balanced scorecard with employee status and engagement background pdf bundle. Topics like satisfaction survey results, employee engagement by department, employee cost over sales revenue can be discussed with this completely editable template. It is available for immediate download depending on the needs and requirements of the user.

Debt To Equity Ratio Of Organization Developing Fundraising Techniques Icons PDF
This slide showcases drawbacks of raising money from crowdfunding which are commission, limited fund availability and unsuccessful raises are public. It can help organization to identify the risks associated with raising funds from equity crowdfunding. The Debt To Equity Ratio Of Organization Developing Fundraising Techniques Icons PDF is a compilation of the most recent design trends as a series of slides. It is suitable for any subject or industry presentation, containing attractive visuals and photo spots for businesses to clearly express their messages. This template contains a variety of slides for the user to input data, such as structures to contrast two elements, bullet points, and slides for written information. Slidegeeks is prepared to create an impression.
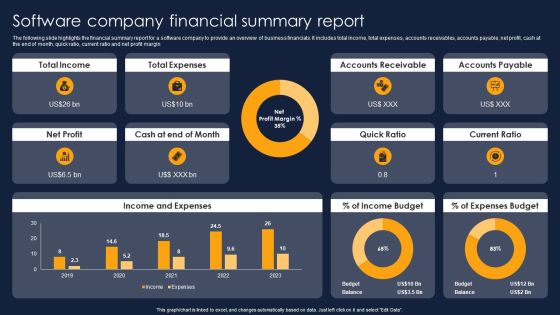
Software Company Financial Summary Report Financial Performance Report Of Software Firm Rules PDF
The following slide highlights the financial summary report for a software company to provide an overview of business financials. It includes total income, total expenses, accounts receivables, accounts payable, net profit, cash at the end of month, quick ratio, current ratio and net profit margin. If your project calls for a presentation, then Slidegeeks is your go-to partner because we have professionally designed, easy-to-edit templates that are perfect for any presentation. After downloading, you can easily edit Software Company Financial Summary Report Financial Performance Report Of Software Firm Rules PDF and make the changes accordingly. You can rearrange slides or fill them with different images. Check out all the handy templates
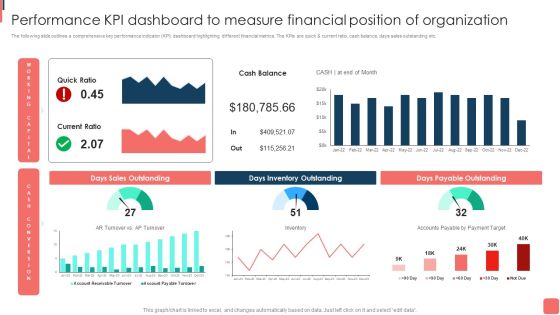
Effective Financial Planning Assessment Techniques Performance Kpi Dashboard To Measure Financial Graphics PDF
The following slide outlines a comprehensive key performance indicator KPI dashboard highlighting different financial metrics. The KPIs are quick and current ratio, cash balance, days sales outstanding etc. The best PPT templates are a great way to save time, energy, and resources. Slidegeeks have 100 precent editable powerpoint slides making them incredibly versatile. With these quality presentation templates, you can create a captivating and memorable presentation by combining visually appealing slides and effectively communicating your message. Download Effective Financial Planning Assessment Techniques Performance Kpi Dashboard To Measure Financial Graphics PDF from Slidegeeks and deliver a wonderful presentation.
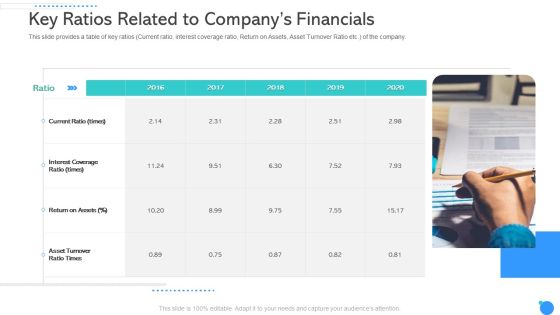
Key Ratios Related To Companys Financials Ppt Show Portfolio PDF
This slide provides a table of key ratios Current ratio, interest coverage ratio, Return on Assets, Asset Turnover Ratio etc. of the company. Presenting key ratios related to companys financials ppt show portfolio pdf to provide visual cues and insights. Share and navigate important information on one stage that need your due attention. This template can be used to pitch topics like current ratio, interest coverage ratio, return on assets. In addtion, this PPT design contains high resolution images, graphics, etc, that are easily editable and available for immediate download.

3 Tools Of Financial Position Evaluation Ppt Gallery Design Ideas PDF
This slide shows the tools and techniques of financial statement analysis. These tools are ratio, trend and cash flow analysis. Presenting 3 Tools Of Financial Position Evaluation Ppt Gallery Design Ideas PDF to dispense important information. This template comprises three stages. It also presents valuable insights into the topics including Ratio Analysis, Trend Analysis, Cash Flow Analysis. This is a completely customizable PowerPoint theme that can be put to use immediately. So, download it and address the topic impactfully.

Solvency Ratios Ppt PowerPoint Presentation Inspiration Guidelines
This is a solvency ratios ppt powerpoint presentation inspiration guidelines. This is a two stage process. The stages in this process are debt equity ratio, total liabilities total equity, time interest earned ratio, ebit interest expense.
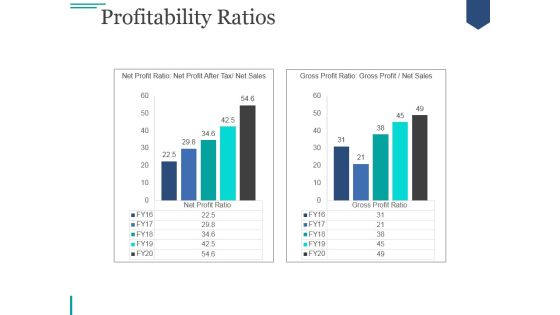
Profitability Ratios Ppt PowerPoint Presentation Infographic Template
This is a profitability ratios ppt powerpoint presentation infographic template. This is a two stage process. The stages in this process are graph, business, marketing, strategy, growth.

Activity Ratios Ppt PowerPoint Presentation Icon Themes
This is a activity ratios ppt powerpoint presentation icon themes. This is a two stage process. The stages in this process are inventory turnover, cogs, average inventory, receivable turnover, net credit sales, average accounts receivable .

Profitability Ratios Template Ppt PowerPoint Presentation Topics
This is a profitability ratios template ppt powerpoint presentation topics. This is a two stage process. The stages in this process are marketing, strategy, growth, graph, business.
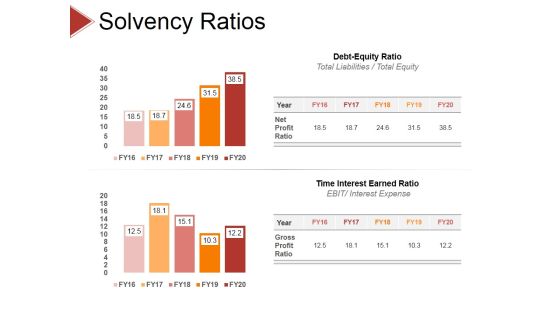
Solvency Ratios Ppt PowerPoint Presentation Model Show
This is a solvency ratios ppt powerpoint presentation model show. This is a two stage process. The stages in this process are debt equity ratio, time interest earned ratio.
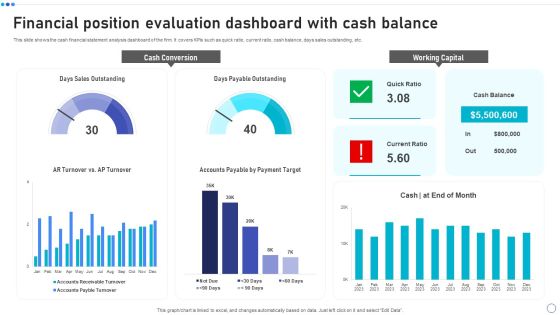
Financial Position Evaluation Dashboard With Cash Balance Rules PDF
This slide shows the cash financial statement analysis dashboard of the firm. It covers KPIs such as quick ratio, current ratio, cash balance, days sales outstanding, etc. Showcasing this set of slides titled Financial Position Evaluation Dashboard With Cash Balance Rules PDF. The topics addressed in these templates are Cash Conversion, Working Capital, Days Sales Outstanding. All the content presented in this PPT design is completely editable. Download it and make adjustments in color, background, font etc. as per your unique business setting.

Traditional Financial Budgeting And Assessment Kpis For Businesses Infographics PDF
This slide represents the key performance indicators set by the financial planning and analysis team for their business. The indicators includes working capital, operating cash flow, return on equity, current ratio, accounts receivable and payable turnover. Presenting Traditional Financial Budgeting And Assessment Kpis For Businesses Infographics PDF to dispense important information. This template comprises six stages. It also presents valuable insights into the topics including Working Capital, Operating Cash Flow, Current Ratio. This is a completely customizable PowerPoint theme that can be put to use immediately. So, download it and address the topic impactfully.
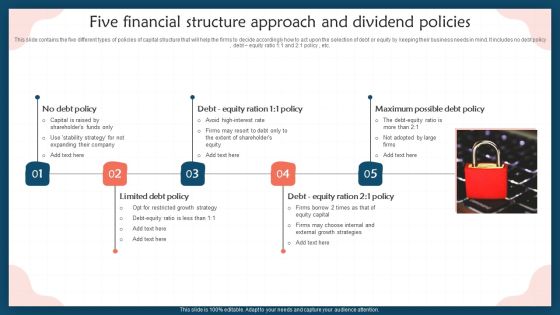
Five Financial Structure Approach And Dividend Policies Professional PDF
This slide contains the five different types of policies of capital structure that will help the firms to decide accordingly how to act upon the selection of debt or equity by keeping their business needs in mind. It includes no debt policy , debt equity ratio 1 1 and 2 1 policy , etc. Presenting Five Financial Structure Approach And Dividend Policies Professional PDF to dispense important information. This template comprises five stages. It also presents valuable insights into the topics including Capital, Stability Strategy, High Interest Rate. This is a completely customizable PowerPoint theme that can be put to use immediately. So, download it and address the topic impactfully.

Financial Position Evaluation Dashboard With Operating Profit Margin Elements PDF
This slide shows the financial statement analysis dashboard of organization. It covers various KPIs such as OPEX Ratio, operating profit margin, gross profit margin, net profit margin, etc. Pitch your topic with ease and precision using this Financial Position Evaluation Dashboard With Operating Profit Margin Elements PDF. This layout presents information on Income Statement, Revenue, Operating Profit, Net Profit. It is also available for immediate download and adjustment. So, changes can be made in the color, design, graphics or any other component to create a unique layout.

Financial KPI Framework Ppt PowerPoint Presentation Gallery Show PDF
This slide outlines financial key performance indicator framework such as operating cash flow ratio, current ratio, return on equity, working capital and debt to equity ratio. It also provides information about industry standard and actual performance of the company. Showcasing this set of slides titled financial kpi framework ppt powerpoint presentation gallery show pdf. The topics addressed in these templates are current ratio, working capital, equity. All the content presented in this PPT design is completely editable. Download it and make adjustments in color, background, font etc. as per your unique business setting.
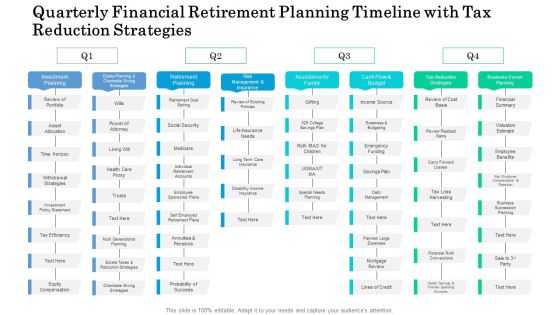
Quarterly Financial Retirement Planning Timeline With Tax Reduction Strategies Microsoft
Presenting our innovatively structured quarterly financial retirement planning timeline with tax reduction strategies microsoft Template. Showcase your roadmap process in different formats like PDF, PNG, and JPG by clicking the download button below. This PPT design is available in both Standard Screen and Widescreen aspect ratios. It can also be easily personalized and presented with modified font size, font type, color, and shapes to measure your progress in a clear way.

Financial Investment To Manage Money Four Quarter Roadmap Formats
Presenting our innovatively-structured financial investment to manage money four quarter roadmap formats Template. Showcase your roadmap process in different formats like PDF, PNG, and JPG by clicking the download button below. This PPT design is available in both Standard Screen and Widescreen aspect ratios. It can also be easily personalized and presented with modified font size, font type, color, and shapes to measure your progress in a clear way.
Quarterly Roadmap Strategic Plan With Financial Projection Icons
Introducing our quarterly roadmap strategic plan with financial projection icons. This PPT presentation is Google Slides compatible, therefore, you can share it easily with the collaborators for measuring the progress. Also, the presentation is available in both standard screen and widescreen aspect ratios. So edit the template design by modifying the font size, font type, color, and shapes as per your requirements. As this PPT design is fully editable it can be presented in PDF, JPG and PNG formats.
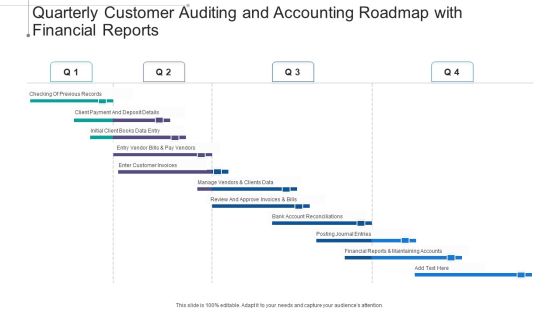
Quarterly Customer Auditing And Accounting Roadmap With Financial Reports Portrait
Presenting our innovatively structured quarterly customer auditing and accounting roadmap with financial reports portrait Template. Showcase your roadmap process in different formats like PDF, PNG, and JPG by clicking the download button below. This PPT design is available in both Standard Screen and Widescreen aspect ratios. It can also be easily personalized and presented with modified font size, font type, color, and shapes to measure your progress in a clear way.

Quarterly Roadmap To Financial Independence With Multiple Phases Structure
Presenting our jaw dropping quarterly roadmap to financial independence with multiple phases structure. You can alternate the color, font size, font type, and shapes of this PPT layout according to your strategic process. This PPT presentation is compatible with Google Slides and is available in both standard screen and widescreen aspect ratios. You can also download this well researched PowerPoint template design in different formats like PDF, JPG, and PNG. So utilize this visually appealing design by clicking the download button given below.

Quarterly Conversion Roadmap For International Financial Reporting Standards Rules
Introducing our quarterly conversion roadmap for international financial reporting standards rules. This PPT presentation is Google Slides compatible, therefore, you can share it easily with the collaborators for measuring the progress. Also, the presentation is available in both standard screen and widescreen aspect ratios. So edit the template design by modifying the font size, font type, color, and shapes as per your requirements. As this PPT design is fully editable it can be presented in PDF, JPG and PNG formats.

Quarterly Roadmap To Attain Financial Independence Landmark Structure
Presenting our innovatively structured quarterly roadmap to attain financial independence landmark structure Template. Showcase your roadmap process in different formats like PDF, PNG, and JPG by clicking the download button below. This PPT design is available in both Standard Screen and Widescreen aspect ratios. It can also be easily personalized and presented with modified font size, font type, color, and shapes to measure your progress in a clear way.

Various Categories Of Investment For Financial Planning Demonstration PDF
The slide covers the investment types to effectively manage the finances of the business. Various types of investments included are savings account, gold investment, equity stocks, fixed deposit investments, etc. Pitch your topic with ease and precision using this Various Categories Of Investment For Financial Planning Demonstration PDF. This layout presents information on Investment Period, Risk Reward, Liquidity Ratio. It is also available for immediate download and adjustment. So, changes can be made in the color, design, graphics or any other component to create a unique layout.

Linear Circles Percentage Analysis Charts Powerpoint Slides
This PowerPoint template has been designed with graphics of three circles and percentage ratios. You may use this dashboard slide design for topics like profit growth and financial planning. This PPT slide is powerful tool to describe your ideas.

Stock Market Research Report Liquidity Analysis Of Company For Equity Research Designs PDF
The following slide displays the analysis of the companies liquidity ratio of the financial year 18 and 19 as its analysis the current ratio, quick ratio and the net working capital of the organization. Deliver an awe-inspiring pitch with this creative stock market research report liquidity analysis of company for equity research designs pdf bundle. Topics like current ratio, quick ratio, 2017 to 2020 can be discussed with this completely editable template. It is available for immediate download depending on the needs and requirements of the user.

Action Plan To Implement Exit Strategy For Investors Liquidity Analysis Of Company Portrait PDF
The following slide displays the analysis of the companies liquidity ratio of the financial year 18 and 19 as its analysis the current ratio , quick ratio and the net working capital of the organization. Deliver an awe inspiring pitch with this creative Action Plan To Implement Exit Strategy For Investors Liquidity Analysis Of Company Portrait PDF bundle. Topics like Organization, Growth, Quick Ratios can be discussed with this completely editable template. It is available for immediate download depending on the needs and requirements of the user.

Semicircle With Five Circles Of Percentage Values Powerpoint Template
This PowerPoint template has been designed with graphics of semicircle with five percentage values. This business design can be used for financial ratio analysis. Capture the attention of your audience with this slide.

Pie Chart Infographic Diagram Powerpoint Templates
This Power Point template has been designed with pie chart infographic. This business slide is useful to present financial ratio analysis. Use this diagram to make business presentation. Illustrate these thoughts with this slide.
Pie Chart With Seven Business Icons Powerpoint Templates
Our compelling template consists with a design of pie chart with seven business icons. This slide has been professionally designed to exhibit financial ratio analysis. This template offers an excellent background to build impressive presentation.

Internal And External Business Environment Analysis Need To Conduct Environmental Impact Analysis Brochure PDF
This slide shows reasons for business to conduct environmental impact analysis such as incremental growth. It also includes steps required to improve financial ratios Deliver an awe inspiring pitch with this creative internal and external business environment analysis need to conduct environmental impact analysis brochure pdf bundle. Topics like product a sales declining, incremental growth, several players occupying market can be discussed with this completely editable template. It is available for immediate download depending on the needs and requirements of the user.

Liquidity Ratios Template 1 Ppt PowerPoint Presentation Outline Themes
This is a liquidity ratios template 1 ppt powerpoint presentation outline themes. This is a two stage process. The stages in this process are current ratio, quick ratio.

Profitability Ratios Template Ppt PowerPoint Presentation Styles Slide
This is a profitability ratios template ppt powerpoint presentation styles slide. This is a two stage process. The stages in this process are net profit ratio, net profit after tax net sales, gross profit ratio, gross profit net sales.

Liquidity Ratios Template 2 Ppt PowerPoint Presentation File Topics
This is a liquidity ratios template 2 ppt powerpoint presentation file topics. This is a two stage process. The stages in this process are current ratio, quick ratio, current assets current liabilities, current assets current liabilities.
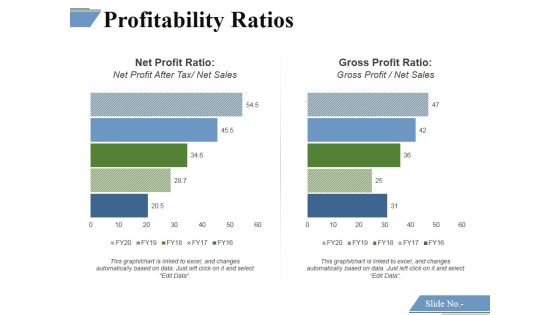
Profitability Ratios Template 1 Ppt PowerPoint Presentation Outline Deck
This is a profitability ratios template 1 ppt powerpoint presentation outline deck. This is a two stage process. The stages in this process are net profit ratio, gross profit ratio.
Profitability Ratios Template 2 Ppt PowerPoint Presentation Icon Diagrams
This is a profitability ratios template 2 ppt powerpoint presentation icon diagrams. This is a two stage process. The stages in this process are net profit ratio, gross profit ratio.

Liquidity Ratios Ppt PowerPoint Presentation Slides Show
This is a liquidity ratios ppt powerpoint presentation slides show. This is a two stage process. The stages in this process are finance, analysis, marketing, business, compere.
Liquidity Ratios Ppt PowerPoint Presentation Model Icon
This is a liquidity ratios ppt powerpoint presentation model icon. This is a two stage process. The stages in this process are finance, analysis, compere, business, marketing.

Activity Ratios Ppt PowerPoint Presentation Summary Tips
This is a activity ratios ppt powerpoint presentation summary tips. This is a two stage process. The stages in this process are finance, chart graph, marketing, planning, analysis.

Liquidity Ratios Ppt PowerPoint Presentation Inspiration Skills
This is a liquidity ratios ppt powerpoint presentation inspiration skills. This is a two stage process. The stages in this process are finance, chart graph, marketing, planning, analysis.

Activity Ratios Ppt PowerPoint Presentation Slides Layout
This is a activity ratios ppt powerpoint presentation slides layout. This is a two stage process. The stages in this process are business, finance, analysis, strategy, marketing.
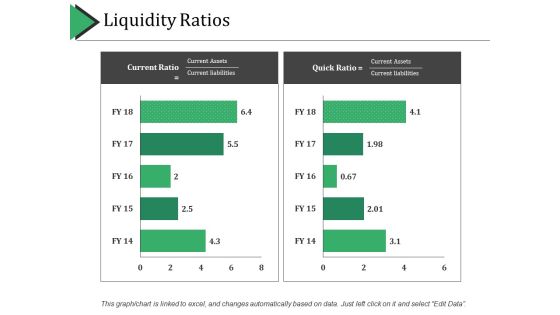
Liquidity Ratios Ppt PowerPoint Presentation Professional Ideas
This is a liquidity ratios ppt powerpoint presentation professional ideas. This is a two stage process. The stages in this process are business, finance, marketing, strategy, analysis.
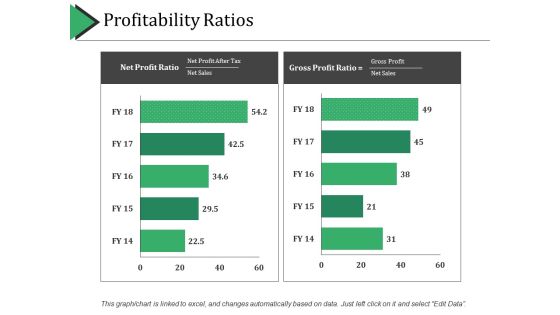
Profitability Ratios Ppt PowerPoint Presentation Layouts Gridlines
This is a profitability ratios ppt powerpoint presentation layouts gridlines. This is a two stage process. The stages in this process are business, finance, marketing, strategy, analysis.

Activity Ratios Template 1 Ppt PowerPoint Presentation Clipart
This is a activity ratios template 1 ppt powerpoint presentation clipart. This is a two stage process. The stages in this process are business, marketing, finance, growth, analysis.

Profitability Ratios Template 3 Ppt PowerPoint Presentation Summary Files
This is a profitability ratios template 3 ppt powerpoint presentation summary files. This is a two stage process. The stages in this process are price to earning ratio, earning per share.

Profitability Ratios Template 4 Ppt PowerPoint Presentation Ideas Graphic Images
This is a profitability ratios template 4 ppt powerpoint presentation ideas graphic images. This is a two stage process. The stages in this process are price to earning ratio, earning per share.

Activity Ratios Template 2 Ppt PowerPoint Presentation Design Templates
This is a activity ratios template 2 ppt powerpoint presentation design templates. This is a two stage process. The stages in this process are business, marketing, finance, growth, analysis.
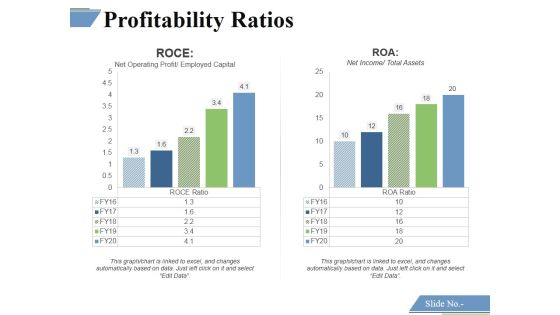
Profitability Ratios Template 6 Ppt PowerPoint Presentation Portfolio Graphics
This is a profitability ratios template 6 ppt powerpoint presentation portfolio graphics. This is a two stage process. The stages in this process are roce, roa.

Activity Ratios Template 1 Ppt PowerPoint Presentation Outline Design Templates
This is a activity ratios template 1 ppt powerpoint presentation outline design templates. This is a two stage process. The stages in this process are inventory turnover, receivable turnover, graph, success, growth.

Activity Ratios Template 3 Ppt PowerPoint Presentation Professional Example
This is a activity ratios template 3 ppt powerpoint presentation professional example. This is a two stage process. The stages in this process are total asset turnover, net sales, fixed assets turnover, fixed assets.

Activity Ratios Template Ppt PowerPoint Presentation Summary Slides
This is a activity ratios template ppt powerpoint presentation summary slides. This is a two stage process. The stages in this process are total asset turnover, net sales, fixed assets turnover, fixed assets.
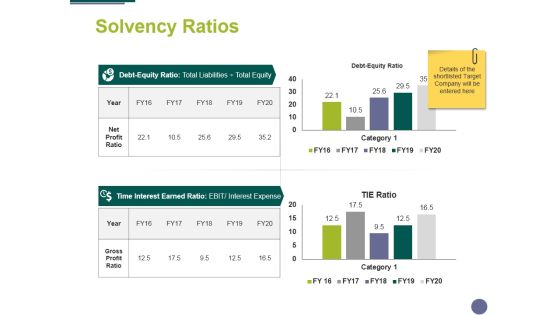
Solvency Ratios Ppt PowerPoint Presentation Infographics Portrait
This is a solvency ratios ppt powerpoint presentation infographics portrait. This is a two stage process. The stages in this process are compere, finance, marketing, analysis, business.
Liquidity Ratios Ppt PowerPoint Presentation Icon Slides
This is a liquidity ratios ppt powerpoint presentation icon slides. This is a two stage process. The stages in this process are business, finance, marketing, analysis, investment.
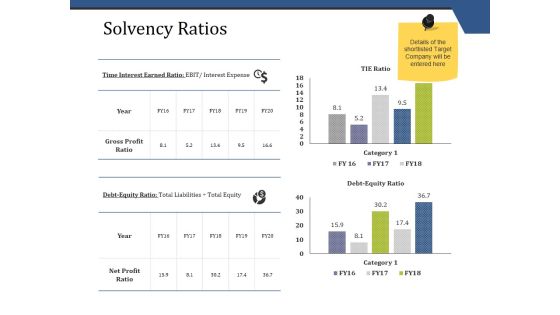
Solvency Ratios Ppt PowerPoint Presentation Summary Samples
This is a solvency ratios ppt powerpoint presentation summary samples. This is a two stage process. The stages in this process are business, compare, finance, marketing, strategy, analysis.

Solvency Ratios Ppt PowerPoint Presentation Summary Shapes
This is a solvency ratios ppt powerpoint presentation summary shapes. This is a two stage process. The stages in this process are compere, analysis, finance, business, marketing.
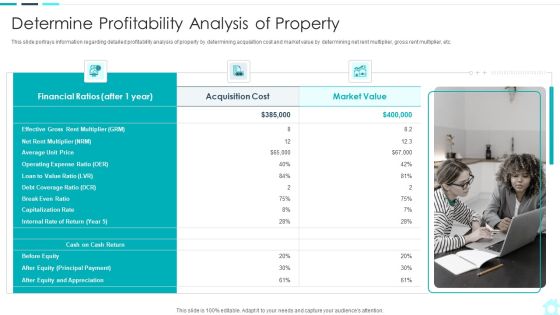
Real Estate Assets Financing Analysis Determine Profitability Analysis Of Property Summary PDF
This slide portrays information regarding detailed profitability analysis of property by determining acquisition cost and market value by determining net rent multiplier, gross rent multiplier, etc. This is a real estate assets financing analysis determine profitability analysis of property summary pdf template with various stages. Focus and dispense information on three stages using this creative set, that comes with editable features. It contains large content boxes to add your information on topics like market value, acquisition cost, financial ratios. You can also showcase facts, figures, and other relevant content using this PPT layout. Grab it now.
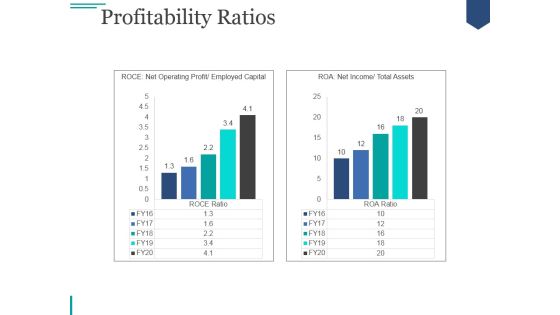
Profitability Ratios Template 2 Ppt PowerPoint Presentation Professional
This is a profitability ratios template 2 ppt powerpoint presentation professional. This is a two stage process. The stages in this process are graph, business, marketing, strategy, growth.
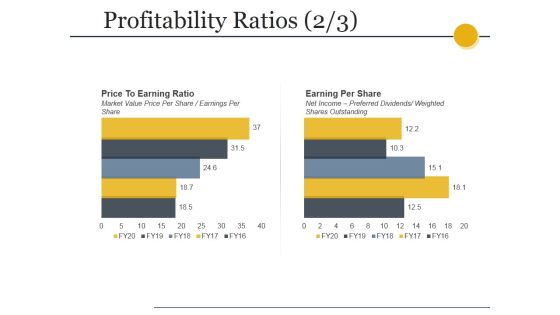
Profitability Ratios Template 2 Ppt PowerPoint Presentation Gallery Designs
This is a profitability ratios template 2 ppt powerpoint presentation gallery designs. This is a two stage process. The stages in this process are price to earning ratio, market value price per share earnings per share, earning per share, net income preferred dividends, weighted shares outstanding.

Profitability Ratios Template 4 Ppt PowerPoint Presentation Professional Deck
This is a profitability ratios template 4 ppt powerpoint presentation professional deck. This is a two stage process. The stages in this process are price to earning ratio, market value price per share earnings per share, earning per share, net income preferred dividends, weighted shares outstanding.

Profitability Ratios Template 3 Ppt PowerPoint Presentation Show Graphics Download
This is a profitability ratios template 3 ppt powerpoint presentation show graphics download. This is a two stage process. The stages in this process are roce, net operating profit, employed capital, roa, net income, total assets.
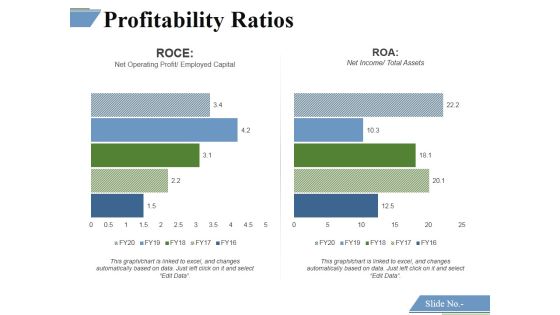
Profitability Ratios Template 5 Ppt PowerPoint Presentation Layouts Graphics Design
This is a profitability ratios template 5 ppt powerpoint presentation layouts graphics design. This is a two stage process. The stages in this process are finance, business, marketing, success, strategy.

Profitability Ratios Template 1 Ppt PowerPoint Presentation Outline Information
This is a profitability ratios template 1 ppt powerpoint presentation outline information. This is a two stage process. The stages in this process are net profit ratio, gross profit ratio, net profit after tax, net sales.
Profitability Ratios Template 1 Ppt PowerPoint Presentation Icon Example File
This is a profitability ratios template 1 ppt powerpoint presentation icon example file. This is a two stage process. The stages in this process are gross profit ratio, net profit ratio.

Profitability Ratios Template 2 Ppt PowerPoint Presentation Infographics Layouts
This is a profitability ratios template 2 ppt powerpoint presentation infographics layouts. This is a two stage process. The stages in this process are price to earning ratio, earning per share, market value price per share.
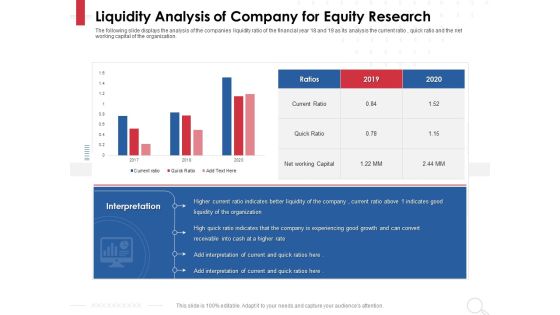
Equity Analysis Project Liquidity Analysis Of Company For Equity Research Ppt PowerPoint Presentation Styles Slideshow PDF
Presenting this set of slides with name equity analysis project liquidity analysis of company for equity research ppt powerpoint presentation styles slideshow pdf. The topics discussed in these slides are current ratio, quick ratio, net working capital. This is a completely editable PowerPoint presentation and is available for immediate download. Download now and impress your audience.
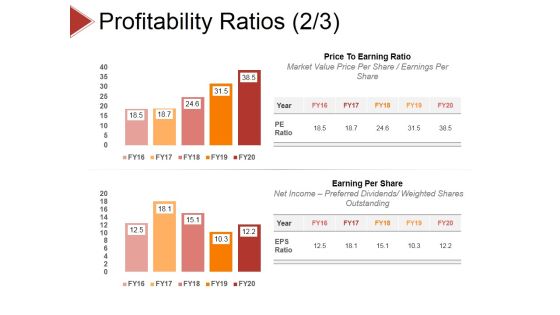
Profitability Ratios Template 3 Ppt PowerPoint Presentation Styles Slide Download
This is a profitability ratios template 3 ppt powerpoint presentation styles slide download. This is a two stage process. The stages in this process are roce, roa, net operating profit, net income.
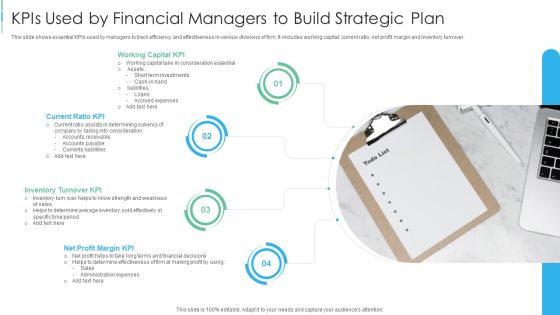
Kpis Used By Financial Managers To Build Strategic Plan Diagrams PDF
This slide shows essential KPIs used by managers to track efficiency and effectiveness in various divisions of firm. It includes working capital, current ratio, net profit margin and inventory turnover.Presenting Kpis Used By Financial Managers To Build Strategic Plan Diagrams PDF to dispense important information. This template comprises four stages. It also presents valuable insights into the topics including Working Capital KPI, Current Ratio KPI, Inventory Turnover KPI. This is a completely customizable PowerPoint theme that can be put to use immediately. So, download it and address the topic impactfully.

Mergers Acquisition Playbook Mergers Acquisition Playbook Financial Due Diligence Topics PDF
Following slide illustrates due diligence checklist to measure financial health of the target company. It includes due diligence criteria, status and key findings.Deliver and pitch your topic in the best possible manner with this Mergers Acquisition Playbook Mergers Acquisition Playbook Financial Due Diligence Topics PDF Use them to share invaluable insights on Reviewed Financial Ratios, Information Provided, Values Of Financial and impress your audience. This template can be altered and modified as per your expectations. So, grab it now.

Adjusting Financial Strategies And Planning Company Overview With Mission And Vision Statement Background PDF
This slide provides glimpse about summary of shareholders dividend policy of the company. It includes payout ratio, ways of dividend payment, cash dividend, bonus share at no additional cost, etc. Make sure to capture your audiences attention in your business displays with our gratis customizable Adjusting Financial Strategies And Planning Company Overview With Mission And Vision Statement Background PDF. These are great for business strategies, office conferences, capital raising or task suggestions. If you desire to acquire more customers for your tech business and ensure they stay satisfied, create your own sales presentation with these plain slides.
Stock Market Research Report Asset Management Turnover Ratios FY 19 For Equity Research Icons PDF
The following slide displays the analysis of the companys asset management or turnover ratio of the financial year 19 as it analysis the account payable ratio, asset turnover ratio , fixed asset turnover ratio and inventory turnover ratio. This is a stock market research report asset management turnover ratios fy 19 for equity research icons pdf template with various stages. Focus and dispense information on five stages using this creative set, that comes with editable features. It contains large content boxes to add your information on topics like account payable turnover ratio, asset turnover ratio, fixed asset turnover ratio, inventory turnover ratio, receivable turnover ratio. You can also showcase facts, figures, and other relevant content using this PPT layout. Grab it now.

Adjusting Financial Strategies And Planning Examining Business Ability To Pay Short Term Liabilities Guidelines PDF
This slide provides glimpse about current ratio analysis for calculating our firms capacity to clear our short term debt on time. It includes quarterly current ratio graph, quarterly quick ratio graph, etc. Welcome to our selection of the Adjusting Financial Strategies And Planning Examining Business Ability To Pay Short Term Liabilities Guidelines PDF. These are designed to help you showcase your creativity and bring your sphere to life. Planning and Innovation are essential for any business that is just starting out. This collection contains the designs that you need for your everyday presentations. All of our PowerPoints are 100 percent editable, so you can customize them to suit your needs. This multi purpose template can be used in various situations. Grab these presentation templates today.

Stock Market Research Report Leverage Ratios FY19 For Equity Research Ppt Infographics Elements PDF
The following slide displays the analysis of the companys leverage ratio o of the financial year 19 as it analysis the debt to asset ratio, debt to equity ratio, debt to capital ratio and debt to EBITDA ratio. Presenting stock market research report leverage ratios fy19 for equity research ppt infographics elements pdf to provide visual cues and insights. Share and navigate important information on five stages that need your due attention. This template can be used to pitch topics like debt to assets ratio, debt to equity ratio, debt to capital ratio, debt to ebitda ratio, asset to equity ratio. In addition, this PPT design contains high-resolution images, graphics, etc, that are easily editable and available for immediate download.
Financial Reporting Icon Computer Screen With Graph And Dollar Ppt Powerpoint Presentation Layouts Model
This is a financial reporting icon computer screen with graph and dollar ppt powerpoint presentation layouts model. This is a four stage process. The stages in this process are financial statements icon, accounting ratio icon, balance sheet icon.

Financial Forecast And Essential Metrics Dashboard Showing Cash Management Designs PDF
This slide contains the projections of the company financials to predict the future position so that better decisions could be taken for the growth prospective. It also includes ratios, cash balance, inventory analysis , etc. Showcasing this set of slides titled Financial Forecast And Essential Metrics Dashboard Showing Cash Management Designs PDF. The topics addressed in these templates are Days Sales Outstanding, Cash Management Dashboard, Days Inventory Outstanding. All the content presented in this PPT design is completely editable. Download it and make adjustments in color, background, font etc. as per your unique business setting.
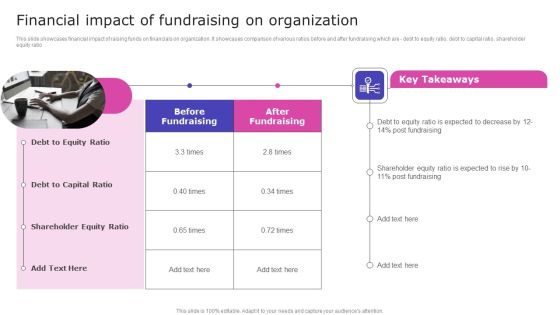
Strategic Fund Acquisition Plan For Business Opertions Expansion Financial Impact Of Fundraising On Organization Pictures PDF
This slide showcases financial impact of raising funds on financials on organization. It showcases comparison of various ratios before and after fundraising which are debt to equity ratio, debt to capital ratio, shareholder equity ratio. Formulating a presentation can take up a lot of effort and time, so the content and message should always be the primary focus. The visuals of the PowerPoint can enhance the presenters message, so our Strategic Fund Acquisition Plan For Business Opertions Expansion Financial Impact Of Fundraising On Organization Pictures PDF was created to help save time. Instead of worrying about the design, the presenter can concentrate on the message while our designers work on creating the ideal templates for whatever situation is needed. Slidegeeks has experts for everything from amazing designs to valuable content, we have put everything into Strategic Fund Acquisition Plan For Business Opertions Expansion Financial Impact Of Fundraising On Organization Pictures PDF.

Financial Impact Of Fundraising On Organization Developing Fundraising Techniques Clipart PDF
This slide showcases financial impact of raising funds on organization. It showcases comparison of various ratios before and after fundraising which are - debt to equity ratio, debt to capital ratio, shareholder equity ratio.Get a simple yet stunning designed Financial Impact Of Fundraising On Organization Developing Fundraising Techniques Clipart PDF. It is the best one to establish the tone in your meetings. It is an excellent way to make your presentations highly effective. So, download this PPT today from Slidegeeks and see the positive impacts. Our easy-to-edit Financial Impact Of Fundraising On Organization Developing Fundraising Techniques Clipart PDF can be your go-to option for all upcoming conferences and meetings. So, what are you waiting for Grab this template today.

Competitive Analysis Of Geo Energy Company For 2021 Icons PDF
This slide shows the competitive analysis of GEO Energy Company with other similar line competitors on the bases of certain parameters such as Revenue , Return on Investment, Performance Ratio , Wind Energy Level , Plant Availability, Market Share etc. Deliver an awe inspiring pitch with this creative competitive analysis of geo energy company for 2021 icons pdf bundle. Topics like revenue, return on investment, performance ratio, plant availability, employees can be discussed with this completely editable template. It is available for immediate download depending on the needs and requirements of the user.

Competitive Analysis Of GEO Energy Company For 2021 Themes PDF
This slide shows the competitive analysis of GEO Energy Company with other similar line competitors on the bases of certain parameters such as Revenue , Return on Investment, Performance Ratio , Wind Energy Level , Plant Availability, Market Share etc. Deliver an awe inspiring pitch with this creative competitive analysis of geo energy company for 2021 themes pdf bundle. Topics like renewable energy companies, performance ratio, competitive factors or metrices can be discussed with this completely editable template. It is available for immediate download depending on the needs and requirements of the user.

Competitive Analysis Of Geo Energy Company For 2021 Diagrams PDF
This slide shows the competitive analysis of GEO Energy Company with other similar line competitors on the bases of certain parameters such as Revenue , Return on Investment, Performance Ratio , Wind Energy Level , Plant Availability, Market Share etc.Deliver and pitch your topic in the best possible manner with this competitive analysis of geo energy company for 2021 diagrams pdf. Use them to share invaluable insights on renewable energy companies, return on investment, performance ratio and impress your audience. This template can be altered and modified as per your expectations. So, grab it now.

Bar Graph With Yearly Statistical Analysis Powerpoint Slides
This PowerPoint template contains diagram of bar graph with yearly percentage ratios. You may download this slide to display statistical analysis. You can easily customize this template to make it more unique as per your need.
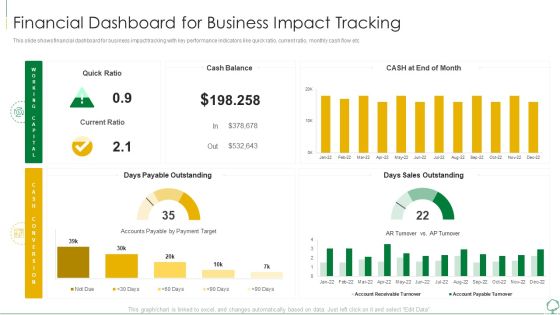
Environmental Examination Tools And Approaches Financial Dashboard For Business Professional PDF
This slide shows financial dashboard for business impact tracking with key performance indicators like quick ratio, current ratio, monthly cash flow etc. Deliver an awe inspiring pitch with this creative environmental examination tools and approaches financial dashboard for business professional pdf bundle. Topics like financial dashboard for business impact tracking can be discussed with this completely editable template. It is available for immediate download depending on the needs and requirements of the user.

Environmental Examination Tools And Approaches Financial Dashboard To Analyze Sample PDF
This slide shows finical dashboard to demonstrate current business scenario with KPIs such as quarterly profits, quick, current and debt to equity ratio. Deliver and pitch your topic in the best possible manner with this environmental examination tools and approaches financial dashboard to analyze sample pdf. Use them to share invaluable insights on performance, product, equity and impress your audience. This template can be altered and modified as per your expectations. So, grab it now.
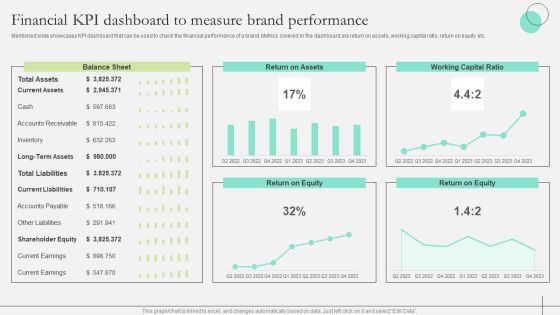
Comprehensive Guide To Strengthen Brand Equity Financial KPI Dashboard Measure Brand Structure PDF
Mentioned slide showcases KPI dashboard that can be used to check the financial performance of a brand. Metrics covered in the dashboard are return on assets, working capital ratio, return on equity etc. Take your projects to the next level with our ultimate collection of Comprehensive Guide To Strengthen Brand Equity Financial KPI Dashboard Measure Brand Structure PDF. Slidegeeks has designed a range of layouts that are perfect for representing task or activity duration, keeping track of all your deadlines at a glance. Tailor these designs to your exact needs and give them a truly corporate look with your own brand colors they will make your projects stand out from the rest
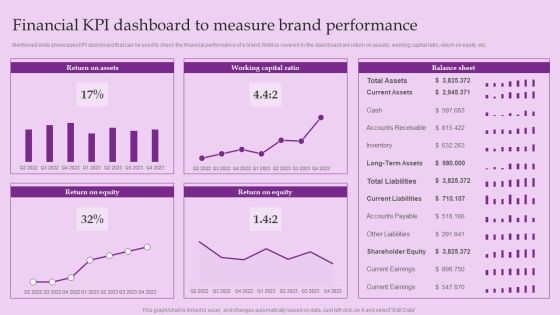
Financial KPI Dashboard To Measure Brand Performance Brand And Equity Evaluation Techniques Elements PDF
Mentioned slide showcases KPI dashboard that can be used to check the financial performance of a brand. Metrics covered in the dashboard are return on assets, working capital ratio, return on equity etc.Coming up with a presentation necessitates that the majority of the effort goes into the content and the message you intend to convey. The visuals of a PowerPoint presentation can only be effective if it supplements and supports the story that is being told. Keeping this in mind our experts created Financial KPI Dashboard To Measure Brand Performance Brand And Equity Evaluation Techniques Elements PDF to reduce the time that goes into designing the presentation. This way, you can concentrate on the message while our designers take care of providing you with the right template for the situation.

Performance KPI Dashboard To Measure Financial Position Of Organization Pictures PDF
The following slide outlines a comprehensive key performance indicator KPI dashboard highlighting different financial metrics. The KPIs are quick and current ratio, cash balance, days sales outstanding etc. Slidegeeks is here to make your presentations a breeze with Performance KPI Dashboard To Measure Financial Position Of Organization Pictures PDF With our easy to use and customizable templates, you can focus on delivering your ideas rather than worrying about formatting. With a variety of designs to choose from, you are sure to find one that suits your needs. And with animations and unique photos, illustrations, and fonts, you can make your presentation pop. So whether you are giving a sales pitch or presenting to the board, make sure to check out Slidegeeks first.

Financial Kpi Dashboard To Measure Brand Performance Brand Value Estimation Guide Inspiration PDF
Mentioned slide showcases KPI dashboard that can be used to check the financial performance of a brand. Metrics covered in the dashboard are return on assets, working capital ratio, return on equity etc.Are you in need of a template that can accommodate all of your creative concepts This one is crafted professionally and can be altered to fit any style. Use it with Google Slides or PowerPoint. Include striking photographs, symbols, depictions, and other visuals. Fill, move around, or remove text boxes as desired. Test out color palettes and font mixtures. Edit and save your work, or work with colleagues. Download Financial Kpi Dashboard To Measure Brand Performance Brand Value Estimation Guide Inspiration PDF and observe how to make your presentation outstanding. Give an impeccable presentation to your group and make your presentation unforgettable.

Guide To Develop And Estimate Brand Value Financial KPI Dashboard To Measure Brand Performance Formats PDF
Mentioned slide showcases KPI dashboard that can be used to check the financial performance of a brand. Metrics covered in the dashboard are return on assets, working capital ratio, return on equity etc.Coming up with a presentation necessitates that the majority of the effort goes into the content and the message you intend to convey. The visuals of a PowerPoint presentation can only be effective if it supplements and supports the story that is being told. Keeping this in mind our experts created Guide To Develop And Estimate Brand Value Financial KPI Dashboard To Measure Brand Performance Formats PDF to reduce the time that goes into designing the presentation. This way, you can concentrate on the message while our designers take care of providing you with the right template for the situation.
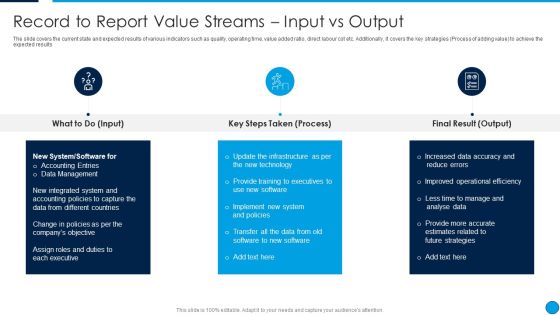
Summary Financial Record To Report Value Streams Input Vs Output Guidelines PDF
The slide covers the current state and expected results of various indicators such as quality, operating time, value added ratio, direct labour cot etc. Additionally, it covers the key strategies Process of adding value to achieve the expected results. This is a Summary Financial Record To Report Value Streams Input Vs Output Guidelines PDF template with various stages. Focus and dispense information on three stages using this creative set, that comes with editable features. It contains large content boxes to add your information on topics like New System, Accounting Entries, Data Management, Assign Roles And Duties. You can also showcase facts, figures, and other relevant content using this PPT layout. Grab it now.
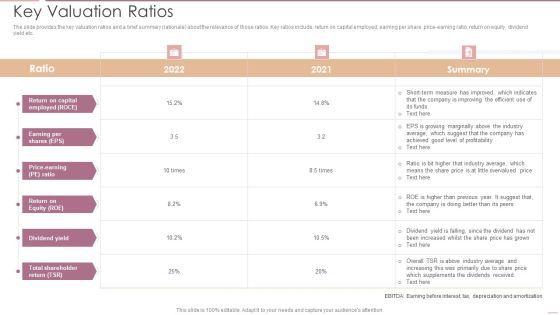
Investment Banking Security Underwriting Pitchbook Key Valuation Ratios Infographics PDF
The slide provides the key valuation ratios and a brief summary rationale about the relevance of those ratios. Key ratios include return on capital employed, earning per share, price-earning ratio, return on equity, dividend yield etc.Deliver and pitch your topic in the best possible manner with this Investment Banking Security Underwriting Pitchbook Key Valuation Ratios Infographics PDF Use them to share invaluable insights on Measure Improved, Dividends Received, Total Shareholder and impress your audience. This template can be altered and modified as per your expectations. So, grab it now.

Financial Software Supplier Brief Profiles Ppt PowerPoint Presentation Complete Deck With Slides
Induce strategic thinking by presenting this complete deck. Enthrall your audience by deploying this thought provoking PPT deck. It can be downloaded in both standard and widescreen aspect ratios, thus making it a complete package to use and deploy. Convey your thoughts and actions using the sixteen slides presented in this complete deck. Additionally, feel free to alter its components like color, graphics, design, etc, to create a great first impression. Grab it now by clicking on the download button below.

Effective Financial Risk Management Strategies Ppt PowerPoint Presentation Complete With Slides
Induce strategic thinking by presenting this complete deck. Enthrall your audience by deploying this thought provoking PPT deck. It can be downloaded in both standard and widescreen aspect ratios, thus making it a complete package to use and deploy. Convey your thoughts and actions using the forty two slides presented in this complete deck. Additionally, feel free to alter its components like color, graphics, design, etc, to create a great first impression. Grab it now by clicking on the download button below.
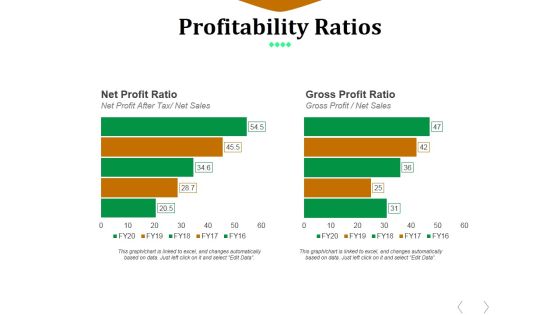
Profitability Ratios Template 2 Ppt PowerPoint Presentation Diagram Ppt
This is a profitability ratios template 2 ppt powerpoint presentation diagram ppt. This is a two stage process. The stages in this process are net profit ratio, gross profit ratio, net profit after tax, net sales.

Profitability Ratios Template 5 Ppt PowerPoint Presentation Model Clipart Images
This is a profitability ratios template 5 ppt powerpoint presentation model clipart images. This is a two stage process. The stages in this process are net operating profit, employed capital, net income, total assets.
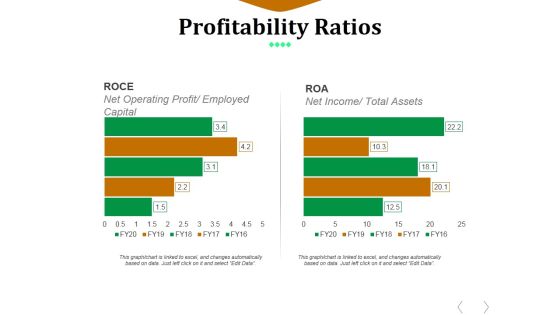
Profitability Ratios Template 6 Ppt PowerPoint Presentation File Infographic Template
This is a profitability ratios template 6 ppt powerpoint presentation file infographic template. This is a two stage process. The stages in this process are net operating profit, employed capital, net income, total assets.

Profitability Ratios Template 1 Ppt PowerPoint Presentation Inspiration Graphics Pictures
This is a profitability ratios template 1 ppt powerpoint presentation inspiration graphics pictures. This is a two stage process. The stages in this process are net profit ratio, net profit after tax, net sales, gross profit ratio.

Profitability Ratios Template 2 Ppt PowerPoint Presentation Professional Slide
This is a profitability ratios template 2 ppt powerpoint presentation professional slide. This is a two stage process. The stages in this process are net profit ratio, net profit after tax, net sales, gross profit ratio.

Profitability Ratios Template 5 Ppt PowerPoint Presentation File Elements
This is a profitability ratios template 5 ppt powerpoint presentation file elements. This is a two stage process. The stages in this process are roce, net operating profit, employed capital, net income, total assets.
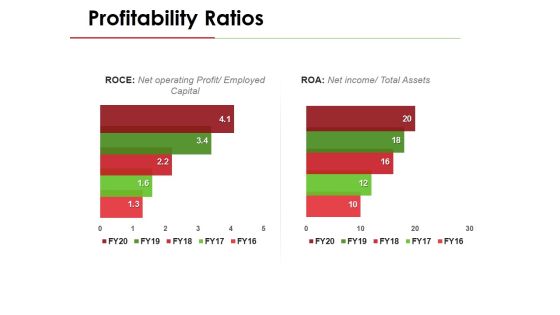
Profitability Ratios Template 6 Ppt PowerPoint Presentation Pictures Structure
This is a profitability ratios template 6 ppt powerpoint presentation pictures structure. This is a two stage process. The stages in this process are roce, net operating profit, employed capital, net income, total assets.
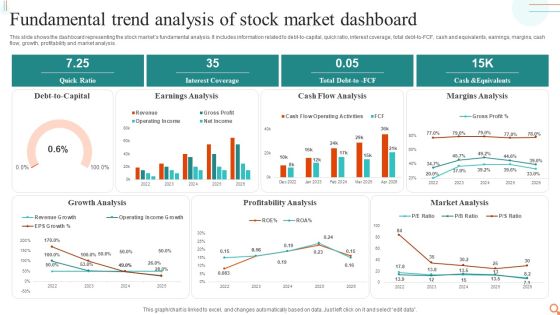
Fundamental Trend Analysis Of Stock Market Dashboard Professional PDF
This slide shows the dashboard representing the stock markets fundamental analysis. It includes information related to debt-to-capital, quick ratio, interest coverage, total debt-to-FCF, cash and equivalents, earnings, margins, cash flow, growth, profitability and market analysis.Showcasing this set of slides titled Fundamental Trend Analysis Of Stock Market Dashboard Professional PDF. The topics addressed in these templates are Earnings Analysis, Cash Flow Analysis, Margins Analysis. All the content presented in this PPT design is completely editable. Download it and make adjustments in color, background, font etc. as per your unique business setting.
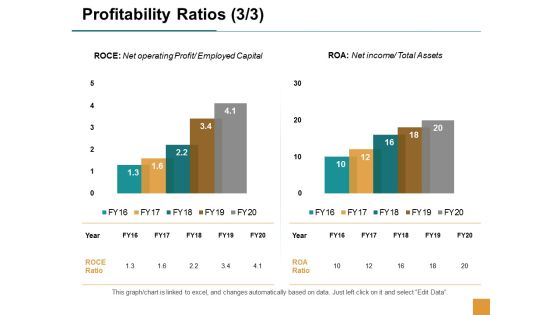
Profitability Ratios Finance Ppt Powerpoint Presentation Pictures Show
This is a profitability ratios finance ppt powerpoint presentation pictures show. This is a two stage process. The stages in this process are finance, marketing, management, investment, analysis.
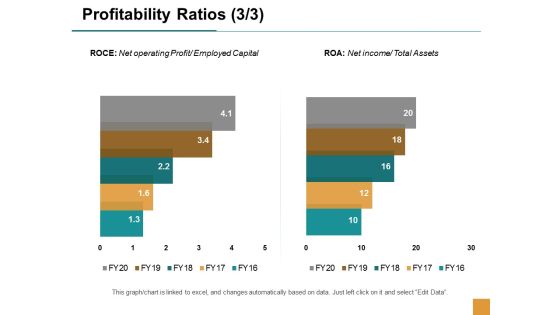
Profitability Ratios Management Ppt Powerpoint Presentation Pictures Graphics
This is aprofitability ratios management ppt powerpoint presentation pictures graphics. This is a two stage process. The stages in this process are finance, marketing, management, investment, analysis.
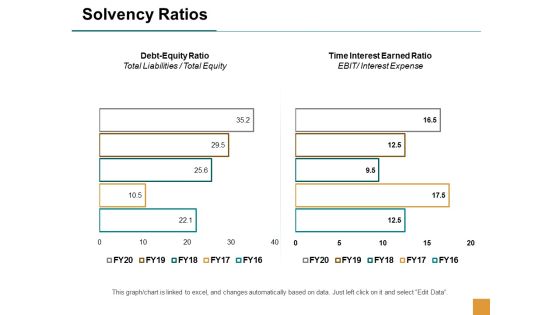
Solvency Ratios Marketing Ppt Powerpoint Presentation Infographics Template
This is a solvency ratios marketing ppt powerpoint presentation infographics template. This is a two stage process. The stages in this process are finance, marketing, management, investment, analysis.

Inventory Ratios Template 1 Ppt PowerPoint Presentation Gallery Master Slide
This is a inventory ratios template 1 ppt powerpoint presentation gallery master slide. This is a two stage process. The stages in this process are finance, marketing, analysis, business, investment, inventory ratios.
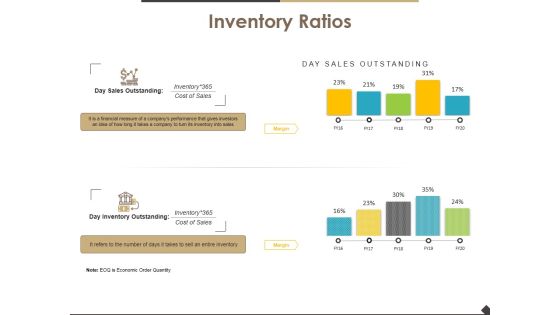
Inventory Ratios Template 2 Ppt PowerPoint Presentation Slide
This is a inventory ratios template 2 ppt powerpoint presentation slide. This is a two stage process. The stages in this process are finance, marketing, analysis, business, investment, inventory ratios.

Activity Ratios Template 1 Ppt PowerPoint Presentation Summary Slides
This is a activity ratios template 1 ppt powerpoint presentation summary slides. This is a two stage process. The stages in this process are business, management, analysis, finance, marketing.

Activity Ratios Template 2 Ppt PowerPoint Presentation Show Slides
This is a activity ratios template 2 ppt powerpoint presentation show slides. This is a two stage process. The stages in this process are business, management, analysis, finance, marketing.

Activity Ratios Template 1 Ppt PowerPoint Presentation Icon File Formats
This is a activity ratios template 1 ppt powerpoint presentation icon file formats. This is a two stage process. The stages in this process are finance, analysis, compere, business, marketing.

Activity Ratios Template 2 Ppt PowerPoint Presentation Model Design Inspiration
This is a activity ratios template 2 ppt powerpoint presentation model design inspiration. This is a two stage process. The stages in this process are finance, analysis, compere, business, marketing.

Profitability Ratios Template 1 Ppt PowerPoint Presentation Infographic Template Images
This is a profitability ratios template 1 ppt powerpoint presentation infographic template images. This is a two stage process. The stages in this process are finance, analysis, compere, strategy, business.

Activity Ratios Template 1 Ppt PowerPoint Presentation Portfolio Graphics
This is a activity ratios template 1 ppt powerpoint presentation portfolio graphics. This is a two stage process. The stages in this process are finance, chart graph, marketing, planning, analysis.

Activity Ratios Template 4 Ppt PowerPoint Presentation Portfolio Backgrounds
This is a activity ratios template 4 ppt powerpoint presentation portfolio backgrounds. This is a two stage process. The stages in this process are finance, chart graph, marketing, planning, analysis.

Liquidity Ratios Template Ppt PowerPoint Presentation Outline Elements
This is a liquidity ratios template ppt powerpoint presentation outline elements. This is a two stage process. The stages in this process are finance, chart graph, marketing, planning, analysis.

Activity Ratios Template 1 Ppt PowerPoint Presentation Slides Example Topics
This is a activity ratios template 1 ppt powerpoint presentation slides example topics. This is a two stage process. The stages in this process are business, finance, strategy, marketing, analysis.

Activity Ratios Template 2 Ppt PowerPoint Presentation Summary Background Images
This is a activity ratios template 2 ppt powerpoint presentation summary background images. This is a two stage process. The stages in this process are business, finance, strategy, marketing, analysis.

Activity Ratios Template 3 Ppt PowerPoint Presentation Professional Graphic Tips
This is a activity ratios template 3 ppt powerpoint presentation professional graphic tips. This is a two stage process. The stages in this process are business, finance, marketing, strategy, analysis.

Activity Ratios Template 4 Ppt PowerPoint Presentation Gallery Slides
This is a activity ratios template 4 ppt powerpoint presentation gallery slides. This is a two stage process. The stages in this process are business, finance, marketing, strategy, analysis.

Activity Ratios Business Marketing Ppt Powerpoint Presentation Styles Mockup
This is a activity ratios business marketing ppt powerpoint presentation styles mockup. This is a two stage process. The stages in this process are finance, marketing, management, investment, analysis.

Activity Ratios Business Ppt Powerpoint Presentation Ideas Infographic Template
This is a activity ratios business ppt powerpoint presentation ideas infographic template. This is a two stage process. The stages in this process are finance, marketing, management, investment, analysis.

Activity Ratios Inventory Turnover Ppt Powerpoint Presentation Professional Visual Aids
This is a activity ratios inventory turnover ppt powerpoint presentation professional visual aids. This is a two stage process. The stages in this process are finance, marketing, management, investment, analysis.

Activity Ratios Management Strategy Ppt Powerpoint Presentation File Structure
This is a activity ratios management strategy ppt powerpoint presentation file structure. This is a two stage process. The stages in this process are finance, marketing, management, investment, analysis.
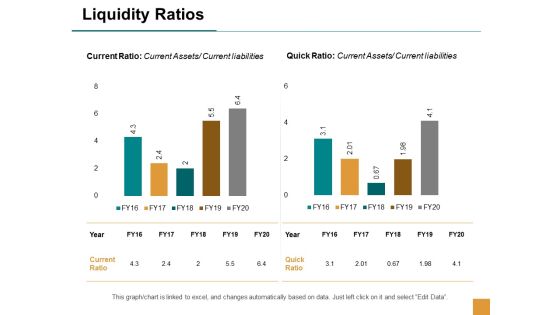
Liquidity Ratios Finance Marketing Ppt Powerpoint Presentation Professional Tips
This is a liquidity ratios finance marketing ppt powerpoint presentation professional tips. This is a two stage process. The stages in this process are finance, marketing, management, investment, analysis.

Liquidity Ratios Marketing Management Ppt Powerpoint Presentation Portfolio Vector
This is a liquidity ratios marketing management ppt powerpoint presentation portfolio vector. This is a two stage process. The stages in this process are finance, marketing, management, investment, analysis.

Profitability Ratios Finance Marketing Ppt Powerpoint Presentation Inspiration Design Ideas
This is a profitability ratios finance marketing ppt powerpoint presentation inspiration design ideas. This is a two stage process. The stages in this process are finance, marketing, management, investment, analysis.

Profitability Ratios Investment Marketing Ppt Powerpoint Presentation Professional Graphics Design
This is a profitability ratios investment marketing ppt powerpoint presentation professional graphics design. This is a two stage process. The stages in this process are finance, marketing, management, investment, analysis.

Profitability Ratios Management Business Ppt Powerpoint Presentation Summary Rules
This is a profitability ratios management business ppt powerpoint presentation summary rules. This is a two stage process. The stages in this process are finance, marketing, management, investment, analysis.

Profitability Ratios Management Marketing Ppt Powerpoint Presentation Layouts Templates
This is a profitability ratios management marketing ppt powerpoint presentation layouts templates. This is a two stage process. The stages in this process are finance, marketing, management, investment, analysis.
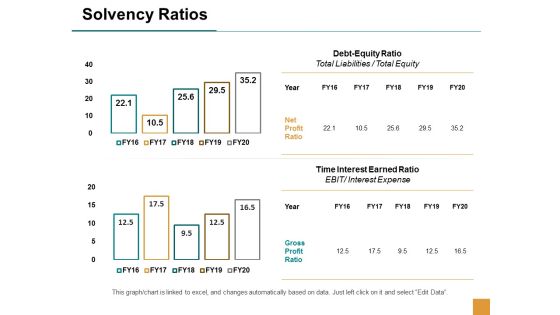
Solvency Ratios Business Ppt Powerpoint Presentation Infographic Template Influencers
This is a solvency ratios business ppt powerpoint presentation infographic template influencers. This is a four stage process. The stages in this process are finance, marketing, management, investment, analysis.
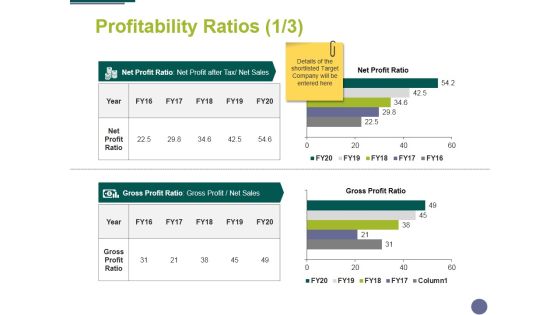
Profitability Ratios Template 1 Ppt PowerPoint Presentation Professional Skills
This is a profitability ratios template 1 ppt powerpoint presentation professional skills. This is a two stage process. The stages in this process are compere, finance, marketing, analysis, business.
Profitability Ratios Template 2 Ppt PowerPoint Presentation Icon Objects
This is a profitability ratios template 2 ppt powerpoint presentation icon objects. This is a two stage process. The stages in this process are compere, finance, marketing, analysis, business.

Profitability Ratios Template 3 Ppt PowerPoint Presentation Ideas Skills
This is a profitability ratios template 3 ppt powerpoint presentation ideas skills. This is a two stage process. The stages in this process are compere, finance, marketing, analysis, business.

Profitability Ratios Template 1 Ppt PowerPoint Presentation Infographics Mockup
This is a profitability ratios template 1 ppt powerpoint presentation infographics mockup. This is a two stage process. The stages in this process are business, finance, marketing, strategy, analysis.

Profitability Ratios Template 2 Ppt PowerPoint Presentation Outline Graphics Pictures
This is a profitability ratios template 2 ppt powerpoint presentation outline graphics pictures. This is a two stage process. The stages in this process are business, finance, marketing, analysis, investment.

Profitability Ratios Template 2 Ppt PowerPoint Presentation File Graphics
This is a profitability ratios template 2 ppt powerpoint presentation file graphics. This is a two stage process. The stages in this process are finance, analysis, compere, strategy, business.

Profitability Ratios Template 3 Ppt PowerPoint Presentation Styles Introduction
This is a profitability ratios template 3 ppt powerpoint presentation styles introduction. This is a two stage process. The stages in this process are finance, analysis, compere, strategy, business.
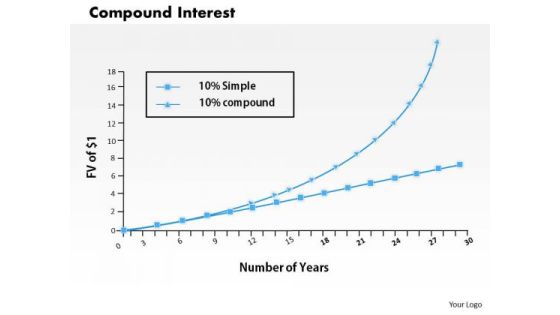
Business Framework Compound Interest PowerPoint Presentation
This business framework template displays compound interest graph. This image slide has been crafted to depict financial ratio analysis. Use this image slide, in your presentations to express views on business and marketing management. This image slide will enhance the quality of your presentations.

Percentage Data Growth Chart Powerpoint Slides
This PowerPoint template has been designed with percentage data growth chart. Download this PPT chart to depict financial ratio analysis. This PowerPoint slide is of great help in the business sector to make realistic presentations and provides effective way of presenting your newer thoughts.
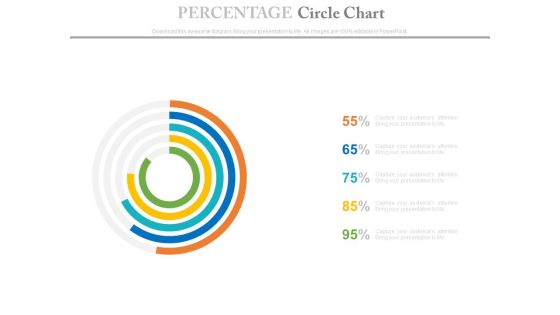
Percentage Data Circle Chart Powerpoint Slides
This PowerPoint template has been designed with circle chart. Download this PPT chart to depict financial ratio analysis. This PowerPoint slide is of great help in the business sector to make realistic presentations and provides effective way of presenting your newer thoughts.
Green Plant For Dollar Growth Powerpoint Templates
This business slide contains graphics of Venn circles. This diagram is suitable to present financial ratio analysis. Download this diagram for schematic representation of any information. Visual effect of this slide helps in maintaining the flow of the discussion and provides more clarity to the subject.

Real Estate Assets Financing Analysis Executive Summary For Real Estate Property Rules PDF
This slide portrays information regarding the executive summary of real estate property in terms of financial ratios and acquisition cost. Deliver an awe inspiring pitch with this creative real estate assets financing analysis executive summary for real estate property rules pdf bundle. Topics like average, price, financial ratios, before equity can be discussed with this completely editable template. It is available for immediate download depending on the needs and requirements of the user.

Internal And External Business Environment Analysis Forcasted Impact Of Business Environmental Variables Portrait PDF
This slide shows forecasted impact on business profits and financial ratios by implementing strategical steps to improve business performance in next 5 years Deliver an awe inspiring pitch with this creative internal and external business environment analysis forcasted impact of business environmental variables portrait pdf bundle. Topics like material production, improving the product, differentiating from the competitors can be discussed with this completely editable template. It is available for immediate download depending on the needs and requirements of the user.

Analyzing The Target Company For Merger And Acquisition Microsoft PDF
The following slide helps in understanding the target company profile. It highlights essential information such as the year company was founded in, its headquarter, no. of employees, important financial ratios etc. Presenting Analyzing The Target Company For Merger And Acquisition Microsoft PDF to provide visual cues and insights. Share and navigate important information on one stages that need your due attention. This template can be used to pitch topics like Financial Ratio Analysis, Quick Ratio, Target Company. In addtion, this PPT design contains high resolution images, graphics, etc, that are easily editable and available for immediate download.

Grow Capital Through Equity Debt Proceeds Analysis Follow On Offering Diagrams PDF
The slide provides the pro-forma credit statistics and ratios which includes EBITDA, free cash flow, total equity, total capital, net capital, etc.Make sure to capture your audiences attention in your business displays with our gratis customizable Grow Capital Through Equity Debt Proceeds Analysis Follow On Offering Diagrams PDF. These are great for business strategies, office conferences, capital raising or task suggestions. If you desire to acquire more customers for your tech business and ensure they stay satisfied, create your own sales presentation with these plain slides.
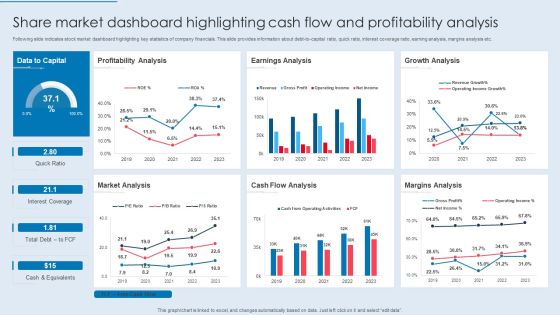
Share Market Dashboard Highlighting Cash Flow And Profitability Analysis Information PDF
Following slide indicates stock market dashboard highlighting key statistics of company financials. This slide provides information about debt-to-capital ratio, quick ratio, interest coverage ratio, earning analysis, margins analysis etc. Showcasing this set of slides titled Share Market Dashboard Highlighting Cash Flow And Profitability Analysis Information PDF. The topics addressed in these templates are Profitability Analysis, Earnings Analysis, Growth Analysis. All the content presented in this PPT design is completely editable. Download it and make adjustments in color, background, font etc. as per your unique business setting.

Monetary Investment Portfolio Growth And Administration Major Tools For Portfolio Investment Analysis Designs PDF
This slide represents major tools for portfolio investment analysis. It includes holding term return, athematic mean, Sharpe ration, alpha etc. Deliver an awe inspiring pitch with this creative Monetary Investment Portfolio Growth And Administration Major Tools For Portfolio Investment Analysis Designs PDF bundle. Topics like Information Ratio, Investment Strategy, Portfolio Investment Analysis can be discussed with this completely editable template. It is available for immediate download depending on the needs and requirements of the user.
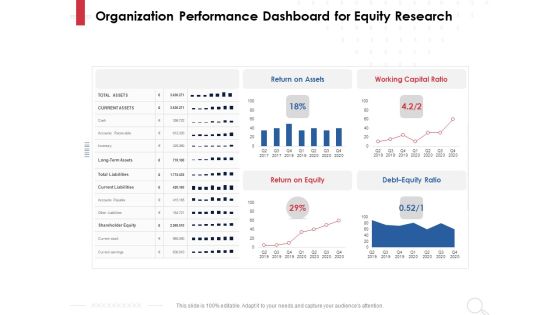
Equity Analysis Project Organization Performance Dashboard For Equity Research Ppt PowerPoint Presentation Styles Slide Portrait PDF
Presenting this set of slides with name equity analysis project organization performance dashboard for equity research ppt powerpoint presentation styles slide portrait pdf. The topics discussed in these slides are return equity, return assets, working capital ratio, debt equity ratio. This is a completely editable PowerPoint presentation and is available for immediate download. Download now and impress your audience.
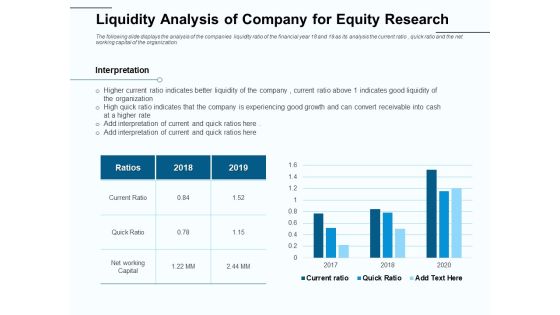
Fund Investment Advisory Statement Liquidity Analysis Of Company For Equity Research Topics PDF
Presenting this set of slides with name fund investment advisory statement liquidity analysis of company for equity research topics pdf. The topics discussed in these slides are current ratio, quick ratio, net working capital. This is a completely editable PowerPoint presentation and is available for immediate download. Download now and impress your audience.
Equity Analysis Project Review And Rating Operating Revenue Ppt PowerPoint Presentation Icon Styles PDF
Presenting this set of slides with name equity analysis project review and rating operating revenue ppt powerpoint presentation icon styles pdf. The topics discussed in these slides are criteria, figures, rating, profit equity ratio, market capitalization, valuation score, operating revenue . This is a completely editable PowerPoint presentation and is available for immediate download. Download now and impress your audience.
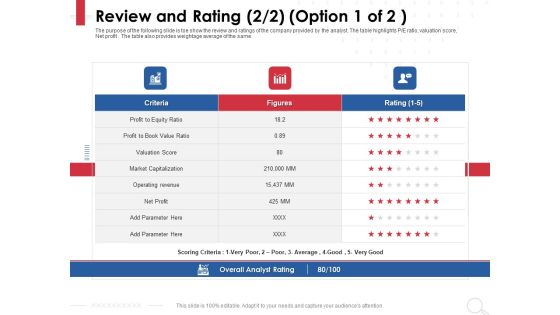
Equity Analysis Project Review And Rating Market Capitalization Ppt PowerPoint Presentation Show Graphics Template PDF
Presenting this set of slides with name equity analysis project review and rating market capitalization ppt powerpoint presentation show graphics template pdf. The topics discussed in these slides are criteria, figures, rating, profit equity ratio, market capitalization, valuation score, operating revenue . This is a completely editable PowerPoint presentation and is available for immediate download. Download now and impress your audience.
 Home
Home