AI PPT Maker
Templates
PPT Bundles
Design Services
Business PPTs
Business Plan
Management
Strategy
Introduction PPT
Roadmap
Self Introduction
Timelines
Process
Marketing
Agenda
Technology
Medical
Startup Business Plan
Cyber Security
Dashboards
SWOT
Proposals
Education
Pitch Deck
Digital Marketing
KPIs
Project Management
Product Management
Artificial Intelligence
Target Market
Communication
Supply Chain
Google Slides
Research Services
 One Pagers
All Categories
-
Home
- Customer Favorites
- Financial Planning
Financial Planning

Business Framework Equity Valuation PowerPoint Presentation
This business framework Power Point template diagram has been crafted with graphic of three stage diagram. This PPT diagram contains the concept of equity valuation. Use this PPT diagram for your financial system related presentations.

Business Framework Poverty Index PowerPoint Presentation
A linear growth chart with text boxes has been used to decorate this Power Point template slide. This diagram slide contains the concept of poverty index. Use this index in your financial presentations to show poverty based calculation.
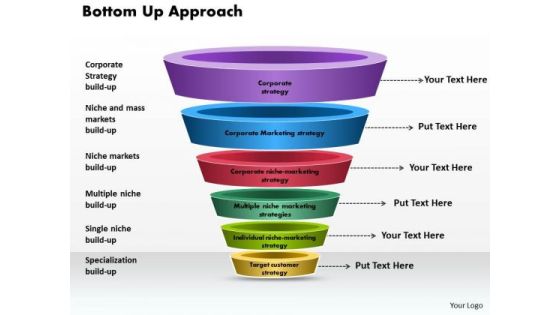
Business Framework Bottom Up Approach PowerPoint Presentation
This power point diagram slide has been crafted with bottom up approach. In this diagram, we have used multilevel funnel diagram with individual state. Use this diagram for your financial presentations and display bottom up approach in an graphical manner.
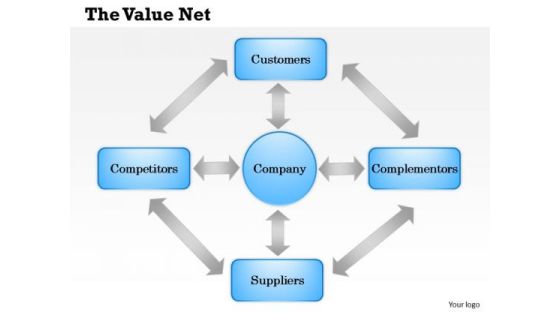
Business Framework The Value Net PowerPoint Presentation
This business power point diagram template has been designed with graphic of multiple staged. This diagram template can be used for value net calculation display in any financial and business presentations.
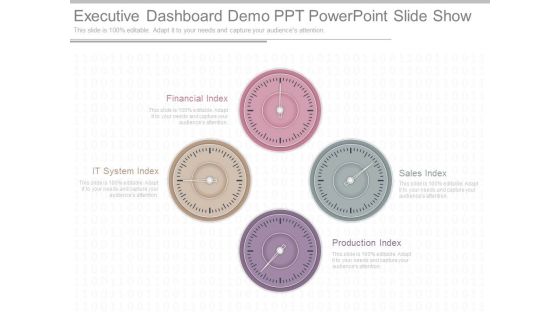
Executive Dashboard Demo Ppt Powerpoint Slide Show
This is a executive dashboard demo ppt powerpoint slide show. This is a four stage process. The stages in this process are financial index, it system index, production index, sales index.
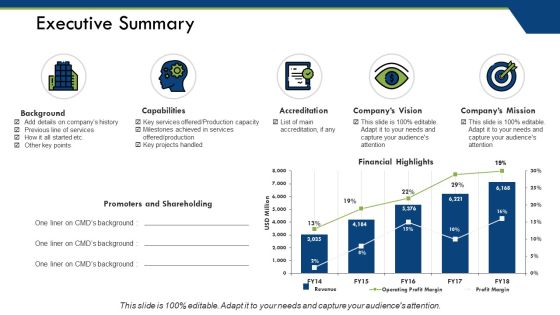
Executive Summary Ppt PowerPoint Presentation Show Grid
This is a executive summary ppt powerpoint presentation show grid. This is a five stage process. The stages in this process are background, capabilities, accreditation, financial highlights, promoters and shareholding.

Analysis And Valuation Of Equity Securities Ppt PowerPoint Presentation Outline Example Topics
This is a analysis and valuation of equity securities ppt powerpoint presentation outline example topics. This is a three stage process. The stages in this process are industry analysis, valuation of equity securities, financial statement analysis.

Assuring Management In Product Innovation To Enhance Processes Strategy Mapping For Product Leadership Introduction PDF
This slide focuses on strategy mapping for product leadership which covers four perspectives such as financial, customer, internal, learning and growth.Deliver an awe inspiring pitch with this creative assuring management in product innovation to enhance processes strategy mapping for product leadership introduction pdf bundle. Topics like financial perspective, customer perspective, internal perspective can be discussed with this completely editable template. It is available for immediate download depending on the needs and requirements of the user.

Business Model Template 1 Ppt PowerPoint Presentation Infographic Template File Formats
This is a business model template 1 ppt powerpoint presentation infographic template file formats. This is a six stage process. The stages in this process are outstanding design, deliver financial results, industry leading customer experience, innovative sales and marketing.

Culture Success Factors Illustration Presentation Powerpoint
This is a culture success factors illustration presentation powerpoint. This is a six stage process. The stages in this process are merger success, changing client expectation, people power and politics, public policy, financial sustainability, cultural change, strategic positioning.
Promotional Ability Presentation Powerpoint Example
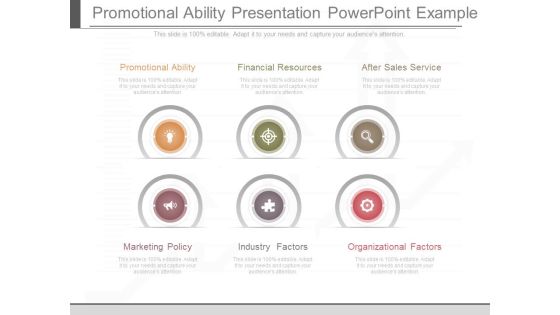
This is a promotional ability presentation powerpoint example. This is a six stage process. The stages in this process are promotional ability, financial resources, after sales service, marketing policy, industry factors, organizational factors.
Product Roadmaps Graphic Design Presentation Ideas
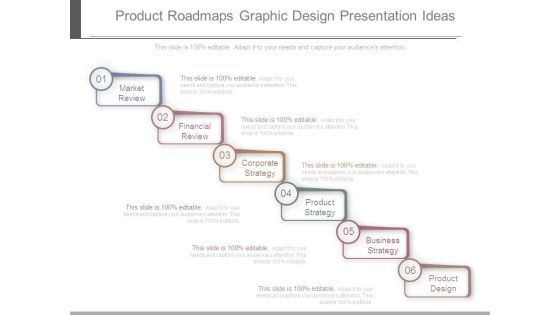
This is a product roadmaps graphic design presentation ideas. This is a six stage process. The stages in this process are market review, financial review, corporate strategy, product strategy, business strategy, product design.
Business Framework Black Scholes Ption Pricing Model PowerPoint Presentation
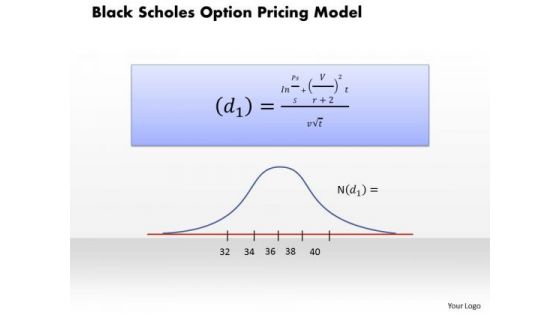
This power point diagram has been crafted with graphic of black scholes ption pricing model. Use this model for various pricing valuation. Explain its graphical representation with our exclusive model. Use this diagram slide for financial presentation.

Business Framework Bond Prices And Yields PowerPoint Presentation
This power point diagram slide has been crafted with graphic of statistics of bond price and yields. Display the dependency in-between these two fields with this innovative diagram slide. This slide is very useful for financial presentations.

Business Framework Phases Of The Credit Cycle PowerPoint Presentation
Four arrows with interconnection in circular design has been used to design this power Point template slide. This diagram slide contains the concept of credit phases. This PPT slide can be used for financial presentations.
Types Of Audit Procedure Ppt PowerPoint Presentation Pictures
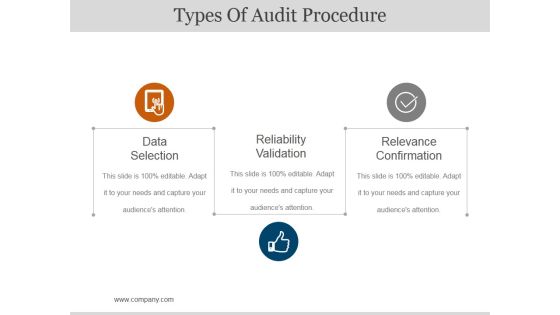
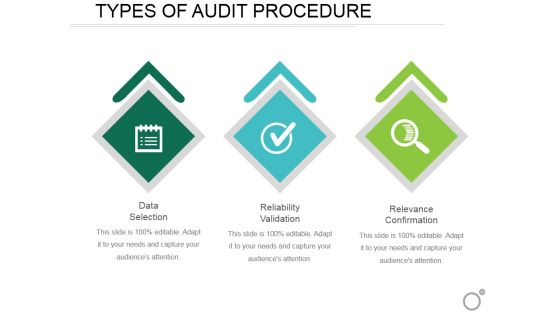
This is a types of audit procedure ppt powerpoint presentation pictures. This is a five stage process. The stages in this process are financial statements audit, operational audits, forensic audits, compliance audits, comprehensive audits.
Types Of Audit Procedure Ppt PowerPoint Presentation Portfolio Example
This is a types of audit procedure ppt powerpoint presentation portfolio example. This is a five stage process. The stages in this process are comprehensive audits, compliance audits, forensic audits, operational audis, financial statements audit.

Annual Report Vector Icon Ppt Powerpoint Presentation File Gridlines
This is a annual report vector icon ppt powerpoint presentation file gridlines. This is a three stage process. The stages in this process are financial statements icon, accounting ratio icon, balance sheet icon.

Balance Sheet Vector Icon Ppt Powerpoint Presentation Designs Download
This is a balance sheet vector icon ppt powerpoint presentation designs download. This is a three stage process. The stages in this process are financial statements icon, accounting ratio icon, balance sheet icon.

Business Report Vector Icon Ppt Powerpoint Presentation Summary Guidelines
This is a business report vector icon ppt powerpoint presentation summary guidelines. This is a three stage process. The stages in this process are financial statements icon, accounting ratio icon, balance sheet icon.
Income Statement And Auditing Vector Icon Ppt Powerpoint Presentation Clipart
This is a income statement and auditing vector icon ppt powerpoint presentation clipart. This is a three stage process. The stages in this process are financial statements icon, accounting ratio icon, balance sheet icon.

Knowledge Management Process Model Ppt Slides
This is a knowledge management process model ppt slides. This is a six stage process. The stages in this process are knowledge manager, reports dashboard, metrics manager, financial tracker, resource manager, project tracker, result, strategy, execution.
Business Framework Multi Level Growth Text Table Text Boxes 2 PowerPoint Presentation
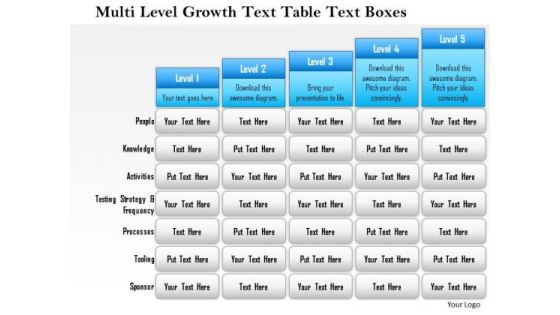
Five staged text box style chart in bar graph design has been used to decorate this power point template slide. This diagram slide contains the multilevel growth concept. Use this PPT slide for financial growth and result analysis related topics.

Adverse Consequences Of Workplace Discrimination Training Ppt
This slide lists six major damaging consequences of workplace discrimination. These are poor employee engagement and satisfaction decline in morale health concerns in employees companys poor reputation financial loss, and litigation.
Partnerships And Joint Ventures Ppt Images Gallery
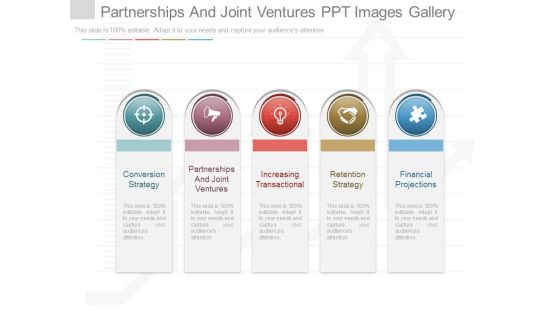
This is a partnerships and joint ventures ppt images gallery. This is a five stage process. The stages in this process are conversion strategy, partnerships and joint ventures, increasing transactional, retention strategy, financial projections.
Examples Of Performance Management Goals Ppt Design
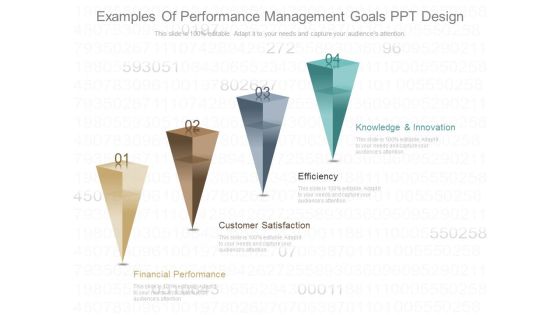
This is an examples of performance management goals ppt design. This is a four stage process. The stages in this process are financial performance, customer satisfaction, efficiency, knowledge and innovation.

Area Chart Ppt PowerPoint Presentation Layouts Vector
This is a area chart ppt powerpoint presentation layouts vector. This is a two stage process. The stages in this process are area chart, product, sales in percentage, financial year.

Column Chart Ppt PowerPoint Presentation Ideas Vector
This is a column chart ppt powerpoint presentation ideas vector. This is a two stage process. The stages in this process are column chart, product, financial years, sales in percentage, growth.

Line Chart Ppt PowerPoint Presentation Professional Grid
This is a line chart ppt powerpoint presentation professional grid. This is a two stage process. The stages in this process are sales in percentage, financial years, product, line chart.
Line Chart Ppt PowerPoint Presentation Ideas Elements
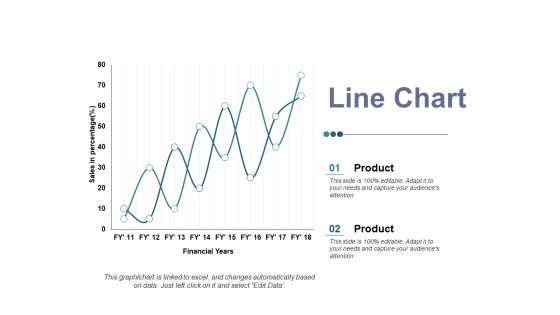
This is a line chart ppt powerpoint presentation ideas elements. This is a two stage process. The stages in this process are product, sales in percentage, financial year, business, line chart.

Area Chart Ppt PowerPoint Presentation Icon Summary
This is a area chart ppt powerpoint presentation icon summary. This is a two stage process. The stages in this process are financial year, area chart, in percentage, product.

Column Chart Ppt PowerPoint Presentation Gallery Background
This is a column chart ppt powerpoint presentation gallery background. This is a two stage process. The stages in this process are product, sales in percentage, financial year, graph, success.

Bar Chart Ppt PowerPoint Presentation Icon Information
This is a bar chart ppt powerpoint presentation icon information. This is a one stage process. The stages in this process are product, sales in percentage, financial years, bar graph, growth.

Column Chart Ppt PowerPoint Presentation Layouts Tips
This is a column chart ppt powerpoint presentation layouts tips. This is a six stage process. The stages in this process are sales in percentage, financial year, bar graph, growth, success.

Line Chart Ppt PowerPoint Presentation Infographics Infographics
This is a line chart ppt powerpoint presentation infographics infographics. This is a two stage process. The stages in this process are product, sales in percentage, financial year, line chart, finance.

Line Chart Ppt PowerPoint Presentation Gallery Rules
This is a line chart ppt powerpoint presentation gallery rules. This is a two stage process. The stages in this process are financial years, product, sales in percentage, line chart, growth.

Line Chart Ppt PowerPoint Presentation Gallery Templates
This is a line chart ppt powerpoint presentation gallery templates. This is a two stage process. The stages in this process are product, financial years, sales in percentage, line chart.

Area Chart Ppt PowerPoint Presentation Icon Show
This is a area chart ppt powerpoint presentation icon show. This is a two stage process. The stages in this process are product, financial year, in percentage, area chart.

Column Chart Ppt PowerPoint Presentation Slides Show
This is a column chart ppt powerpoint presentation slides show. This is a two stage process. The stages in this process are column chart, product, sales in percentage, financial year, growth.
Line Chart Ppt PowerPoint Presentation Summary Ideas
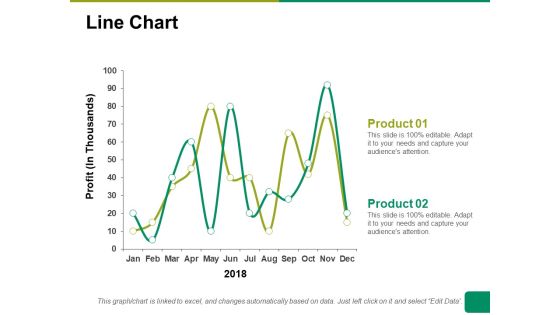
This is a line chart ppt powerpoint presentation summary ideas. This is a two stage process. The stages in this process are line chart, profit, product, financial years, business.

Pie Chart Infographic Diagram Powerpoint Templates
This Power Point template has been designed with pie chart infographic. This business slide is useful to present financial ratio analysis. Use this diagram to make business presentation. Illustrate these thoughts with this slide.

Basic Accounting And Bookkeeping Chart Ppt Slides
This is a basic accounting and bookkeeping chart ppt slides. This is a five stage process. The stages in this process are financial statements, source documents, accounting cycle, journals, ledger, trial balance.

Circular Flow Of Income Chart Ppt Presentation
This is a circular flow of income chart ppt presentation. This is a four stage process. The stages in this process are real estate, government, financial institutions, export import, firms.

Marchandise Management System Chart Ppt Sample
This is a marchandise management system chart ppt sample. This is a seven stage process. The stages in this process are payment management, inspection, marketing, sourcing, channel management, financial management, orders.
Sample Of Charting Diagram Powerpoint Slide Backgrounds
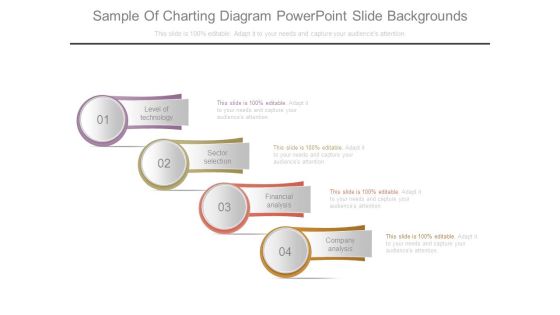
This is a sample of charting diagram powerpoint slide backgrounds. This is a four stage process. The stages in this process are level of technology, sector selection, financial analysis, company analysis.

Area Chart Ppt PowerPoint Presentation Gallery Icons
This is a area chart ppt powerpoint presentation gallery icons. This is a two stage process. The stages in this process are financial year, sales in percentage, product, finance, graph.

Area Chart Ppt PowerPoint Presentation Pictures Files
This is a area chart ppt powerpoint presentation pictures files. This is a two stage process. The stages in this process are product, sales, in percentage, financial year, business.

Line Chart Ppt PowerPoint Presentation Layouts Example
This is a line chart ppt powerpoint presentation layouts example. This is a two stage process. The stages in this process are sales in percentage, product, financial years, growth, success.

Line Chart Ppt PowerPoint Presentation Show Guide
This is a line chart ppt powerpoint presentation show guide. This is a two stage process. The stages in this process are product, sales in percentage, financial years, growth, success.

Business Framework Marshall Lerner Condition Ju Curve PowerPoint Presentation
Explain the Marshall Lerner condition and J-curve with suitable graphics. This business framework has been crafted with j-curve graphics. Use this PPT in your financial presentation to explain the depreciation and devaluation of currency for any country.

PowerPoint Theme Ring Chart Diagram Growth Ppt Template
PowerPoint Theme Ring Chart Diagram Growth PPT Template-Use this graphical approach to represent global business issues such as financial data, stock market Exchange, increase in sales, corporate presentations and more.-PowerPoint Theme Ring Chart Diagram Growth PPT Template
Line Chart Ppt PowerPoint Presentation Show Graphics Example
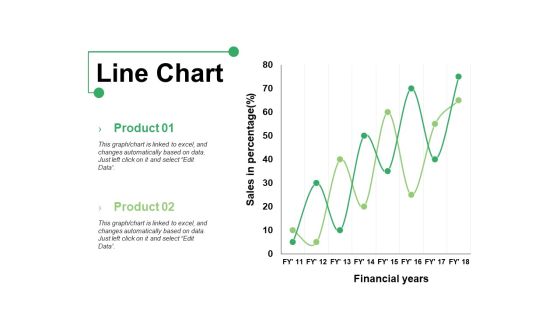
This is a line chart ppt powerpoint presentation show graphics example. This is a two stage process. The stages in this process are product, line chart, financial years, sales in percentage.

Column Chart Ppt PowerPoint Presentation Portfolio Example Topics
This is a column chart ppt powerpoint presentation portfolio example topics. This is a two stage process. The stages in this process are product, financial year, sales in percentage, column chart.
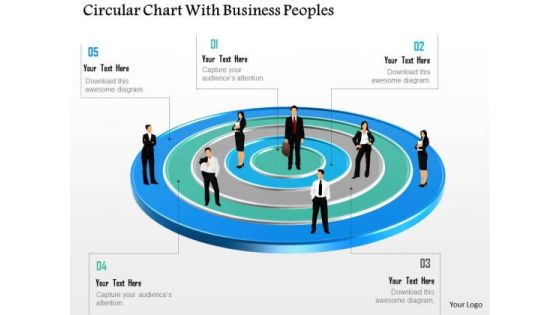
Business Diagram Circular Chart With Business Peoples Presentation Template
This business diagram has been designed with graphic of business people on circular chart. This diagram is designed to depict team meeting on financial matter. This diagram offers a way for your audience to visually conceptualize the process.

Line Chart Ppt PowerPoint Presentation Infographics Graphic Images
This is a line chart ppt powerpoint presentation infographics graphic images. This is a two stage process. The stages in this process are sales in percentage, financial years, growth, business, marketing.

Line Chart Ppt PowerPoint Presentation Professional Graphics Design
This is a line chart ppt powerpoint presentation professional graphics design. This is a two stage process. The stages in this process are financial years, sales in percentage, product, growth, success.

Column Chart Ppt PowerPoint Presentation Slides Visual Aids
This is a column chart ppt powerpoint presentation slides visual aids. This is a six stage process. The stages in this process are bar graph, growth, success, sales in percentage, financial year.

Line Chart Ppt PowerPoint Presentation Infographic Template Master Slide
This is a line chart ppt powerpoint presentation infographic template master slide. This is a two stage process. The stages in this process are product, financial years, sales in percentage.
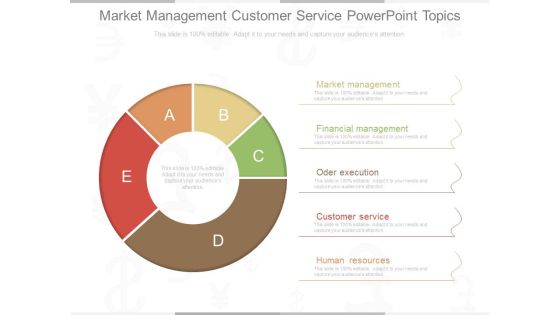
Market Management Customer Service Powerpoint Topics
This is a market management customer service powerpoint topics. This is a five stage process. The stages in this process are market management, financial management, oder execution, customer service, human resources.

Corporate Structuring Diagram Presentation Backgrounds
This is a corporate structuring diagram presentation backgrounds. This is a three stage process. The stages in this process are shareholders, board of directors, chief executive officer, chairman, chief operating officer, chief financial officer.

Stock Photo Graphics For Business Reports And Charts PowerPoint Slide
This image contains graphics of business reports and charts. Download this image for business and sales presentations where you have to focus on financial growth. Dazzle the audience with your thoughts.
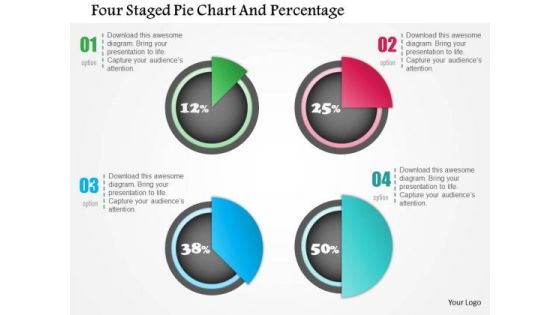
Business Diagram Four Staged Pie Chart And Percentage Presentation Template
Four staged pie chart and percentage values has been used to design this power point template. This PPT contains the concept of financial result analysis. Use this PPT for business and marketing related presentations.
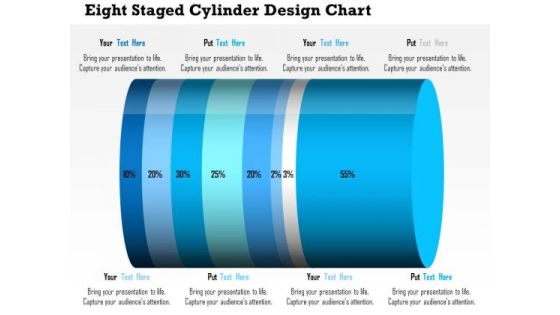
Business Daigram Eight Staged Cylinder Design Chart Presentation Templets
This business diagram contains eight staged cylinder design chart with percentage ratio. Download this diagram to display financial analysis. Use this diagram to make business and marketing related presentations.
Pie Chart With Seven Business Icons Powerpoint Templates
Our compelling template consists with a design of pie chart with seven business icons. This slide has been professionally designed to exhibit financial ratio analysis. This template offers an excellent background to build impressive presentation.
Pie Chart On Clipboard For Analysis Powerpoint Template
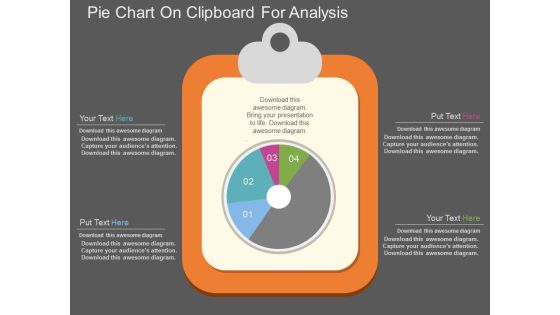
This PowerPoint template has been designed with graphics of pie chart on clipboard. Download this PPT slide for business and financial analysis. You may also use this professional template to depict statistical analysis.
Stakeholders Needs Development Cycle Chart Example Of Ppt
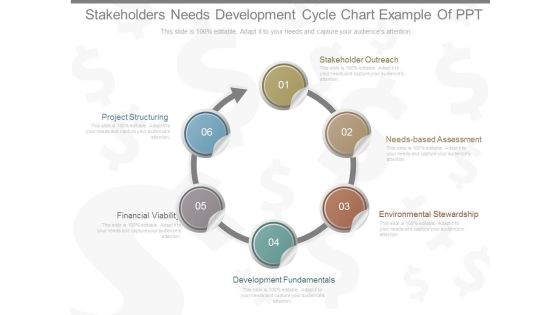
This is a stakeholders needs development cycle chart example of ppt. This is a six stage process. The stages in this process are stakeholder outreach, needs based assessment, environmental stewardship,, development fundamentals, financial viability, project structuring.

Corporate Public Relation Puzzle Chart Powerpoint Slide Show
This is a corporate public relation puzzle chart powerpoint slide show. This is a nine stage process. The stages in this process are business partners, media, employees, customers, shareholders, investors, financial marketing, politics and state administration, pr.

Cycle Chart Of Mutual Funds Sample Diagram Ppt Images
This is a cycle chart of mutual funds sample diagram ppt images. This is a five stage process. The stages in this process are reinvestment, returns, investors, fund manager, financial securities.

Small Business Structure Chart Example Powerpoint Slide Background Image
This is a small business structure chart example powerpoint slide background image. This is a six stage process. The stages in this process are financial manager, sales, distributions, finance, operations, general manager.

Area Chart Ppt PowerPoint Presentation Show Layout Ideas
This is a area chart ppt powerpoint presentation show layout ideas. This is a two stage process. The stages in this process are product, in percentage, financial year, growth.

Scatter Bubble Chart Ppt PowerPoint Presentation Summary Files
This is a scatter bubble chart ppt powerpoint presentation summary files. This is a six stage process. The stages in this process are product, financial year, profit, highest profit.
Scatter Bubble Chart Ppt PowerPoint Presentation Icon Elements
This is a scatter bubble chart ppt powerpoint presentation icon elements. This is a six stage process. The stages in this process are highest profit, profit, financial year, product.
Scatter Chart Ppt PowerPoint Presentation File Background Image
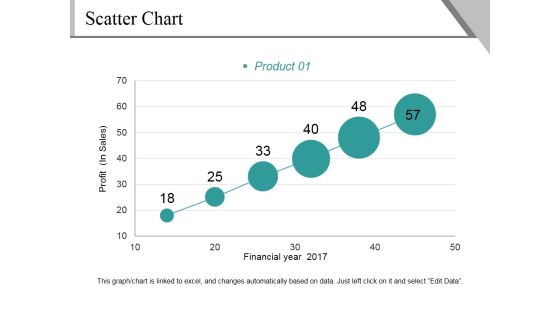
This is a scatter chart ppt powerpoint presentation file background image. This is a six stage process. The stages in this process are profit, financial year, product, growth, success.

Column Chart Ppt PowerPoint Presentation Model Graphics Download
This is a column chart ppt powerpoint presentation model graphics download. This is a two stage process. The stages in this process are product, financial year, sales in percentage, bar graph, success.

Column Chart Ppt PowerPoint Presentation Gallery Slide Portrait
This is a column chart ppt powerpoint presentation gallery slide portrait. This is a two stage process. The stages in this process are sales in percentage, financial year, product, bar graph, growth.

Bar Chart Ppt PowerPoint Presentation Infographics Format Ideas
This is a bar chart ppt powerpoint presentation infographics format ideas. This is a two stage process. The stages in this process are bar graph, product, financial year, sales in percentage.

Business Overview Ppt PowerPoint Presentation File Graphics Pictures
This is a business overview ppt powerpoint presentation file graphics pictures. This is a six stage process. The stages in this process are highlights, financial highlights, product offering, our team, quarter track record.

Business Overview Ppt PowerPoint Presentation Ideas Background Image
This is a business overview ppt powerpoint presentation ideas background image. This is a six stage process. The stages in this process are highlights, financial highlights, product offering, our team, quarter track record.
Infographic Of Circular Arrows Powerpoint Templates
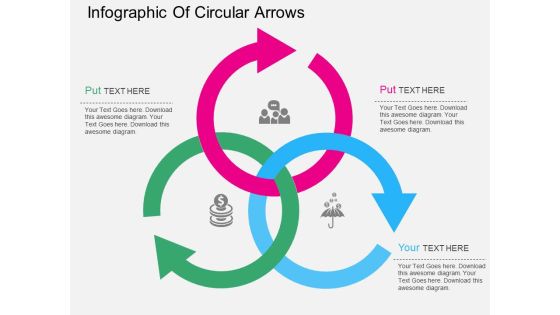
This PPT slide has been designed with intersecting circular arrows. This PowerPoint template is suitable to present financial strategy for business. This professional slide helps in making an instant impact on viewers.
Four Tags With Finance And Growth Icons Powerpoint Template
Our above business diagram has been designed with graphics of four text tags with icons. This business may be used to display financial strategy. Use this PowerPoint template to present your work in a more smart and precise manner.
Four Staged Colored Tags And Finance Icons Powerpoint Template
Our above business diagram has been designed with graphics of four text tags with icons. This business may be used to display financial strategy. Use this PowerPoint template to present your work in a more smart and precise manner.
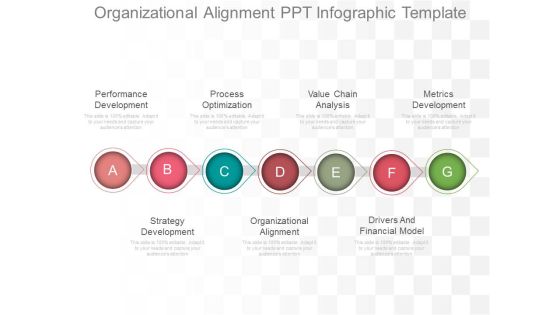
Organizational Alignment Ppt Infographic Template
This is a organizational alignment ppt infographic template. This is a seven stage process. The stages in this process are performance development, process optimization, value chain analysis, metrics development, strategy development, organizational alignment, drivers and financial model.

Distribution Considerations Powerpoint Slide Designs
This is a distribution considerations powerpoint slide designs. This is a five stage process. The stages in this process are distribution considerations, financial strategies, market opportunities, resource identification, near term needs.

Affinity Marketing And Partnership Ppt Slide
This is a affinity marketing and partnership ppt slide. This is a four stage process. The stages in this process are financial communication, affinity marketing and partnership, advertising strategy, management and organization.

Potential Target Acquisitions Diagram Powerpoint Slides
This is a potential target acquisitions diagram powerpoint slides. This is a six stage process. The stages in this process are acquisition rationale, financial resources, strategy, sectors, scale, stage of development, ability.
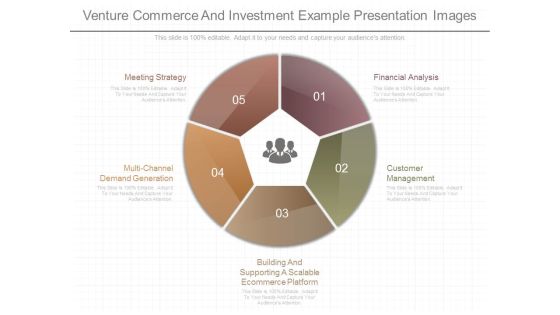
Venture Commerce And Investment Example Presentation Images
This is a venture commerce and investment example presentation images. This is a five stage process. The stages in this process are meeting strategy, multi channel demand generation, building and supporting a scalable ecommerce platform, customer management, financial analysis.

Brand Loyalty Measurement And Management Ppt Slides
This is a brand loyalty measurement and management ppt slides. This is a six stage process. The stages in this process are financial performance, brand value, brand strategy, benefits, profitability, imagery, attributes, attitudes.

Extended Capabilities For Investment Management Ppt Powerpoint Topics
This is a extended capabilities for investment management ppt powerpoint topics. This is a four stage process. The stages in this process are financial counseling, investment management, wealth strategies, client service.
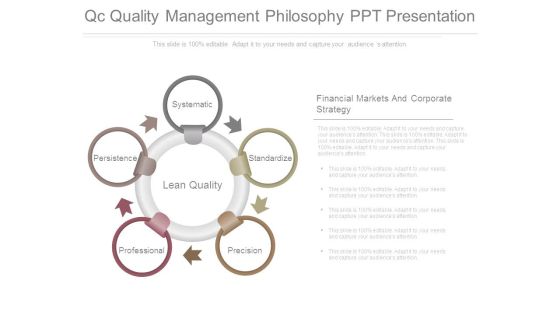
Qc Quality Management Philosophy Ppt Presentation
This is a qc quality management philosophy ppt presentation. This is a five stage process. The stages in this process are systematic, standardize, precision, professional, persistence, lean quality, financial markets and corporate strategy.
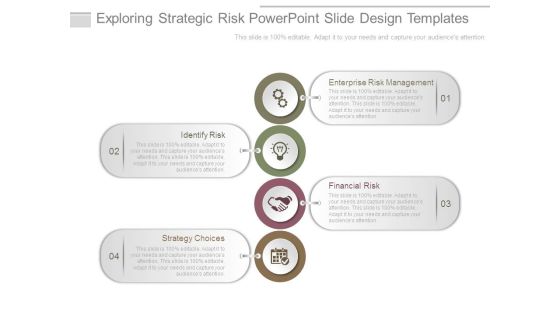
Exploring Strategic Risk Powerpoint Slide Design Templates
This is a exploring strategic risk powerpoint slide design templates. This is a four stage process. The stages in this process are enterprise risk management, identify risk, financial risk, strategy choices.

Analysis And Valuation Of Equity Securities Ppt PowerPoint Presentation Show Infographics
This is a analysis and valuation of equity securities ppt powerpoint presentation show infographics. This is a three stage process. The stages in this process are industry analysis, financial statement analysis, management, marketing, business, strategy.
Stacked Area Clustered Column Chart Ppt PowerPoint Presentation Visual Aids Model
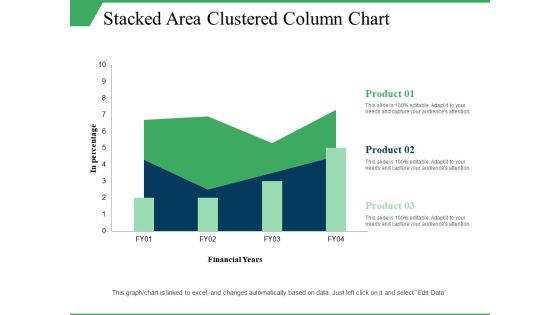
This is a stacked area clustered column chart ppt powerpoint presentation visual aids model. This is a three stage process. The stages in this process are in percentage, product, financial years, growth, column chart.

Business Diagram Mobile Applications Vector Illustration Concept Presentation Template
As mobile have become an indispensible part of our daily lives. This amazing mobile application icons will also add great value to your ideas and presentations in the fields of telecommunications, travelling, banks and financial institutions, e-Learning etc.
Business Diagram Five Staged Comparative Chart For Data Comparison Presentation Template
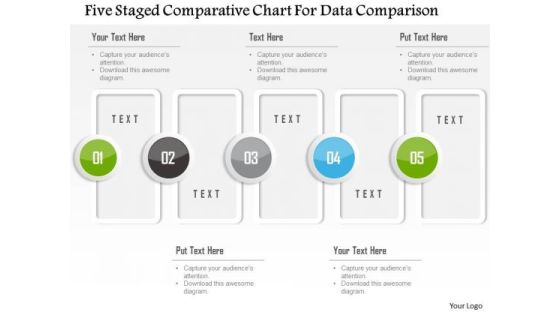
Five staged comparative chart has been used to design this power point template. This PPT contains the concept of data comparison. Use this PPT for your business and finance based data comparison in any financial presentation.
Business Diagram Business Men With Pie Chart And Percentage Presentation Template
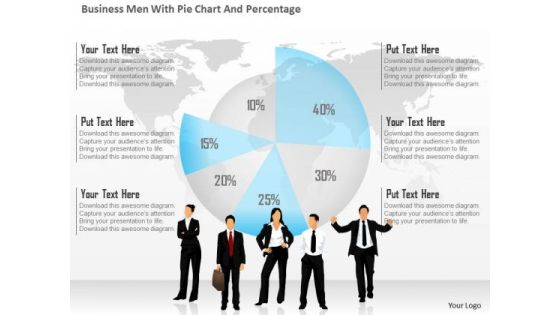
This business diagram has been designed with graphic of business people and pie chart with percentage. This diagram is designed to depict team meeting on financial matter. This diagram offers a way for your audience to visually conceptualize the process.
Business Diagram Four Staged Pie Chart With Percentage Values Presentation Template
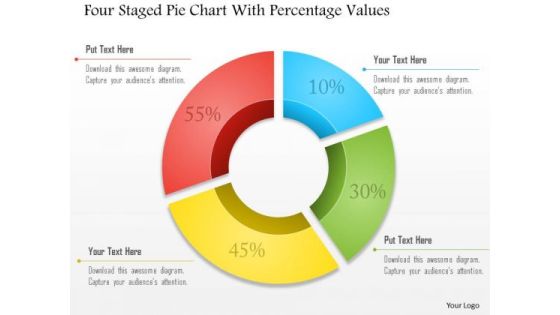
Four staged pie chart and percentage values are used to design this business slide. Download this diagram to make business and financial reports. Use our above diagram to express information in a visual way.
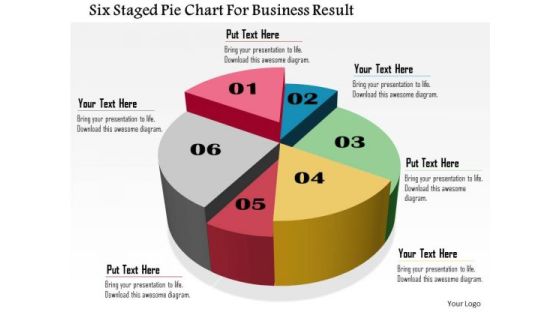
Business Daigram Six Staged Pie Chart For Business Result Presentation Templets
Six staged pie chart is used to design this business slide. Download this diagram to make business and financial reports. Use our above diagram to express information in a visual way.

Business Accounting And Taxation Example Powerpoint Guide
This is a business accounting and taxation example powerpoint guide. This is a three stage process. The stages in this process are accounting and tax, financial management, business adviser.

Vendor Management Guide Template Sample Presentation Ppt
This is a vendor management guide template sample presentation ppt. This is a six stage process. The stages in this process are financial management, relationship management, contract management, performance management, project management framework, vendor management framework.

Real Estate Development Analysis Powerpoint Slides Show
This is a real estate development analysis powerpoint slides show. This is a five stage process. The stages in this process are development analysis, financial and economic analysis, environmental data impact analysis, customer base management analysis, real estate development analysis.

Agile Group For Product Development Strategy Mapping For Product Leadership Formats PDF
This slide focuses on strategy mapping for product leadership which covers four perspectives such as financial, customer, internal, learning and growth. Deliver an awe inspiring pitch with this creative agile group for product development strategy mapping for product leadership formats pdf bundle. Topics like financial perspective, customer perspective, learning and growth perspective can be discussed with this completely editable template. It is available for immediate download depending on the needs and requirements of the user.

Business Exit Strategy For Investors Ppt Slides Outline PDF
This slide predicts the Exit Strategies which can be use by the Investors i.e. Strategic, Financial Buyer, IPO etc. Presenting business exit strategy for investors ppt slides outline pdf to provide visual cues and insights. Share and navigate important information on five stages that need your due attention. This template can be used to pitch topics like strategic, financial buyer, recapitalization, liquidation. In addtion, this PPT design contains high resolution images, graphics, etc, that are easily editable and available for immediate download.
Stock Photo Graph Pie With Map Page PowerPoint Slide
This image slide contains business charts on world map. This image is designed with bar graph and pie chart on world map depicting global economy. Use this image slide to represent financial growth in any business presentation.
Stock Photo 3d Red Color Growth For 2015 And Tablet PowerPoint Slide
This image slide has graphics of financial charts and reports. This contains bar graph and pie chart to present business reports. Build an innovative presentation using this professional image slide.

Current Marketing Situation Ppt Samples Download
This is a current marketing situation ppt samples download. This is a four stage process. The stages in this process are current marketing situation, action programs, opportunity and issue analysis, financial projections.
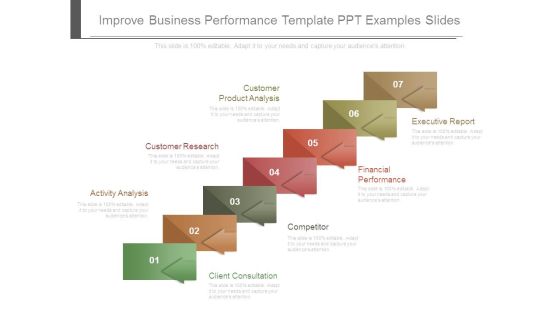
Improve Business Performance Template Ppt Examples Slides
This is a improve business performance template ppt examples slides. This is a seven stage process. The stages in this process are customer product analysis, customer research, activity analysis, executive report, financial performance, competitor, client consultation.

Clustered Column Line Ppt PowerPoint Presentation Icon Good
This is a clustered column line ppt powerpoint presentation icon good. This is a three stage process. The stages in this process are product, financial year, bar graph, business, growth.

Bar Diagram Ppt PowerPoint Presentation Gallery Structure
This is a bar diagram ppt powerpoint presentation gallery structure. This is a three stage process. The stages in this process are financial in years, sales in percentage, bar graph, growth, success.

Bar Diagram Ppt PowerPoint Presentation Pictures Background Image
This is a bar diagram ppt powerpoint presentation pictures background image. This is a three stage process. The stages in this process are financial in years, sales in percentage, bar graph, growth, success.

Area Stacked Ppt PowerPoint Presentation Infographics Shapes
This is a area stacked ppt powerpoint presentation infographics shapes. This is a two stage process. The stages in this process are product, area stacked, sales in percentage, financial year.

Stacked Area Clustered Column Ppt PowerPoint Presentation Summary Slides
This is a stacked area clustered column ppt powerpoint presentation summary slides. This is a three stage process. The stages in this process are product, in percentage, financial year, bar graph.

Exit Strategy For The Investors Ppt Visual Aids Model PDF
This slide Provides the Exit Strategy which includes Acquisition, Financial Buyer and Liquidation.Presenting exit strategy for the investors ppt visual aids model pdf. to provide visual cues and insights. Share and navigate important information on three stages that need your due attention. This template can be used to pitch topics like acquisition, financial buyer, liquidation. In addtion, this PPT design contains high resolution images, graphics, etc, that are easily editable and available for immediate download.

Automated Invoice Process Management Reporting Flow Diagram Slides PDF
This slide showcases invoice process flowchart to help accounts payable team in understanding sequence of activities. It further includes details about purchasing, operations and financial management. Pitch your topic with ease and precision using this Automated Invoice Process Management Reporting Flow Diagram Slides PDF. This layout presents information on Process, Purchasing, Operations, Payables Financial Management. It is also available for immediate download and adjustment. So, changes can be made in the color, design, graphics or any other component to create a unique layout.
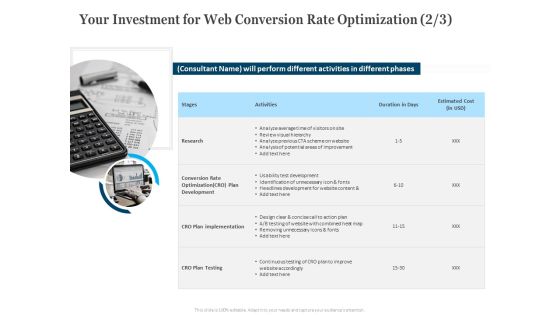
Your Investment For Web Conversion Rate Optimization Activities Ppt Layouts Demonstration PDF
Presenting your investment for web conversion rate optimization activities ppt layouts demonstration pdf to provide visual cues and insights. Share and navigate important information on one stages that need your due attention. This template can be used to pitch topics like research, conversion rate optimization cro, plan development, cro plan implementation, cro plan testing. In addition, this PPT design contains high-resolution images, graphics, etc, that are easily editable and available for immediate download.

Your Investment For Web Conversion Rate Optimization Ppt Inspiration Smartart PDF
Presenting your investment for web conversion rate optimization ppt inspiration smartart pdf to provide visual cues and insights. Share and navigate important information on one stages that need your due attention. This template can be used to pitch topics like research, cro plan testing, cro plan implementation, conversion rate optimization cro, plan development. In addition, this PPT design contains high-resolution images, graphics, etc, that are easily editable and available for immediate download.
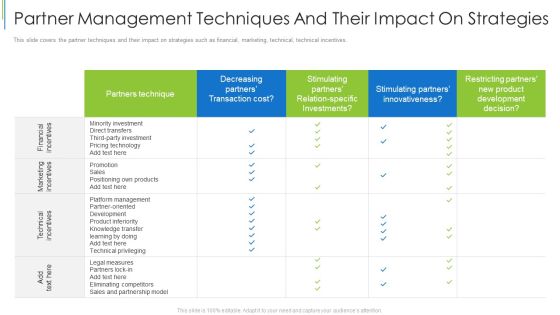
Partner Management Techniques And Their Impact On Strategies Infographics PDF
This slide covers the partner techniques and their impact on strategies such as financial, marketing, technical, technical incentives. Deliver an awe inspiring pitch with this creative partner management techniques and their impact on strategies infographics pdf bundle. Topics like technical incentives, marketing incentives, financial incentives can be discussed with this completely editable template. It is available for immediate download depending on the needs and requirements of the user.

Project Expenditure Management For Operations Managers Ppt Icon Ideas PDF
The following slide highlights the project cost management for operations managers illustrating key headings which includes financial management, project estimation and cost control Presenting Project Expenditure Management For Operations Managers Ppt Icon Ideas PDF to dispense important information. This template comprises three stages. It also presents valuable insights into the topics including Financial Management, Project Estimation, Cost Control. This is a completely customizable PowerPoint theme that can be put to use immediately. So, download it and address the topic impactfully.

Equity Crowd Investing Table Of Contents Ppt File Example Topics PDF
Presenting equity crowd investing table of contents ppt file example topics pdf to provide visual cues and insights. Share and navigate important information on one stage that need your due attention. This template can be used to pitch topics like operational and financial overview, business highlight company, historical events company, framework revenue generation, financial summary company. In addtion, this PPT design contains high-resolution images, graphics, etc, that are easily editable and available for immediate download.

Scorecard For Effective Mergers And Acquisitions Strategy Integration Download PDF
The following slide showcases mergers and acquisition scorecard to ensure accountability. It presents information related to financial, operational and market synergies. Showcasing this set of slides titled Scorecard For Effective Mergers And Acquisitions Strategy Integration Download PDF. The topics addressed in these templates are Financial Synergies, Operational Synergies, Customer Synergies. All the content presented in this PPT design is completely editable. Download it and make adjustments in color, background, font etc. as per your unique business setting.
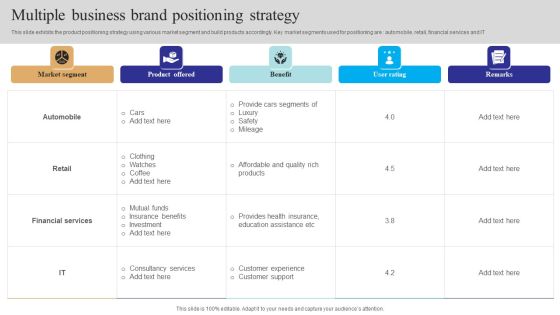
Multiple Business Brand Positioning Strategy Brochure PDF
This slide exhibits the product positioning strategy using various market segment and build products accordingly. Key market segments used for positioning are automobile, retail, financial services and IT. Pitch your topic with ease and precision using this Multiple Business Brand Positioning Strategy Brochure PDF. This layout presents information on Financial Services, Market Segment, Quality. It is also available for immediate download and adjustment. So, changes can be made in the color, design, graphics or any other component to create a unique layout.
