Financial Performance Dashboard
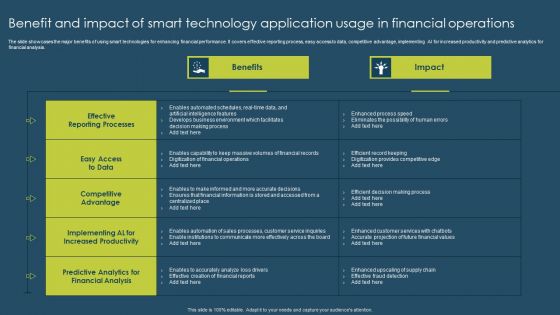
Benefit And Impact Of Smart Technology Application Usage In Financial Operations Summary PDF
The slide showcases the major benefits of using smart technologies for enhancing financial performance. It covers effective reporting process, easy access to data, competitive advantage, implementing AI for increased productivity and predictive analytics for financial analysis. Showcasing this set of slides titled Benefit And Impact Of Smart Technology Application Usage In Financial Operations Summary PDF. The topics addressed in these templates are Benefits, Impact. All the content presented in this PPT design is completely editable. Download it and make adjustments in color, background, font etc. as per your unique business setting.

Four Steps Of Strategic Financial Management Ppt PowerPoint Presentation Infographic Template Graphic Images
Presenting this set of slides with name four steps of strategic financial management ppt powerpoint presentation infographic template graphic images. This is a four stage process. The stages in this process are drive asset performance, optimize capital efficiency, execute sound investment strategy, nurture talen. This is a completely editable PowerPoint presentation and is available for immediate download. Download now and impress your audience.

Investment Fundraising Pitch Deck From Stock Market Competitive Analysis Financial And Operational Data Template PDF
The slide provides the Competitive landscape of the company on the basis of financial data sales and profit and operational data employee count, locations, number of branches, year of existence, interest rate etc. Deliver and pitch your topic in the best possible manner with this investment fundraising pitch deck from stock market competitive analysis financial and operational data template pdf. Use them to share invaluable insights on competitive factor, performing, revenue, interest rate, employee count and impress your audience. This template can be altered and modified as per your expectations. So, grab it now.

Funding Pitch To Raise Funds From PE Competitive Analysis Financial And Operational Data Background PDF
The slide provides the Competitive landscape of the company on the basis of financial data sales and profit and operational data employee count, locations, number of branches, year of existence, interest rate etc. Deliver and pitch your topic in the best possible manner with this funding pitch to raise funds from pe competitive analysis financial and operational data background pdf. Use them to share invaluable insights on competitive factor, performing, revenue, interest rate, employee count and impress your audience. This template can be altered and modified as per your expectations. So, grab it now.
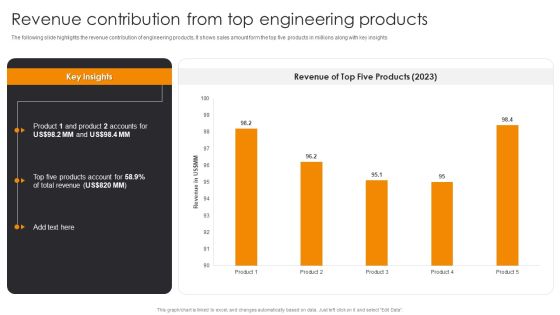
Revenue Contribution From Top Engineering Products Engineering Company Financial Analysis Report Infographics PDF
The following slide highlights the revenue contribution of engineering products, It shows sales amount form the top five products in millions along with key insights. This Revenue Contribution From Top Engineering Products Engineering Company Financial Analysis Report Infographics PDF from Slidegeeks makes it easy to present information on your topic with precision. It provides customization options, so you can make changes to the colors, design, graphics, or any other component to create a unique layout. It is also available for immediate download, so you can begin using it right away. Slidegeeks has done good research to ensure that you have everything you need to make your presentation stand out. Make a name out there for a brilliant performance.
Financial Information Pie Donut Diagram 6 Stages How To Business Plan PowerPoint Slides
We present our financial information pie donut diagram 6 stages how to business plan PowerPoint Slides.Download and present our Competition PowerPoint Templates because Our PowerPoint Templates and Slides will definately Enhance the stature of your presentation. Adorn the beauty of your thoughts with their colourful backgrounds. Present our Marketing PowerPoint Templates because Our PowerPoint Templates and Slides are conceived by a dedicated team. Use them and give form to your wondrous ideas. Download our Process and Flows PowerPoint Templates because Our PowerPoint Templates and Slides will effectively help you save your valuable time. They are readymade to fit into any presentation structure. Present our Circle Charts PowerPoint Templates because Our PowerPoint Templates and Slides will let you meet your Deadlines. Present our Business PowerPoint Templates because They will bring a lot to the table. Their alluring flavours will make your audience salivate.Use these PowerPoint slides for presentations relating to chart, graph, pie, 3d, diagram, graphic, icon, control, business, data, profit, market, sales, display, corporate, concept, render, success, presentation, finance, report, marketing, accounting, management, piece, strategy, money, growth, company, competition, progress, account, sheet, part, information, investment, improvement, banking, index, financial, reflect, results, performance, exchange. The prominent colors used in the PowerPoint template are Blue, Black, Gray.
Structre 7 Staged For Independent Process Ppt Financial Advisor Business Plan PowerPoint Slides
We present our structre 7 staged for independent process ppt financial advisor business plan PowerPoint Slides.Download our Pyramids PowerPoint Templates because Our PowerPoint Templates and Slides will embellish your thoughts. See them provide the desired motivation to your team. Download and present our Process and Flows PowerPoint Templates because Our PowerPoint Templates and Slides are the chords of your song. String them along and provide the lilt to your views. Present our Signs PowerPoint Templates because You should Press the right buttons with our PowerPoint Templates and Slides. They will take your ideas down the perfect channel. Download and present our Layers PowerPoint Templates because Our PowerPoint Templates and Slides offer you the widest possible range of options. Download our Business PowerPoint Templates because you can Break through with our PowerPoint Templates and Slides. Bring down the mental barriers of your audience.Use these PowerPoint slides for presentations relating to pyramidal, pyramid, chart, 3d, vector, leadership, statistics, green, triangle, red, business, hierarchy, ranking, presentation, symbol, template, diagram, data, multilevel, marketing, level, top, abstract, management, graph, illustration, icon, stage, object, strategy, seven, group, growth, text, organization, progress, construction, structure, results, performance. The prominent colors used in the PowerPoint template are Blue, Black, Gray.

KPI Metrics Dashboard Highlighting Organization Revenue Profitability And Liquidity Formats PDF
The following slide outlines key performance indicator KPI dashboard showcasing various financial metrics of the organization. The key metrics are gross revenue, product revenue, service revenue, gross profit, net profit etc. From laying roadmaps to briefing everything in detail, our templates are perfect for you. You can set the stage with your presentation slides. All you have to do is download these easy to edit and customizable templates. KPI Metrics Dashboard Highlighting Organization Revenue Profitability And Liquidity Formats PDF will help you deliver an outstanding performance that everyone would remember and praise you for. Do download this presentation today.
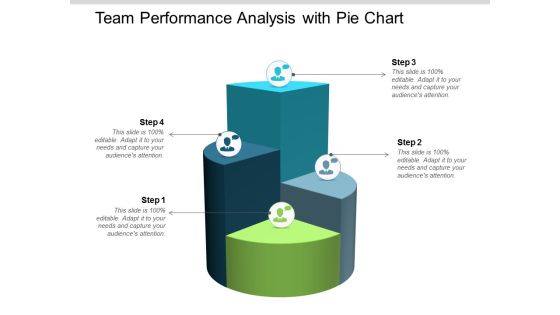
Team Performance Analysis With Pie Chart Ppt Powerpoint Presentation Infographic Template Slideshow
This is a team performance analysis with pie chart ppt powerpoint presentation infographic template slideshow. This is a four stage process. The stages in this process are team performance, member performance, group performance.

Strategical And Tactical Planning Developing Appropriate Key Performance Indicators Brochure PDF
This template covers appropriate key performance areas and KPIs for strategic execution. Performance areas that need to be monitored are financial point of view, customers and market, internal business processes, sustainable learning and growth etc. Deliver an awe inspiring pitch with this creative Strategical And Tactical Planning Developing Appropriate Key Performance Indicators Brochure PDF bundle. Topics like Performance Areas, Key Performance Indicators, Financial can be discussed with this completely editable template. It is available for immediate download depending on the needs and requirements of the user.
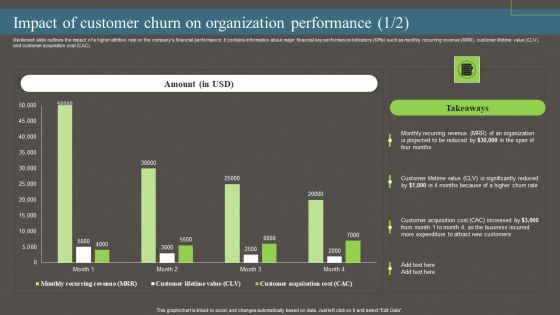
Impact Of Customer Churn On Organization Performance Ppt PowerPoint Presentation File Pictures PDF
Mentioned slide outlines the impact of a higher attrition rate on the companys financial performance. It contains information about major financial key performance indicators KPIs such as monthly recurring revenue MRR, customer lifetime value CLV, and customer acquisition cost CAC. The best PPT templates are a great way to save time, energy, and resources. Slidegeeks have 100 percent editable powerpoint slides making them incredibly versatile. With these quality presentation templates, you can create a captivating and memorable presentation by combining visually appealing slides and effectively communicating your message. Download Impact Of Customer Churn On Organization Performance Ppt PowerPoint Presentation File Pictures PDF from Slidegeeks and deliver a wonderful presentation.

Post Merger Information Technology Service Delivery Amalgamation Customer Performance Measuring Themes PDF
This slide illustrates customer service dashboard covering informational stats about NPS score, growth rate, customer distribution, top customer locations, inbound leads and revenue by type. Deliver an awe inspiring pitch with this creative post merger information technology service delivery amalgamation customer performance measuring themes pdf bundle. Topics like customer performance measuring service dashboard can be discussed with this completely editable template. It is available for immediate download depending on the needs and requirements of the user.
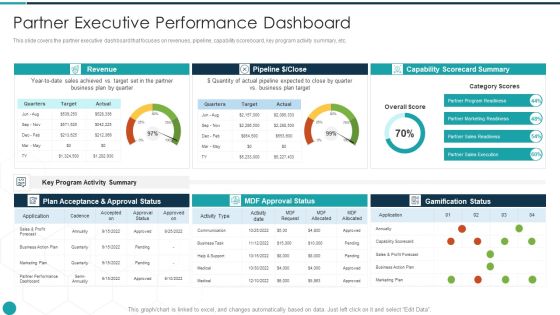
Upgrade Management Of Complex Business Associates Partner Executive Performance Ideas PDF
This slide covers the partner executive dashboard that focuses on revenues, pipeline, capability scoreboard, key program activity summary, etc. Deliver and pitch your topic in the best possible manner with this upgrade management of complex business associates partner executive performance ideas pdf. Use them to share invaluable insights on partner executive performance dashboard and impress your audience. This template can be altered and modified as per your expectations. So, grab it now.
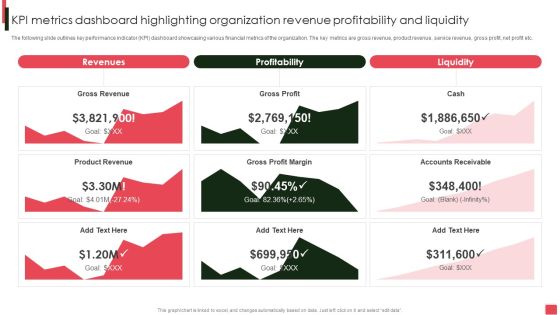
Overview Of Organizational Kpi Metrics Dashboard Highlighting Organization Revenue Brochure PDF
The following slide outlines key performance indicator KPI dashboard showcasing various financial metrics of the organization. The key metrics are gross revenue, product revenue, service revenue, gross profit, net profit etc. If your project calls for a presentation, then Slidegeeks is your go-to partner because we have professionally designed, easy-to-edit templates that are perfect for any presentation. After downloading, you can easily edit Overview Of Organizational Kpi Metrics Dashboard Highlighting Organization Revenue Brochure PDF and make the changes accordingly. You can rearrange slides or fill them with different images. Check out all the handy templates.

Continuous Improvement Methods To Track Performance Ppt PowerPoint Presentation Infographic Template Backgrounds PDF
Presenting this set of slides with name continuous improvement methods to track performance ppt powerpoint presentation infographic template backgrounds pdf. This is a four stage process. The stages in this process are learning and growth perspective, process perspective, customer perspective, financial perspective, improvement methodologies. This is a completely editable PowerPoint presentation and is available for immediate download. Download now and impress your audience.

Metrics To Measure Business Performance Agenda Ppt Layouts Graphic Images PDF
This is a Metrics To Measure Business Performance Agenda Ppt Layouts Graphic Images PDF template with various stages. Focus and dispense information on three stages using this creative set, that comes with editable features. It contains large content boxes to add your information on topics like Key Performance Indicators, Financial Profitability, Customer Satisfaction. You can also showcase facts, figures, and other relevant content using this PPT layout. Grab it now.

Credit Management And Recovery Policies Our Key Performance Indicators For Balance Sheet Rules PDF
The following slide prides and overview of the major financial highlights such as revenue, gross profit net profit and earning per share. Deliver an awe inspiring pitch with this creative Credit Management And Recovery Policies Our Key Performance Indicators For Balance Sheet Rules PDF bundle. Topics like Current Assets, Current Liabilities, Total Liabilities can be discussed with this completely editable template. It is available for immediate download depending on the needs and requirements of the user.
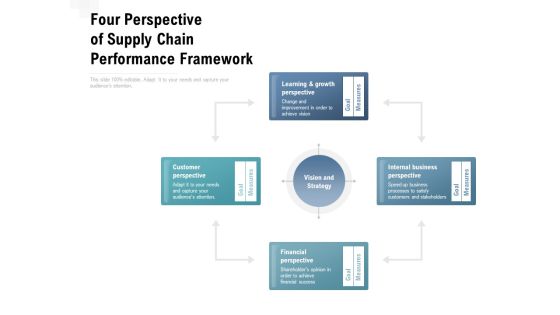
Four Perspective Of Supply Chain Performance Framework Ppt PowerPoint Presentation Infographic Template Visuals
Presenting this set of slides with name four perspective of supply chain performance framework ppt powerpoint presentation infographic template visuals. This is a four stage process. The stages in this process are customer perspective, learning and growth perspective, internal business perspective, financial perspective, goal, measures, vision and strategy. This is a completely editable PowerPoint presentation and is available for immediate download. Download now and impress your audience.
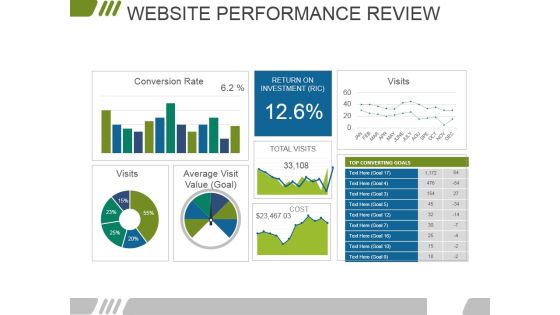
Website Performance Review Template 2 Ppt PowerPoint Presentation Infographics Background Designs
This is a website performance review template 2 ppt powerpoint presentation infographics background designs. This is a three stage process. The stages in this process are conversion rate, visits, return on investment, average visit value.
Firm Working Together M And A Synergy Performance Tracker Ppt Infographics Vector PDF
Presenting this set of slides with name firm working together m and a synergy performance tracker ppt infographics vector pdf. This is a four stage process. The stages in this process are m and a synergy performance tracker. This is a completely editable PowerPoint presentation and is available for immediate download. Download now and impress your audience.
Microeconomics Report With Annual Performance Analysis Icon Ppt PowerPoint Presentation Gallery Tips PDF
Presenting microeconomics report with annual performance analysis icon ppt powerpoint presentation gallery tips pdf to dispense important information. This template comprises three stages. It also presents valuable insights into the topics including microeconomics report with annual performance analysis icon. This is a completely customizable PowerPoint theme that can be put to use immediately. So, download it and address the topic impactfully.

Capital Raising Pitch For Investor Our Investment Performance Ppt PowerPoint Presentation Icon Infographic Template PDF
This slide provides the glimpse about our investment performance which covers distribution to paid in, total value to invested capital and cash returned. Presenting capital raising pitch for investor our investment performance ppt powerpoint presentation icon infographic template pdf to provide visual cues and insights. Share and navigate important information on one stages that need your due attention. This template can be used to pitch topics like our investment performance. In addtion, this PPT design contains high resolution images, graphics, etc, that are easily editable and available for immediate download.

Content Marketing Performance Template 1 Ppt PowerPoint Presentation Infographic Template Brochure
This is a content marketing performance template 1 ppt powerpoint presentation infographic template brochure. This is a eight stage process. The stages in this process are business, finance, marketing, strategy, analysis.

Annual Stakeholder Performance Report Vector Icon Ppt PowerPoint Presentation Gallery Portfolio PDF
Persuade your audience using this annual stakeholder performance report vector icon ppt powerpoint presentation gallery portfolio pdf. This PPT design covers three stages, thus making it a great tool to use. It also caters to a variety of topics including annual stakeholder performance report vector icon. Download this PPT design now to present a convincing pitch that not only emphasizes the topic but also showcases your presentation skills.

Key Performance Indicators For Market Sizing Ppt PowerPoint Presentation Visuals PDF
Presenting key performance indicators for market sizing ppt powerpoint presentation visuals pdf to dispense important information. This template comprises three stages. It also presents valuable insights into the topics including tam, sam, som. This is a completely customizable PowerPoint theme that can be put to use immediately. So, download it and address the topic impactfully.

Company Amalgamation M And A Performance Tracker Ppt Infographics Structure PDF
Presenting this set of slides with name company amalgamation m and a performance tracker ppt infographics structure pdf. This is a five stage process. The stages in this process are value, cash flow, production capacity. This is a completely editable PowerPoint presentation and is available for immediate download. Download now and impress your audience.
Performance Assessment Sales Initiative Report Cost Associated To Sales Department Ppt Icon Brochure PDF
Presenting this set of slides with name performance assessment sales initiative report cost associated to sales department ppt icon brochure pdf. This is a four stage process. The stages in this process are base salaries, commission, software expenses, training expenses. This is a completely editable PowerPoint presentation and is available for immediate download. Download now and impress your audience.

Selling Home Property Real Estate Performance Parameters Ppt Infographics Templates PDF
This is a selling home property real estate performance parameters ppt infographics templates pdf template with various stages. Focus and dispense information on five stages using this creative set, that comes with editable features. It contains large content boxes to add your information on topics like cash flow, operating costs, cash available, budget variances, economic vacancy. You can also showcase facts, figures, and other relevant content using this PPT layout. Grab it now.

Business Synergies M And A Synergy Performance Tracker Ppt Infographic Template Gridlines PDF
This is a business synergies m and a synergy performance tracker ppt infographic template gridlines pdf template with various stages. Focus and dispense information on five stages using this creative set, that comes with editable features. It contains large content boxes to add your information on topics like shareholder value, cash flow, production capacity. You can also showcase facts, figures, and other relevant content using this PPT layout. Grab it now.
M And A Synergy Performance Tracker Mergers And Acquisitions Synergy Ppt Infographics Smartart PDF
Presenting m and a synergy performance tracker mergers and acquisitions synergy ppt infographics smartart pdf to provide visual cues and insights. Share and navigate important information on five stages that need your due attention. This template can be used to pitch topics like value, cash flow, production capacity. In addtion, this PPT design contains high resolution images, graphics, etc, that are easily editable and available for immediate download.

Business To Business Sales Management Playbook B2B Sales Representatives Performance Rules PDF
This slide provides information regarding B2B sales representatives performance tracking dashboard to measure leads by region, revenue breakdown, top performers by leads, revenues, etc.Deliver an awe inspiring pitch with this creative Business To Business Sales Management Playbook B2B Sales Representatives Performance Rules PDF bundle. Topics like Leads Region, Revenue Break, Sales Reps can be discussed with this completely editable template. It is available for immediate download depending on the needs and requirements of the user.
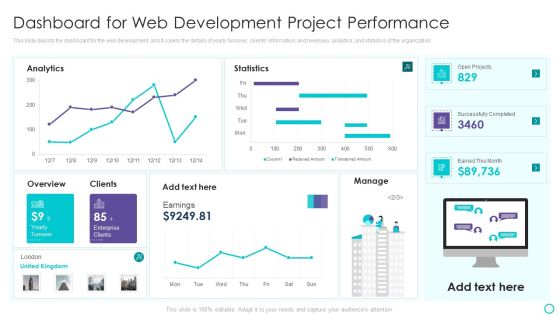
Website Designing And Development Service Web Development Project Performance Inspiration PDF
This slide depicts the dashboard for the web development, and it covers the details of yearly turnover, clients information, and revenues, analytics, and statistics of the organization.Deliver and pitch your topic in the best possible manner with this Website Designing And Development Service Web Development Project Performance Inspiration PDF Use them to share invaluable insights on Overview , Web Development, Project Performance and impress your audience. This template can be altered and modified as per your expectations. So, grab it now.

Debt Retrieval Techniques Our Key Performance Indicators For Balance Sheet Ppt Pictures Gallery PDF
Purpose of the following side is to display the major KPI for the balance sheet as it highlight the key components such as current asset, current liabilities, total assets and total liability of the organization for the financial year 2020 2021 Deliver and pitch your topic in the best possible manner with this debt retrieval techniques our key performance indicators for balance sheet ppt pictures gallery pdf. Use them to share invaluable insights on current assets, current liabilities, total assets, total liabilities and impress your audience. This template can be altered and modified as per your expectations. So, grab it now.

Debt Collection Improvement Plan Our Key Performance Indicators For Balance Sheet Professional PDF
Purpose of the following side is to display the major KPI for the balance sheet as it highlight the key components such as current asset, current liabilities, total assets and total liability of the organization for the financial year 2021 to 2022. Deliver and pitch your topic in the best possible manner with this debt collection improvement plan our key performance indicators for balance sheet professional pdf. Use them to share invaluable insights on current assets, current liabilities, total assets, total liabilities and impress your audience. This template can be altered and modified as per your expectations. So, grab it now.
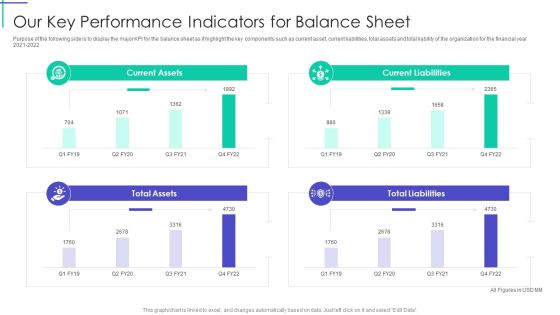
Mortgage Recovery Strategy For Finance Companies Our Key Performance Indicators For Balance Sheet Inspiration PDF
Purpose of the following side is to display the major KPI for the balance sheet as it highlight the key components such as current asset, current liabilities, total assets and total liability of the organization for the financial year 2021 to 2022. Deliver an awe inspiring pitch with this creative Mortgage Recovery Strategy For Finance Companies Our Key Performance Indicators For Balance Sheet Inspiration PDF bundle. Topics like Current Assets, Current Liabilities, Total Liabilities can be discussed with this completely editable template. It is available for immediate download depending on the needs and requirements of the user.

Strategy For Managing Ecommerce Returns Reverse Logistics Dashboard Days Template PDF
Deliver an awe inspiring pitch with this creative strategy for managing ecommerce returns reverse logistics dashboard days template pdf bundle. Topics like global, financial, performance, metric, inventory can be discussed with this completely editable template. It is available for immediate download depending on the needs and requirements of the user.

Technology Innovation Human Resource System HR Key Performance Indicators Ppt Styles Designs Download PDF
The dashboard focus on monitoring the internal hire rate, percentage of eligible candidate, revenue per employee and workforce below job standard. Presenting technology innovation human resource system hr key performance indicators ppt styles designs download pdf to provide visual cues and insights. Share and navigate important information on four stages that need your due attention. This template can be used to pitch topics like revenue per employee, performance standards, internal rate. In addition, this PPT design contains high-resolution images, graphics, etc, that are easily editable and available for immediate download.
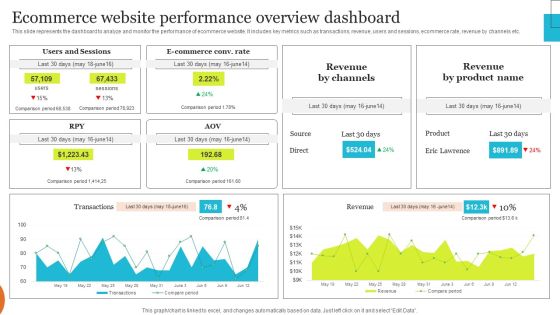
Implementing Effective Ecommerce Managemnet Platform Ecommerce Website Performance Overview Template PDF
This slide represents the dashboard to analyze and monitor the performance of ecommerce website. It includes key metrics such as transactions, revenue, users and sessions, ecommerce rate, revenue by channels etc. Boost your pitch with our creative Implementing Effective Ecommerce Managemnet Platform Ecommerce Website Performance Overview Template PDF. Deliver an awe-inspiring pitch that will mesmerize everyone. Using these presentation templates you will surely catch everyones attention. You can browse the ppts collection on our website. We have researchers who are experts at creating the right content for the templates. So you do not have to invest time in any additional work. Just grab the template now and use them.
Facebook Advertising Campaign Performance Tracking Report Ppt PowerPoint Presentation Diagram Images PDF
This slide represents the dashboard to track and monitor the performance and effectiveness of Facebook advertising campaign. It includes details related to KPIs such as Facebook Ads amount spent, FB ads websites conversion etc. Make sure to capture your audiences attention in your business displays with our gratis customizable Facebook Advertising Campaign Performance Tracking Report Ppt PowerPoint Presentation Diagram Images PDF. These are great for business strategies, office conferences, capital raising or task suggestions. If you desire to acquire more customers for your tech business and ensure they stay satisfied, create your own sales presentation with these plain slides.
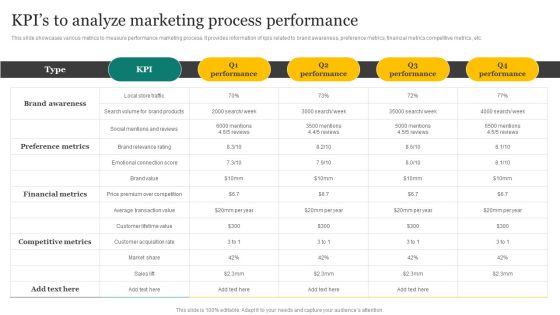
Strategic Promotion Plan Development Stages Kpis To Analyze Marketing Process Performance Guidelines PDF
This slide showcases various metrics to measure performance marketing process. It provides information of kpis related to brand awareness, preference metrics, financial metrics competitive metrics, etc. Get a simple yet stunning designed Strategic Promotion Plan Development Stages Kpis To Analyze Marketing Process Performance Guidelines PDF. It is the best one to establish the tone in your meetings. It is an excellent way to make your presentations highly effective. So, download this PPT today from Slidegeeks and see the positive impacts. Our easy to edit Strategic Promotion Plan Development Stages Kpis To Analyze Marketing Process Performance Guidelines PDF can be your go to option for all upcoming conferences and meetings. So, what are you waiting for Grab this template today.

Comprehensive Guide For Sales And Advertising Processes Kpis To Analyze Marketing Process Performance Professional PDF
This slide showcases various metrics to measure performance marketing process. It provides information of KPIs related to brand awareness, preference metrics, financial metrics competitive metrics, etc. Do you have to make sure that everyone on your team knows about any specific topic I yes, then you should give Comprehensive Guide For Sales And Advertising Processes Kpis To Analyze Marketing Process Performance Professional PDF a try. Our experts have put a lot of knowledge and effort into creating this impeccable Comprehensive Guide For Sales And Advertising Processes Kpis To Analyze Marketing Process Performance Professional PDF. You can use this template for your upcoming presentations, as the slides are perfect to represent even the tiniest detail. You can download these templates from the Slidegeeks website and these are easy to edit. So grab these today
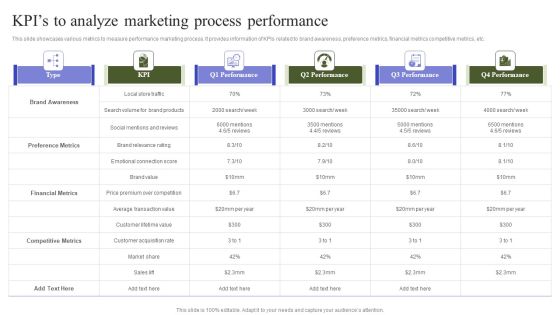
Marketing Mix Strategy Handbook Kpis To Analyze Marketing Process Performance Diagrams PDF
This slide showcases various metrics to measure performance marketing process. It provides information of KPIs related to brand awareness, preference metrics, financial metrics competitive metrics, etc. If you are looking for a format to display your unique thoughts, then the professionally designed Marketing Mix Strategy Handbook Kpis To Analyze Marketing Process Performance Diagrams PDF is the one for you. You can use it as a Google Slides template or a PowerPoint template. Incorporate impressive visuals, symbols, images, and other charts. Modify or reorganize the text boxes as you desire. Experiment with shade schemes and font pairings. Alter, share or cooperate with other people on your work. Download Marketing Mix Strategy Handbook Kpis To Analyze Marketing Process Performance Diagrams PDF and find out how to give a successful presentation. Present a perfect display to your team and make your presentation unforgettable.
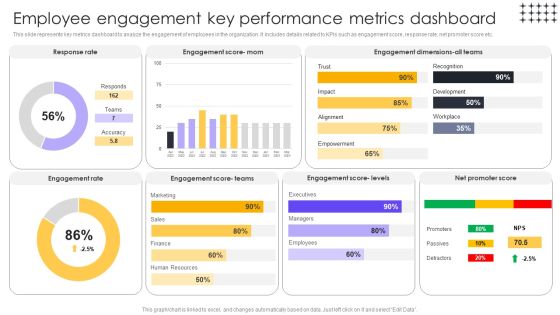
Tools For HR Business Analytics Employee Engagement Key Performance Metrics Brochure PDF
This slide represents key metrics dashboard to analyze the engagement of employees in the organization. It includes details related to KPIs such as engagement score, response rate, net promoter score etc. Make sure to capture your audiences attention in your business displays with our gratis customizable Tools For HR Business Analytics Employee Engagement Key Performance Metrics Brochure PDF. These are great for business strategies, office conferences, capital raising or task suggestions. If you desire to acquire more customers for your tech business and ensure they stay satisfied, create your own sales presentation with these plain slides.

BI Technique For Data Informed Decisions Sap Analytics Cloud Impact On Business Performance Brochure PDF
The purpose of the following slide is to illustrate the impact the SAP Analytics Cloud on business performance in terms of fact based decision making, simplified financial planning, accurate forecasting and collaborative planning. Slidegeeks is here to make your presentations a breeze with BI Technique For Data Informed Decisions Sap Analytics Cloud Impact On Business Performance Brochure PDF With our easy to use and customizable templates, you can focus on delivering your ideas rather than worrying about formatting. With a variety of designs to choose from, you are sure to find one that suits your needs. And with animations and unique photos, illustrations, and fonts, you can make your presentation pop. So whether you are giving a sales pitch or presenting to the board, make sure to check out Slidegeeks first.

Successful Corporate Technique Enhancing Firms Performance Strategic Digital Transformation Infographics PDF
This slide provides information regarding digital transformation initiative roadmap deployed by firm. Initiatives include consolidation of enterprise data centres, workforce optimization, financial transparency enhancement, etc. Whether you have daily or monthly meetings, a brilliant presentation is necessary. Successful Corporate Technique Enhancing Firms Performance Strategic Digital Transformation Infographics PDF can be your best option for delivering a presentation. Represent everything in detail using Successful Corporate Technique Enhancing Firms Performance Strategic Digital Transformation Infographics PDF and make yourself stand out in meetings. The template is versatile and follows a structure that will cater to your requirements. All the templates prepared by Slidegeeks are easy to download and edit. Our research experts have taken care of the corporate themes as well. So, give it a try and see the results.

Deployment Of Process Automation To Increase Organisational Performance Business Management Workflow Themes PDF
This slide presents the graphical representation of business management dashboard via workflow automation software. It includes annual revenue analysis, annual profit analysis, quotation, estimated income, monthly project revenue, upcoming event schedule, etc. Presenting this PowerPoint presentation, titled Deployment Of Process Automation To Increase Organisational Performance Business Management Workflow Themes PDF, with topics curated by our researchers after extensive research. This editable presentation is available for immediate download and provides attractive features when used. Download now and captivate your audience. Presenting this Deployment Of Process Automation To Increase Organisational Performance Business Management Workflow Themes PDF. Our researchers have carefully researched and created these slides with all aspects taken into consideration. This is a completely customizable Deployment Of Process Automation To Increase Organisational Performance Business Management Workflow Themes PDF that is available for immediate downloading. Download now and make an impact on your audience. Highlight the attractive features available with our PPTs.

SMS Marketing Performance Analytics Report Ppt PowerPoint Presentation File Infographics PDF
This slide represents the dashboard to track and monitor the overall performance of SMS marketing campaign and its impact on business sales and revenues. It includes details related to top automated flows, attributed revenue etc. Slidegeeks is here to make your presentations a breeze with SMS Marketing Performance Analytics Report Ppt PowerPoint Presentation File Infographics PDF With our easy to use and customizable templates, you can focus on delivering your ideas rather than worrying about formatting. With a variety of designs to choose from, you are sure to find one that suits your needs. And with animations and unique photos, illustrations, and fonts, you can make your presentation pop. So whether you are giving a sales pitch or presenting to the board, make sure to check out Slidegeeks first.

SMS Marketing Performance Analytics Report Ppt PowerPoint Presentation Diagram Templates PDF
This slide represents the dashboard to track and monitor the overall performance of SMS marketing campaign and its impact on business sales and revenues. It includes details related to top automated flows, attributed revenue etc. Slidegeeks is here to make your presentations a breeze with SMS Marketing Performance Analytics Report Ppt PowerPoint Presentation Diagram Templates PDF With our easy to use and customizable templates, you can focus on delivering your ideas rather than worrying about formatting. With a variety of designs to choose from, you are sure to find one that suits your needs. And with animations and unique photos, illustrations, and fonts, you can make your presentation pop. So whether you are giving a sales pitch or presenting to the board, make sure to check out Slidegeeks first.
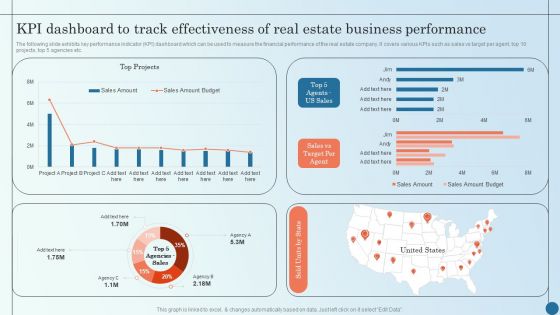
KPI Dashboard To Track Effectiveness Of Real Estate Business Managing Commercial Property Risks Demonstration PDF
The following slide exhibits key performance indicator KPI dashboard which can be used to measure the financial performance of the real estate company. It covers various KPIs such as sales vs target per agent, top 10 projects, top 5 agencies etc.Deliver an awe inspiring pitch with this creative KPI Dashboard To Track Effectiveness Of Real Estate Business Managing Commercial Property Risks Demonstration PDF bundle. Topics like Kpi Dashboard, Track Effectiveness, Estate Business can be discussed with this completely editable template. It is available for immediate download depending on the needs and requirements of the user.

Successful Risk Administration KPI Dashboard To Track Effectiveness Of Real Estate Business Template PDF
The following slide exhibits key performance indicator KPI dashboard which can be used to measure the financial performance of the real estate company. It covers various kpis such as sales vs target per agent, top 10 projects, top 5 agencies etc. If your project calls for a presentation, then Slidegeeks is your go-to partner because we have professionally designed, easy-to-edit templates that are perfect for any presentation. After downloading, you can easily edit Successful Risk Administration KPI Dashboard To Track Effectiveness Of Real Estate Business Template PDF and make the changes accordingly. You can rearrange slides or fill them with different images. Check out all the handy templates.

Logistics Dashboard For XYZ Logistic Company Orders Slides PDF
The slide shows the logistic measurement dashboard for measuring order status, total orders, overdue shipments, global financial performance etc.Deliver and pitch your topic in the best possible manner with this logistics dashboard for xyz logistic company orders slides pdf. Use them to share invaluable insights on global financial performance, overdue shipments, late vendor shipments and impress your audience. This template can be altered and modified as per your expectations. So, grab it now.

Quarterly Revenue And Loss Statement Comparison Dashboard Portrait PDF
This slide showcases a comprehensive P and L report for representing the financial outcomes. It also helps to take financial performance management decisions. It includes financial analysis KPIs such as p and l statements, p and l structure dynamics, sales or margin quality performance analysis, DUPONT ratio, etc. Showcasing this set of slides titled Quarterly Revenue And Loss Statement Comparison Dashboard Portrait PDF. The topics addressed in these templates are Profitability, Debt Coverage Ratios, Margin Quality Performa. All the content presented in this PPT design is completely editable. Download it and make adjustments in color, background, font etc. as per your unique business setting.
International Economic Performance Metrics And Kpis Ppt PowerPoint Presentation Gallery Icon PDF
Presenting this set of slides with name international economic performance metrics and kpis ppt powerpoint presentation gallery icon pdf. The topics discussed in these slides are global, financial, performance. This is a completely editable PowerPoint presentation and is available for immediate download. Download now and impress your audience.

Key Performance Indicators For SCM Ppt PowerPoint Presentation File Graphic Tips PDF
Presenting this set of slides with name key performance indicators for scm ppt powerpoint presentation file graphic tips pdf. The topics discussed in these slides are global, financial, perform. This is a completely editable PowerPoint presentation and is available for immediate download. Download now and impress your audience.

Defining The Most Commonly Used Performance Monitoring Metrics For Supply Chain Microsoft PDF
Purpose of this slide is to illustrate key performance metrics used by supply chain enterprises to track overall business performance. KPIs covered are of operational, financial, strategic and relationship.Crafting an eye-catching presentation has never been more straightforward. Let your presentation shine with this tasteful yet straightforward Defining The Most Commonly Used Performance Monitoring Metrics For Supply Chain Microsoft PDF template. It offers a minimalistic and classy look that is great for making a statement. The colors have been employed intelligently to add a bit of playfulness while still remaining professional. Construct the ideal Defining The Most Commonly Used Performance Monitoring Metrics For Supply Chain Microsoft PDF that effortlessly grabs the attention of your audience Begin now and be certain to wow your customers
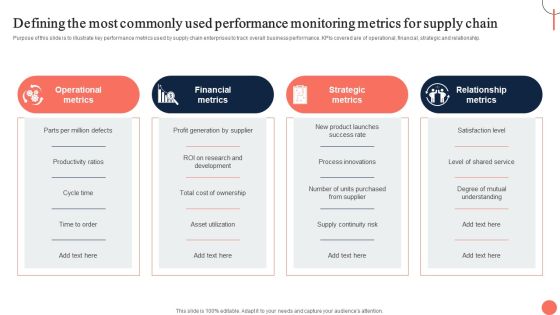
Strategies For Dynamic Supply Chain Agility Defining The Most Commonly Used Performance Demonstration PDF
Purpose of this slide is to illustrate key performance metrics used by supply chain enterprises to track overall business performance. KPIs covered are of operational, financial, strategic and relationship. Create an editable Strategies For Dynamic Supply Chain Agility Defining The Most Commonly Used Performance Demonstration PDF that communicates your idea and engages your audience. Whether youre presenting a business or an educational presentation, pre designed presentation templates help save time. Strategies For Dynamic Supply Chain Agility Defining The Most Commonly Used Performance Demonstration PDF is highly customizable and very easy to edit, covering many different styles from creative to business presentations. Slidegeeks has creative team members who have crafted amazing templates. So, go and get them without any delay.
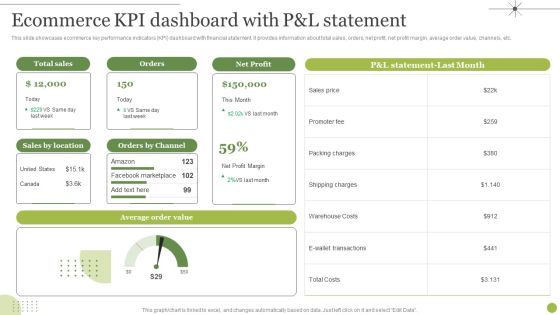
Managing E Commerce Business Accounting Ecommerce KPI Dashboard With P And L Statement Diagrams PDF
This slide showcases ecommerce key performance indicators KPI dashboard with financial statement. It provides information about total sales, orders, net profit, net profit margin, average order value, channels, etc. Present like a pro with Managing E Commerce Business Accounting Ecommerce KPI Dashboard With P And L Statement Diagrams PDF Create beautiful presentations together with your team, using our easy to use presentation slides. Share your ideas in real time and make changes on the fly by downloading our templates. So whether you are in the office, on the go, or in a remote location, you can stay in sync with your team and present your ideas with confidence. With Slidegeeks presentation got a whole lot easier. Grab these presentations today.

Economic Performance Analysis Report Template Ppt PowerPoint Presentation Infographic Template Portrait
Presenting this set of slides with name economic performance analysis report template ppt powerpoint presentation infographic template portrait. The topics discussed in these slides are annual performance review, process, business performance. This is a completely editable PowerPoint presentation and is available for immediate download. Download now and impress your audience.

Key Performance Indicators Of Geo Energy Company With Future Targets Ideas PDF
The slide shows the key Performance Indicator KPIs which will help the company to track the success rate of implemented strategies. Some of the KPIs are Revenue , Return on Investment, Performance Ratio , Wind Energy Levels , Plant Availability, Profitability etc.Deliver an awe inspiring pitch with this creative key performance indicators of geo energy company with future targets ideas pdf bundle. Topics like return on investment, performance ratio, key performance indicators can be discussed with this completely editable template. It is available for immediate download depending on the needs and requirements of the user.
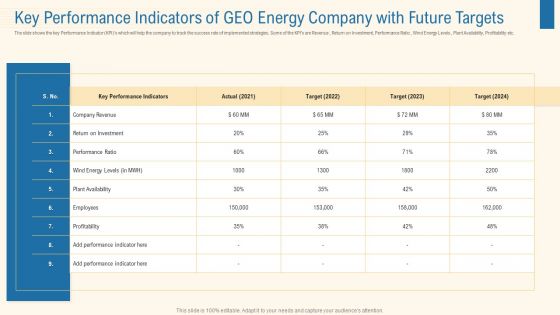
Key Performance Indicators Of Geo Energy Company With Future Targets Pictures PDF
The slide shows the key Performance Indicator KPIs which will help the company to track the success rate of implemented strategies. Some of the KPIs are Revenue , Return on Investment, Performance Ratio , Wind Energy Levels , Plant Availability, Profitability etc. Deliver an awe inspiring pitch with this creative key performance indicators of geo energy company with future targets pictures pdf bundle. Topics like company revenue, return on investment, performance ratio, plant availability, employees, profitability can be discussed with this completely editable template. It is available for immediate download depending on the needs and requirements of the user.

 Home
Home