AI PPT Maker
Templates
PPT Bundles
Design Services
Business PPTs
Business Plan
Management
Strategy
Introduction PPT
Roadmap
Self Introduction
Timelines
Process
Marketing
Agenda
Technology
Medical
Startup Business Plan
Cyber Security
Dashboards
SWOT
Proposals
Education
Pitch Deck
Digital Marketing
KPIs
Project Management
Product Management
Artificial Intelligence
Target Market
Communication
Supply Chain
Google Slides
Research Services
 One Pagers
All Categories
-
Home
- Customer Favorites
- Financial Performance Dashboard
Financial Performance Dashboard
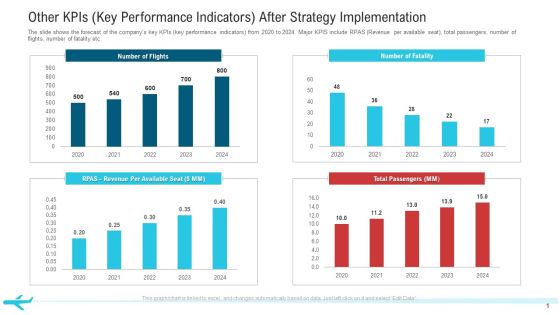
Other Kpis Key Performance Indicators After Strategy Implementation Professional PDF
The slide shows the forecast of the companys key KPIs key performance indicators from 2020 to 2024. Major KPIS include RPAS Revenue per available seat, total passengers, number of flights, number of fatality etc.Deliver and pitch your topic in the best possible manner with this other KPIs key performance indicators after strategy implementation professional pdf. Use them to share invaluable insights on total passengers, number of flights, 2020 to 2024 and impress your audience. This template can be altered and modified as per your expectations. So, grab it now.

Identifying Key Metrics For Evaluating Performance Ppt Styles Files PDF
Following slide focusses on highlighting key metrics for evaluating performance of newly launched subscription revenue model. This slide covers detailed description and calculation approach for evaluating each metrics. Deliver and pitch your topic in the best possible manner with this identifying key metrics for evaluating performance ppt styles files pdf. Use them to share invaluable insights on revenue, growth, goals, potential, customer and impress your audience. This template can be altered and modified as per your expectations. So, grab it now.

Competitive Analysis By Key Performance Indicators 2020 Inspiration PDF
The slide shows the comparison of major KPIs key performance indicators of the company with its competitors. Major KPIs include Revenue, net profit, number of flights, number of passengers, number of pilots etc. Deliver and pitch your topic in the best possible manner with this competitive analysis by key performance indicators 2020 inspiration pdf. Use them to share invaluable insights on comparison, revenue, net profit, number of flights, number of passengers and impress your audience. This template can be altered and modified as per your expectations. So, grab it now.

Before And After Product Performance Analytics Infographics PDF
This slide covers product performance prior and after using LinkedIn marketing or ad campaign tool for promotion. It includes gaps analysis based on annual product sales, website visitors, revenue and lead generation rates. Presenting this PowerPoint presentation, titled Before And After Product Performance Analytics Infographics PDF, with topics curated by our researchers after extensive research. This editable presentation is available for immediate download and provides attractive features when used. Download now and captivate your audience. Presenting this Before And After Product Performance Analytics Infographics PDF. Our researchers have carefully researched and created these slides with all aspects taken into consideration. This is a completely customizable Before And After Product Performance Analytics Infographics PDF that is available for immediate downloading. Download now and make an impact on your audience. Highlight the attractive features available with our PPTs.
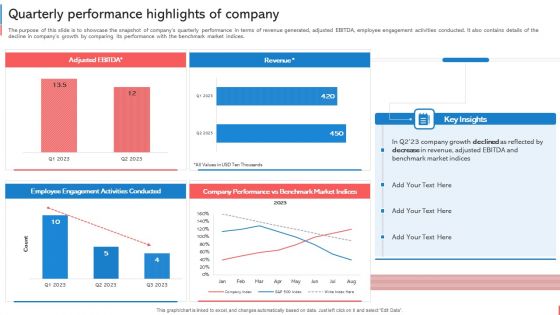
Company Budget Analysis Quarterly Performance Highlights Of Company Ideas PDF
The purpose of this slide is to showcase the snapshot of companys quarterly performance in terms of revenue generated, adjusted EBITDA, employee engagement activities conducted. It also contains details of the decline in companys growth by comparing its performance with the benchmark market indices. Formulating a presentation can take up a lot of effort and time, so the content and message should always be the primary focus. The visuals of the PowerPoint can enhance the presenters message, so our Company Budget Analysis Quarterly Performance Highlights Of Company Ideas PDF was created to help save time. Instead of worrying about the design, the presenter can concentrate on the message while our designers work on creating the ideal templates for whatever situation is needed. Slidegeeks has experts for everything from amazing designs to valuable content, we have put everything into Company Budget Analysis Quarterly Performance Highlights Of Company Ideas PDF.
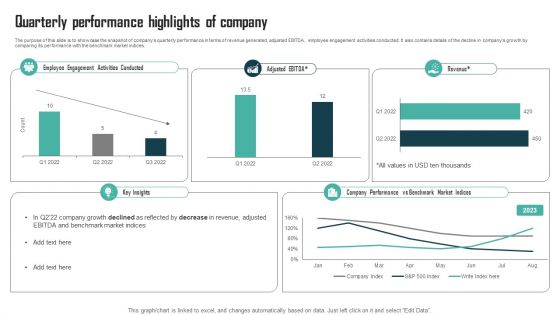
Expenses Management Plan Quarterly Performance Highlights Of Company Download PDF
The purpose of this slide is to showcase the snapshot of companys quarterly performance in terms of revenue generated, adjusted EBITDA, employee engagement activities conducted. It also contains details of the decline in companys growth by comparing its performance with the benchmark market indices. Crafting an eye-catching presentation has never been more straightforward. Let your presentation shine with this tasteful yet straightforward Expenses Management Plan Quarterly Performance Highlights Of Company Download PDF template. It offers a minimalistic and classy look that is great for making a statement. The colors have been employed intelligently to add a bit of playfulness while still remaining professional. Construct the ideal Expenses Management Plan Quarterly Performance Highlights Of Company Download PDF that effortlessly grabs the attention of your audience Begin now and be certain to wow your customers.
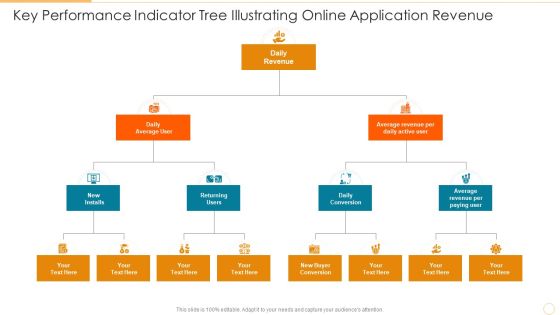
Key Performance Indicator Tree Illustrating Online Application Revenue Download PDF
Presenting key performance indicator tree illustrating online application revenue download pdf to dispense important information. This template comprises three stages. It also presents valuable insights into the topics including daily conversion, returning users, daily revenue. This is a completely customizable PowerPoint theme that can be put to use immediately. So, download it and address the topic impactfully.

Analytical Incrementalism Business Performance Measurement Metrics Sales Infographics PDF
The purpose of this slide is to provide a glimpse about the business marketing performance measurement metrics after logical incrementalism approach. Deliver an awe-inspiring pitch with this creative analytical incrementalism business performance measurement metrics sales infographics pdf bundle. Topics like gross profit margin, revenue, quick ratio can be discussed with this completely editable template. It is available for immediate download depending on the needs and requirements of the user.
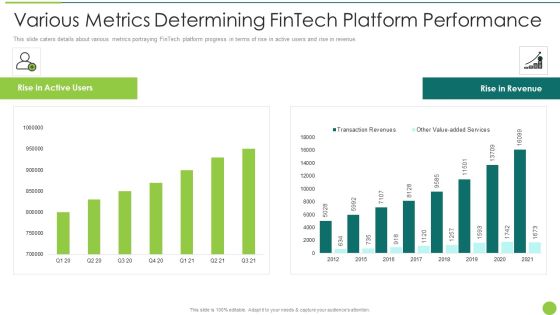
Various Metrics Determining Fintech Platform Performance Infographics PDF
This slide caters details about various metrics portraying FinTech platform progress in terms of rise in active users and rise in revenue. Deliver and pitch your topic in the best possible manner with this various metrics determining fintech platform performance infographics pdf. Use them to share invaluable insights on various metrics determining fintech platform performance and impress your audience. This template can be altered and modified as per your expectations. So, grab it now.

Software Tool Leading And Lagging Performance Tracking Indicators Diagrams PDF
This slide showcase the lagging and leading performance indicators after the implementation of a software tool. It includes customer integration data, email campaign revenue generated,session time, email deliverability, email click rates etc. Persuade your audience using this Software Tool Leading And Lagging Performance Tracking Indicators Diagrams PDF. This PPT design covers Two stages, thus making it a great tool to use. It also caters to a variety of topics including Software Tool Leading, Lagging Performance, Tracking Indicators. Download this PPT design now to present a convincing pitch that not only emphasizes the topic but also showcases your presentation skills.

Performance Indicators For Effective Traditional Marketing Guidelines PDF
This slide showcases key metrics of traditional media for marketers. Major indicators covered are cost per lead, customer retention, marketing ROI. Sales revenue, customer lifetime value and website traffic. Create an editable Performance Indicators For Effective Traditional Marketing Guidelines PDF that communicates your idea and engages your audience. Whether you are presenting a business or an educational presentation, pre-designed presentation templates help save time. Performance Indicators For Effective Traditional Marketing Guidelines PDF is highly customizable and very easy to edit, covering many different styles from creative to business presentations. Slidegeeks has creative team members who have crafted amazing templates. So, go and get them without any delay.
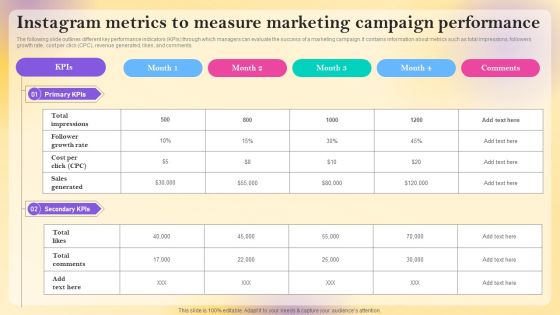
Instagram Metrics To Measure Marketing Campaign Performance Formats PDF
The following slide outlines different key performance indicators KPIs through which managers can evaluate the success of a marketing campaign. It contains information about metrics such as total impressions, followers growth rate, cost per click CPC, revenue generated, likes, and comments. Explore a selection of the finest Instagram Metrics To Measure Marketing Campaign Performance Formats PDF here. With a plethora of professionally designed and pre made slide templates, you can quickly and easily find the right one for your upcoming presentation. You can use our Instagram Metrics To Measure Marketing Campaign Performance Formats PDF to effectively convey your message to a wider audience. Slidegeeks has done a lot of research before preparing these presentation templates. The content can be personalized and the slides are highly editable. Grab templates today from Slidegeeks.

Advertising Kpis To Measure Holistic Performance Structure PDF
This slide highlights major marketing key performance indicators aimed at effectively analysing strategies to increase traffic, leads and sales. It covers revenue attribution, customer acquisition cost and lifetime value with traffic to lead ratio and lead to customer ratio. Persuade your audience using this Advertising Kpis To Measure Holistic Performance Structure PDF. This PPT design covers five stages, thus making it a great tool to use. It also caters to a variety of topics including Revenue Attribution, Customer Acquisition Cost, Customer Lifetime Value. Download this PPT design now to present a convincing pitch that not only emphasizes the topic but also showcases your presentation skills.
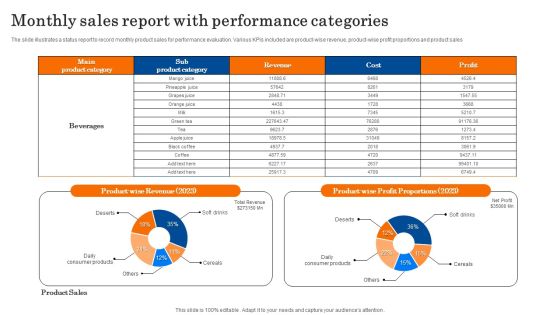
Monthly Sales Report With Performance Categories Diagrams PDF
The slide illustrates a status report to record monthly product sales for performance evaluation. Various KPIs included are product wise revenue, product-wise profit proportions and product sales. Showcasing this set of slides titled Monthly Sales Report With Performance Categories Diagrams PDF. The topics addressed in these templates are Revenue, Profit Proportions, Product Sales. All the content presented in this PPT design is completely editable. Download it and make adjustments in color, background, font etc. as per your unique business setting.

Key Performance Indicators For Ecommerce Diagram Ppt Design
This is a key performance indicators for ecommerce diagram ppt design. This is a eight stage process. The stages in this process are cost strategies, price strategies, market share strategies, market size strategies, conversion optimization, social sentiment, economic factors, brand awareness.
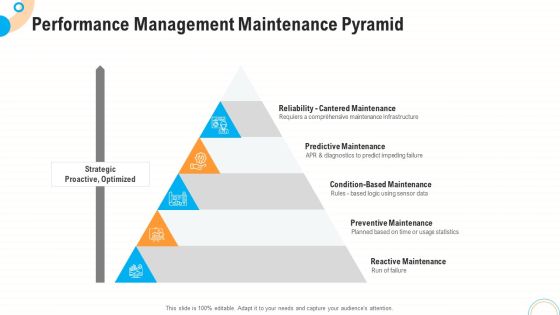
Fiscal And Operational Assessment Performance Management Maintenance Pyramid Infographics PDF
Presenting fiscal and operational assessment performance management maintenance pyramid infographics pdf to provide visual cues and insights. Share and navigate important information on five stages that need your due attention. This template can be used to pitch topics like predictive maintenance, condition based maintenance, preventive maintenance. In addtion, this PPT design contains high resolution images, graphics, etc, that are easily editable and available for immediate download.

Key Metrics For Understanding Product Performance Clipart PDF
The following slide displays key metrics that can be used to understand the product performance, these metrics can be Revenues Generated by the product, the total units sold of the product and the total purchase value of the product. This is a Key Metrics For Understanding Product Performance Clipart PDF template with various stages. Focus and dispense information on three stages using this creative set, that comes with editable features. It contains large content boxes to add your information on topics like Revenues Generated, Unit Sold, Key Metrics, Purchase Value. You can also showcase facts, figures, and other relevant content using this PPT layout. Grab it now.

Quarterly Sales Revenue Generation Performance Chart Icon Slides PDF
This graph or chart is linked to excel, and changes automatically based on data. Just left click on it and select edit data. Persuade your audience using this Quarterly Sales Revenue Generation Performance Chart Icon Slides PDF. This PPT design covers four stages, thus making it a great tool to use. It also caters to a variety of topics including Quarterly Sales Revenue, Generation Performance, Chart Icon. Download this PPT design now to present a convincing pitch that not only emphasizes the topic but also showcases your presentation skills.

Competitive Analysis Of Sales And Revenue Performance Elements PDF
The following slide showcases the competitive assessment of organizations sales and revenues to evaluate the gap and compare metrics. It includes pie chart representing performance along with key insights etc. Take your projects to the next level with our ultimate collection of Competitive Analysis Of Sales And Revenue Performance Elements PDF. Slidegeeks has designed a range of layouts that are perfect for representing task or activity duration, keeping track of all your deadlines at a glance. Tailor these designs to your exact needs and give them a truly corporate look with your own brand colors they will make your projects stand out from the rest.

Competitive Analysis Of Sales And Revenue Performance Designs PDF
The following slide showcases the competitive assessment of organizations sales and revenues to evaluate the gap and compare metrics. It includes pie chart representing performance along with key insights etc. Take your projects to the next level with our ultimate collection of Competitive Analysis Of Sales And Revenue Performance Designs PDF. Slidegeeks has designed a range of layouts that are perfect for representing task or activity duration, keeping track of all your deadlines at a glance. Tailor these designs to your exact needs and give them a truly corporate look with your own brand colors they will make your projects stand out from the rest.

Competitive Analysis Of Sales And Revenue Performance Information PDF
The following slide showcases the competitive assessment of organizations sales and revenues to evaluate the gap and compare metrics. It includes pie chart representing performance along with key insights etc. Slidegeeks is one of the best resources for PowerPoint templates. You can download easily and regulate Competitive Analysis Of Sales And Revenue Performance Information PDF for your personal presentations from our wonderful collection. A few clicks is all it takes to discover and get the most relevant and appropriate templates. Use our Templates to add a unique zing and appeal to your presentation and meetings. All the slides are easy to edit and you can use them even for advertisement purposes.
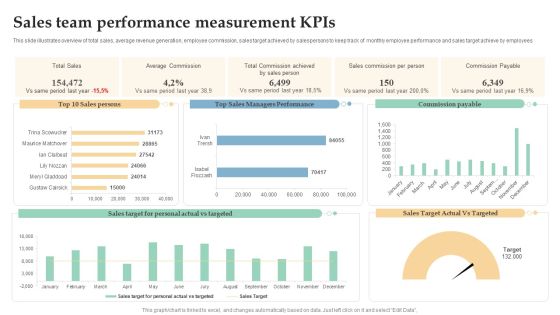
Sales Team Performance Measurement Kpis Ppt Professional Templates PDF
This slide illustrates overview of total sales, average revenue generation, employee commission, sales target achieved by salespersons to keep track of monthly employee performance and sales target achieve by employees. Showcasing this set of slides titled Sales Team Performance Measurement Kpis Ppt Professional Templates PDF. The topics addressed in these templates are Total Sales, Average Commission, Sales Commission, Per Person. All the content presented in this PPT design is completely editable. Download it and make adjustments in color, background, font etc. as per your unique business setting.

Key Performance Indicators For Smarketing Ppt Icon Graphic Images PDF
This slide shows various KPIs which can be used to measure marketing and sales alignment. These are overall revenue, sales cycle length, marketing qualified leads, etc. Presenting Key Performance Indicators For Smarketing Ppt Icon Graphic Images PDF to dispense important information. This template comprises one stages. It also presents valuable insights into the topics including KPIs, Overall Revenue, Sales Cycle Length. This is a completely customizable PowerPoint theme that can be put to use immediately. So, download it and address the topic impactfully.

Social Network Promotion Campaign Performance Report Demonstration PDF
The purpose of this slide is to highlight the digital marketing campaigning performance report to track information in real-time like new leads acquired, total leads, and revenue on monthly basis. The leads generated through various platforms are Twitter, Facebook, LinkedIn, etc. Pitch your topic with ease and precision using this Social Network Promotion Campaign Performance Report Demonstration PDF. This layout presents information on Sales Ready Leads, New Leads, New Revenue. It is also available for immediate download and adjustment. So, changes can be made in the color, design, graphics or any other component to create a unique layout.

Monthly Company Performance Analysisp And L Kpis Brochure PDF
Deliver and pitch your topic in the best possible manner with this monthly company performance analysisp and l kpis brochure pdf. Use them to share invaluable insights on revenue, net increase in cash and impress your audience. This template can be altered and modified as per your expectations. So, grab it now.

Nestle Performance Management Report Quotes Ppt Infographic Template Gallery PDF
Make sure to capture your audiences attention in your business displays with our gratis customizable Nestle Performance Management Report Quotes Ppt Infographic Template Gallery PDF. These are great for business strategies, office conferences, capital raising or task suggestions. If you desire to acquire more customers for your tech business and ensure they stay satisfied, create your own sales presentation with these plain slides.
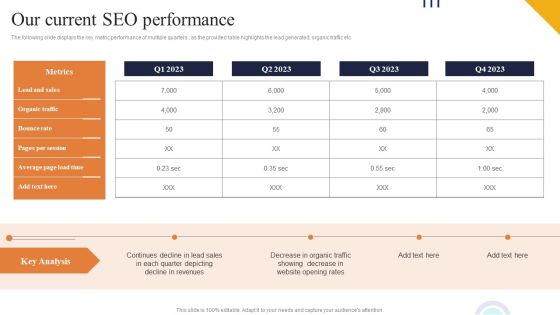
Our Current SEO Performance Ppt PowerPoint Presentation File Files PDF
The following slide displays the key metric performance of multiple quarters , as the provided table highlights the lead generated, organic traffic etc Make sure to capture your audiences attention in your business displays with our gratis customizable Our Current SEO Performance Ppt PowerPoint Presentation File Files PDF. These are great for business strategies, office conferences, capital raising or task suggestions. If you desire to acquire more customers for your tech business and ensure they stay satisfied, create your own sales presentation with these plain slides.

Online Website Performance Analysis For Business Planning Slides PDF
This slide displays statistics to analyze performance of ecommerce business to plan appropriate growth strategies for the company. It includes KPIs such as total sales, orders, customers, refunded amount, etc. Pitch your topic with ease and precision using this Online Website Performance Analysis For Business Planning Slides PDF. This layout presents information on Revenue, Customer Rate, Target. It is also available for immediate download and adjustment. So, changes can be made in the color, design, graphics or any other component to create a unique layout.

Web Content Performance Evaluation By Management Strategy Pictures PDF
This slide covers performance evaluation of website CMS to increase brand awareness and customer engagement. It includes elements such as goals, strategies used, software along with KPIs such as website traffic, page views, blog comments, renewal rates, blog forwards etc. Pitch your topic with ease and precision using this Web Content Performance Evaluation By Management Strategy Pictures PDF. This layout presents information on Customer Engagement, Lead Generation, Revenue Sales. It is also available for immediate download and adjustment. So, changes can be made in the color, design, graphics or any other component to create a unique layout.

Key Performance Indicators For Advertising And Promotion Plan Background PDF
This slide shows KPIs for measuring effectiveness of advertising and promotion plan for increasing overall revenue. It include KPIs such as conversion rate, cost per lead and social media management, etc. Persuade your audience using this Key Performance Indicators For Advertising And Promotion Plan Background PDF. This PPT design covers five stages, thus making it a great tool to use. It also caters to a variety of topics including Conversion Rate, Cost Per Lead, Social Media Management. Download this PPT design now to present a convincing pitch that not only emphasizes the topic but also showcases your presentation skills.
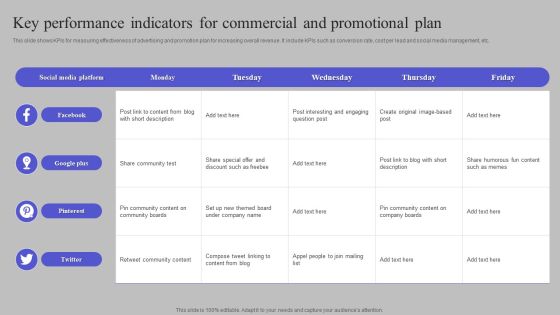
Key Performance Indicators For Commercial And Promotional Plan Information PDF
This slide shows KPIs for measuring effectiveness of advertising and promotion plan for increasing overall revenue. It include KPIs such as conversion rate, cost per lead and social media management, etc. Showcasing this set of slides titled Key Performance Indicators For Commercial And Promotional Plan Information PDF. The topics addressed in these templates are Facebook, Google Plus, Pinterest. All the content presented in this PPT design is completely editable. Download it and make adjustments in color, background, font etc. as per your unique business setting.
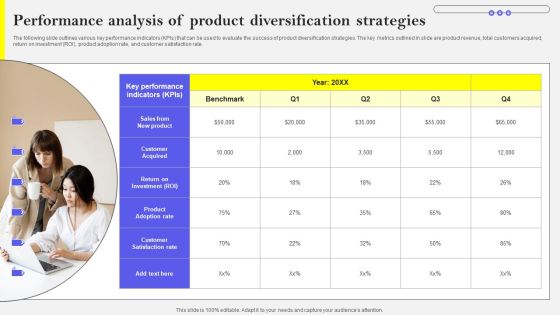
Performance Analysis Of Product Diversification Strategies Summary PDF
The following slide outlines various key performance indicators KPIs that can be used to evaluate the success of product diversification strategies. The key metrics outlined in slide are product revenue, total customers acquired, return on investment ROI, product adoption rate, and customer satisfaction rate. Slidegeeks is one of the best resources for PowerPoint templates. You can download easily and regulate Performance Analysis Of Product Diversification Strategies Summary PDF for your personal presentations from our wonderful collection. A few clicks is all it takes to discover and get the most relevant and appropriate templates. Use our Templates to add a unique zing and appeal to your presentation and meetings. All the slides are easy to edit and you can use them even for advertisement purposes.
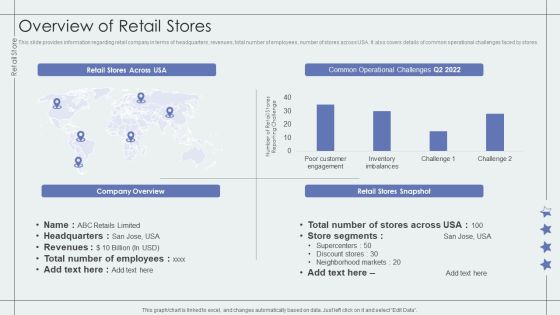
Overview Of Retail Stores Retail Outlet Performance Assessment Structure PDF
This slide provides information regarding retail company in terms of headquarters, revenues, total number of employees, number of stores across USA. It also covers details of common operational challenges faced by stores.Deliver an awe inspiring pitch with this creative Overview Of Retail Stores Retail Outlet Performance Assessment Structure PDF bundle. Topics like Common Operation, Neighborhood Markets, Stores Snapshot can be discussed with this completely editable template. It is available for immediate download depending on the needs and requirements of the user.

Competitive Analysis Of Sales And Revenue Performance Ppt Introduction PDF
The following slide showcases the competitive assessment of organizations sales and revenues to evaluate the gap and compare metrics. It includes pie chart representing performance along with key insights etc. This modern and well arranged Competitive Analysis Of Sales And Revenue Performance Ppt Introduction PDF provides lots of creative possibilities. It is very simple to customize and edit with the Powerpoint Software. Just drag and drop your pictures into the shapes. All facets of this template can be edited with Powerpoint no extra software is necessary. Add your own material, put your images in the places assigned for them, adjust the colors, and then you can show your slides to the world, with an animated slide included.

Human Resource Metrics For Organizational Performance Diagrams PDF
This slide showcases KPIs of human resource that can ensure employee retention and workplace productivity in organization. Its key factors are human capital output, human capital capability and health, culture and attitudes and employee lifecycle. Showcasing this set of slides titled Human Resource Metrics For Organizational Performance Diagrams PDF. The topics addressed in these templates are Human Capital Output, Human Capital Capability Health, Culture Attitudes. All the content presented in this PPT design is completely editable. Download it and make adjustments in color, background, font etc. as per your unique business setting.

Quarterly Sales Team Performance Analysis Kpis Slides PDF
The following slide depicts the efforts made my sales team in increasing companys growth. It also includes KPAs such as new customers acquired, sales, profit, average revenue per unit, customer lifetime value, acquisition cost etc. Showcasing this set of slides titled Quarterly Sales Team Performance Analysis Kpis Slides PDF. The topics addressed in these templates are Above Sales Target, Average Sales Revenue, Average Customer. All the content presented in this PPT design is completely editable. Download it and make adjustments in color, background, font etc. as per your unique business setting.

Sales Product Performance And Growth Kpis Ppt Layouts Mockup PDF
This slide displays a breakdown of sales results by particular product to monitor product demand and also to project product growth in the market. It includes units sold, annual income, and product revenue. Pitch your topic with ease and precision using this Sales Product Performance And Growth Kpis Ppt Layouts Mockup PDF. This layout presents information on Monthly Revenue, Product, Product Units. It is also available for immediate download and adjustment. So, changes can be made in the color, design, graphics or any other component to create a unique layout.

Operational Marketing Tactical Plan Kpis To Track Performance Background PDF
This slide provides KPIs to determine the overall effectiveness of the companys marketing plan. These include KPIs such as cost per lead, cost per customer acquisition, marketing rate of investment, sales qualified leads, and sales revenue. Presenting Operational Marketing Tactical Plan Kpis To Track Performance Background PDF to dispense important information. This template comprises five stages. It also presents valuable insights into the topics including Cost Per Lead, Cost Per Customer Acquisition, Sales Qualified Leads. This is a completely customizable PowerPoint theme that can be put to use immediately. So, download it and address the topic impactfully.

Sales Quarterly Performance Review System With Improvement Plan Infographics PDF
This slide shows sales division quarterly business review QBR with improvement steps. It provides information about deals closed, average sales cycle, revenue, customer buying motivation, leads onboard, gross margin, etc. Presenting Sales Quarterly Performance Review System With Improvement Plan Infographics PDF to dispense important information. This template comprises four stages. It also presents valuable insights into the topics including Deals Closed, Average Sales Cycle, Revenue. This is a completely customizable PowerPoint theme that can be put to use immediately. So, download it and address the topic impactfully.

Performance Indicators For Effective Traditional Marketing Ppt Show Influencers PDF
This slide showcases key metrics of traditional media for marketers. Major indicators covered are cost per lead, customer retention, marketing ROI. Sales revenue, customer lifetime value and website traffic. Coming up with a presentation necessitates that the majority of the effort goes into the content and the message you intend to convey. The visuals of a PowerPoint presentation can only be effective if it supplements and supports the story that is being told. Keeping this in mind our experts created Performance Indicators For Effective Traditional Marketing Ppt Show Influencers PDF to reduce the time that goes into designing the presentation. This way, you can concentrate on the message while our designers take care of providing you with the right template for the situation.
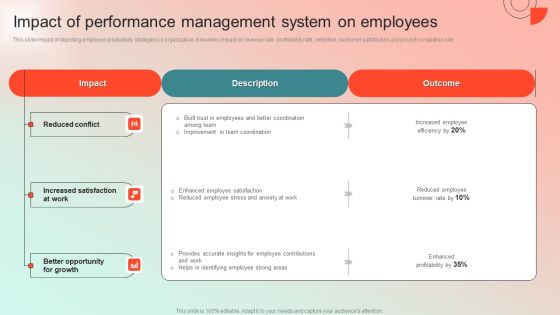
Impact Of Performance Management System On Employees Infographics PDF
This slide impact of depicting employee productivity strategies in organization. It involves impact on revenue rate, profitability rate, retention, customer satisfaction and project completion rate. This modern and well arranged Impact Of Performance Management System On Employees Infographics PDF provides lots of creative possibilities. It is very simple to customize and edit with the Powerpoint Software. Just drag and drop your pictures into the shapes. All facets of this template can be edited with Powerpoint no extra software is necessary. Add your own material, put your images in the places assigned for them, adjust the colors, and then you can show your slides to the world, with an animated slide included.

Metrics And Objectives To Measure Employees Performance Clipart PDF
The purpose of this slide is to showcase different KPIs and objectives used to measure employee efficiency. The KPI could be Revenue per employee profit per employee average task completion rate and utilization rate. Showcasing this set of slides titled Metrics And Objectives To Measure Employees Performance Clipart PDF. The topics addressed in these templates are Utilization Rate, Profit Per Employee, Revenue Per Employee. All the content presented in this PPT design is completely editable. Download it and make adjustments in color, background, font etc. as per your unique business setting.
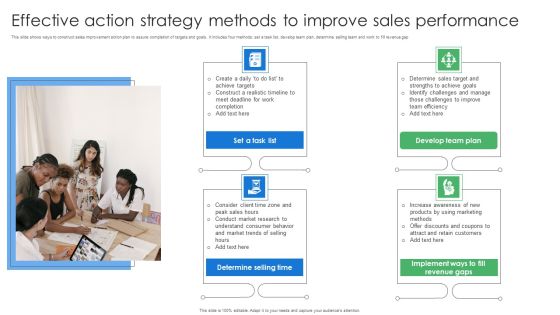
Effective Action Strategy Methods To Improve Sales Performance Sample PDF
This slide shows ways to construct sales improvement action plan to assure completion of targets and goals. It includes four methods set a task list, develop team plan, determine selling team and work to fill revenue gap. Presenting Effective Action Strategy Methods To Improve Sales Performance Sample PDF to dispense important information. This template comprises four stages. It also presents valuable insights into the topics including Sales, Conduct Market Research, Market Trends. This is a completely customizable PowerPoint theme that can be put to use immediately. So, download it and address the topic impactfully.

Key Performance Indicator To Track The Performance Of Oil And Gas Company Ppt Ideas Graphics Design PDF
The slide provides the key performance indicators KPIs that might help to track the performance of oil and gas companies. Major KPIs include revenue, crude oil and natural gas production, number of rigs, workforce etc. Deliver an awe inspiring pitch with this creative key performance indicator to track the performance of oil and gas company ppt ideas graphics design pdf bundle. Topics like key performance indicator to track the performance of oil and gas company can be discussed with this completely editable template. It is available for immediate download depending on the needs and requirements of the user.

Case Competition Petroleum Sector Issues Key Performance Indicator To Track The Performance Of Oil And Gas Company Diagrams PDF
The slide provides the key performance indicators KPIs that might help to track the performance of oil and gas companies. Major KPIs include revenue, crude oil and natural gas production, number of rigs, workforce etc. Deliver and pitch your topic in the best possible manner with this case competition petroleum sector issues key performance indicator to track the performance of oil and gas company diagrams pdf. Use them to share invaluable insights on key performance indicator, revenue, 2017 to 2021 and impress your audience. This template can be altered and modified as per your expectations. So, grab it now.
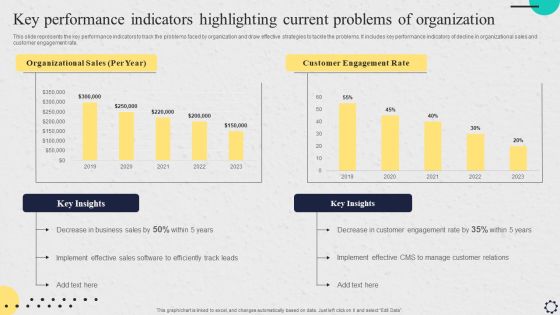
Software Implementation Strategy Key Performance Indicators Highlighting Current Problems Of Organization Professional PDF
This slide represents the key performance indicators to track the problems faced by organization and draw effective strategies to tackle the problems. It includes key performance indicators of decline in organizational sales and customer engagement rate. Make sure to capture your audiences attention in your business displays with our gratis customizable Software Implementation Strategy Key Performance Indicators Highlighting Current Problems Of Organization Professional PDF. These are great for business strategies, office conferences, capital raising or task suggestions. If you desire to acquire more customers for your tech business and ensure they stay satisfied, create your own sales presentation with these plain slides.

Website Performance Review Template 1 Ppt PowerPoint Presentation Portfolio Master Slide
This is a website performance review template 1 ppt powerpoint presentation portfolio master slide. This is a five stage process. The stages in this process are traffic sources, site consumption trend, online transaction, average visit time, organic branded.
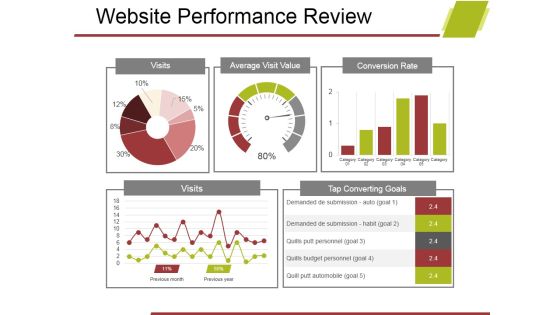
Website Performance Review Template 2 Ppt PowerPoint Presentation Model File Formats
This is a website performance review template 2 ppt powerpoint presentation model file formats. This is a five stage process. The stages in this process are visits, average visit value, conversion rate, visits, tap converting goals.

Criterion For Choosing Distribution Channel For Efficient Sales Administration Dashboards To Measure Performance Of Distribution Formats PDF
This slide covers the dashboards to measure performance of various distribution strategies of the organization. This includes partner performance dashboards, top products by revenue, sales by location etc. From laying roadmaps to briefing everything in detail, our templates are perfect for you. You can set the stage with your presentation slides. All you have to do is download these easy-to-edit and customizable templates. Criterion For Choosing Distribution Channel For Efficient Sales Administration Dashboards To Measure Performance Of Distribution Formats PDF will help you deliver an outstanding performance that everyone would remember and praise you for. Do download this presentation today.

Ecommerce KPI Dashboard With Pand L Statement Download PDF
This slide showcases ecommerce key performance indicators KPI dashboard with financial statement. It provides information about total sales, orders, net profit, net profit margin, average order value, channels, etc. This Ecommerce KPI Dashboard With Pand L Statement Download PDF from Slidegeeks makes it easy to present information on your topic with precision. It provides customization options, so you can make changes to the colors, design, graphics, or any other component to create a unique layout. It is also available for immediate download, so you can begin using it right away. Slidegeeks has done good research to ensure that you have everything you need to make your presentation stand out. Make a name out there for a brilliant performance.

Capital Markets Dashboard Ppt Powerpoint Slide Background
This is a capital markets dashboard ppt powerpoint slide background. This is a three stage process. The stages in this process are weekly sales, product inventory, key performance indicators.

Business Intelligence Dashboard Ppt Examples Slides
This is a business intelligence dashboard ppt examples slides. This is a four stage process. The stages in this process are metrics, scorecard, key performance indicator, numbers.
Website Performance Review Template 2 Ppt PowerPoint Presentation Icon Design Ideas
This is a website performance review template 2 ppt powerpoint presentation icon design ideas. This is a four stage process. The stages in this process are column two, revenue trends, traffic sources.
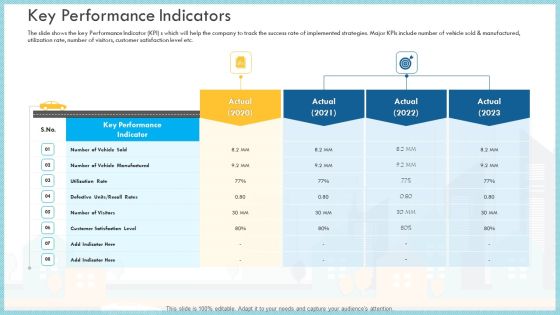
Loss Of Income And Financials Decline In An Automobile Organization Case Study Key Performance Indicators Brochure PDF
The slide shows the key Performance Indicator KPI s which will help the company to track the success rate of implemented strategies. Major KPIs include number of vehicle sold and manufactured, utilization rate, number of visitors, customer satisfaction level etc.Deliver an awe inspiring pitch with this creative loss of income and financials decline in an automobile organization case study key performance indicators brochure pdf bundle. Topics like key performance indicator, utilization rate, customer satisfaction level can be discussed with this completely editable template. It is available for immediate download depending on the needs and requirements of the user

Creating A Recruitment Dashboard Powerpoint Sample
This is a creating a recruitment dashboard powerpoint sample. This is a two stage process. The stages in this process are critical success factors, sourcing channels, recruiter efficiency, acceptance rate, key performance indicators, candidate, manager satisfaction, quality of hire, efficiency ratio.

Content Marketing Performance Template 1 Ppt PowerPoint Presentation Infographics Graphics Example
This is a content marketing performance template 1 ppt powerpoint presentation infographics graphics example. This is a eight stage process. The stages in this process are brand awareness, engagement, sales, lead generation, customer retention lead nurturing, upsell.

Call Center Metrics Dashboard With Average Response Time Inspiration PDF
Mentioned slide outlines KPI dashboard which can be used by call center to measure the performance of their agents. The key metrics highlighted in the dashboard are first call resolution, daily abandonment rate, total number of calls by topic, top performing call agents etc. Showcasing this set of slides titled Call Center Metrics Dashboard With Average Response Time Inspiration PDF. The topics addressed in these templates are Efficiency, Quality, Activity, Daily Average Response, Daily Average Transfer. All the content presented in this PPT design is completely editable. Download it and make adjustments in color, background, font etc. as per your unique business setting.

Annual B2C Business Review Dashboard Microsoft PDF
The following slide shows dashboard to help organizations arrange financial business indicators and communicate important companys information to key stakeholders. It includes sales, gross, operating and net profit and other major performance indicators. Showcasing this set of slides titled Annual B2C Business Review Dashboard Microsoft PDF. The topics addressed in these templates are Gross Profit, Sales, Operating Profit. All the content presented in this PPT design is completely editable. Download it and make adjustments in color, background, font etc. as per your unique business setting.
Project Tracking Dashboard Template Ppt Sample
This is a project tracking dashboard template ppt sample. This is a five stage process. The stages in this process are requirements, analytics, needs, performance, analysis.

Energy Efficiency Dashboard To Track Campaign Effectiveness Pictures PDF
This slide consists of a dashboard which presents an energy saving dashboard which can be used to track effectiveness of energy saving program. The key performance indicators relate to energy sources, energy consumption by sectors, energy consumption by sectors etc. Pitch your topic with ease and precision using this Energy Efficiency Dashboard To Track Campaign Effectiveness Pictures PDF. This layout presents information on Energy Sources, Energy Usage, Trend Analysis. It is also available for immediate download and adjustment. So, changes can be made in the color, design, graphics or any other component to create a unique layout.

Dashboard To Track Energy Efficiency After Campaign Implementation Pictures PDF
This slide consists of a Dashboard which can be used to track energy saving which will be used by managers to track effectiveness of program implementation. The key performance indicators include electric vs gas allocation, equipment activity, changes in costs, budget load etc. Showcasing this set of slides titled Dashboard To Track Energy Efficiency After Campaign Implementation Pictures PDF. The topics addressed in these templates are Equipment Activity, Budget Load, Cost Projection. All the content presented in this PPT design is completely editable. Download it and make adjustments in color, background, font etc. as per your unique business setting.
Storage Logistics Warehouse Management Dashboard Icons PDF
The slide demonstrates information regarding the warehouse management dashboard in order to track key activities. Deliver an awe inspiring pitch with this creative storage logistics warehouse management dashboard icons pdf bundle. Topics like orders, kpls monthly, global financial performances can be discussed with this completely editable template. It is available for immediate download depending on the needs and requirements of the user.
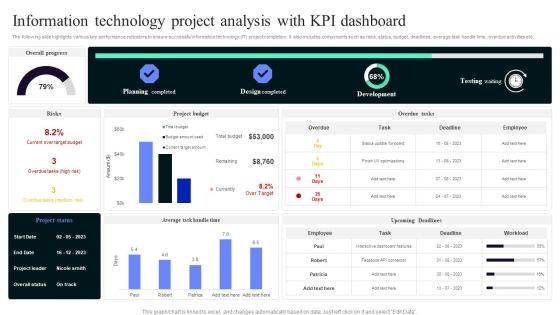
Information Technology Project Analysis With Kpi Dashboard Portrait PDF
The following slide highlights various key performance indicators to ensure successful information technology IT project completion. It also includes components such as risks, status, budget, deadlines, average task handle time, overdue activities etc. Pitch your topic with ease and precision using this Information Technology Project Analysis With Kpi Dashboard Portrait PDF. This layout presents information on Planning Completed, Design Completed, Development . It is also available for immediate download and adjustment. So, changes can be made in the color, design, graphics or any other component to create a unique layout.
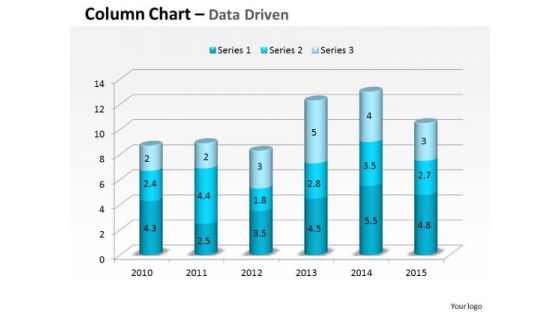
Data Analysis In Excel 3d Compare Yearly Business Performance PowerPoint Templates
Plan For All Contingencies With Our data analysis in excel 3d compare yearly business performance Powerpoint Templates . Douse The Fire Before It Catches.
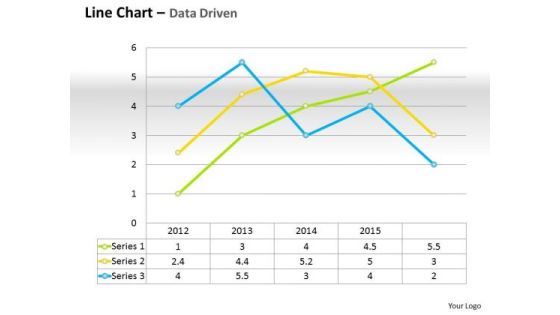
Data Analysis Template Driven Line Chart For Business Performance PowerPoint Slides Templates
Do Not Allow Things To Drift. Ring In Changes With Our data analysis template driven line chart for business performance powerpoint slides Templates .
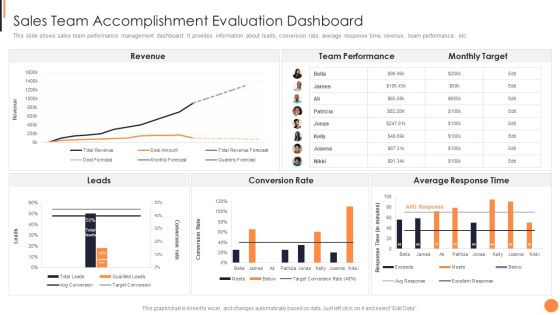
Sales Team Accomplishment Evaluation Dashboard Portrait PDF
This slide shows sales team performance management dashboard. It provides information about leads, conversion rate, average response time, revenue, team performance, etc. Pitch your topic with ease and precision using this sales team accomplishment evaluation dashboard portrait pdf This layout presents information on sales team accomplishment evaluation dashboard It is also available for immediate download and adjustment. So, changes can be made in the color, design, graphics or any other component to create a unique layout.
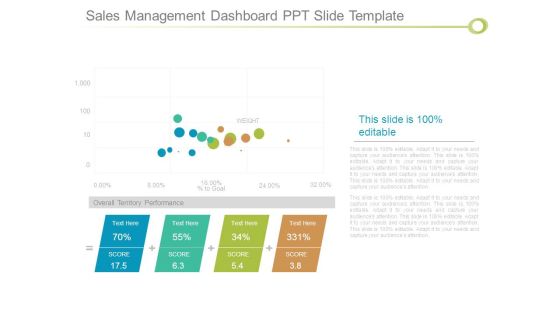
Sales Management Dashboard Ppt Slide Template
This is a sales management dashboard ppt slide template. This is a four stage process. The stages in this process are weight, goal, overall territory performance, score.

Attended Robotic Process Automation Dashboard Rules PDF
This slide consists of a strategic automation dashboard used to monitor attended robotic process which will assist managers to track the performance. The key performance indicators include money saved, time saved, monetary goal for the year etc. Showcasing this set of slides titled Attended Robotic Process Automation Dashboard Rules PDF. The topics addressed in these templates are Productivity, Goal, Process Automation Dashboard. All the content presented in this PPT design is completely editable. Download it and make adjustments in color, background, font etc. as per your unique business setting.

Call Center Metrics Dashboard With Average Queue Time Topics PDF
Mentioned slide outlines call center KPI dashboard which gives insights into customer agent performance. The KPI covered in the slide are total voicemail, average talk time, queue time, average quality rate, agent performance, etc. Pitch your topic with ease and precision using this Call Center Metrics Dashboard With Average Queue Time Topics PDF. This layout presents information on Efficiency, Quality, Activity. It is also available for immediate download and adjustment. So, changes can be made in the color, design, graphics or any other component to create a unique layout.

Metrics Dashboard To Measure Call Center Success Themes PDF
Mentioned slide outlines a comprehensive KPI dashboard used to measure the call center performance. The dashboard monitors the status of key metrics such as call abandonment levels, current service level, average call length, total calls attended, calls waiting etc. Showcasing this set of slides titled Metrics Dashboard To Measure Call Center Success Themes PDF. The topics addressed in these templates are Center Success, Call Center Status, Call Monitor. All the content presented in this PPT design is completely editable. Download it and make adjustments in color, background, font etc. as per your unique business setting.
Stock Inventory Acquisition Dashboard For Managing Warehouse Operations Icons PDF
This slide showcases dashboard that can help organization to manage and track the warehouse operations. Its key elements are order, volume, inventory, monthly KPIs and global financial performance. Explore a selection of the finest Stock Inventory Acquisition Dashboard For Managing Warehouse Operations Icons PDF here. With a plethora of professionally designed and pre-made slide templates, you can quickly and easily find the right one for your upcoming presentation. You can use our Stock Inventory Acquisition Dashboard For Managing Warehouse Operations Icons PDF to effectively convey your message to a wider audience. Slidegeeks has done a lot of research before preparing these presentation templates. The content can be personalized and the slides are highly editable. Grab templates today from Slidegeeks.

Client Support KPI Dashboard Rules PDF
This slide shows key performance indicators of customer service delivery. It includes service level, request volume, cost of revenue, customer satisfaction, customer retention, etc. Pitch your topic with ease and precision using this Client Support KPI Dashboard Rules PDF. This layout presents information on Customer Retention, Cost Per Support, Average Issue Solving Time. It is also available for immediate download and adjustment. So, changes can be made in the color, design, graphics or any other component to create a unique layout.

Business Survey Analysis Dashboard Based On Demographics Data Microsoft PDF
The purpose of this template is to explain the analysis of business survey conduct based on demographics. The slide provides information about support team, respondents and product preference. Pitch your topic with ease and precision using this Business Survey Analysis Dashboard Based On Demographics Data Microsoft PDF. This layout presents information on Support, Team Performance, Product Preference It is also available for immediate download and adjustment. So, changes can be made in the color, design, graphics or any other component to create a unique layout.

Financial Analysis Vector Bar Graph With Magnifying Glass Ppt PowerPoint Presentation Gallery Design Ideas
This is a financial analysis vector bar graph with magnifying glass ppt powerpoint presentation gallery design ideas. This is a four stage process. The stages in this process are marketing analytics, marketing performance, marketing discovery.

Brand Awareness Measuring Kpi Dashboard Brand And Equity Evaluation Techniques Ideas PDF
Mentioned slide showcases KPI dashboard that can be used to check the financial performance of a brand. Metrics covered in the dashboard are return on assets, working capital ratio, return on equity etc.From laying roadmaps to briefing everything in detail, our templates are perfect for you. You can set the stage with your presentation slides. All you have to do is download these easy-to-edit and customizable templates. Brand Awareness Measuring Kpi Dashboard Brand And Equity Evaluation Techniques Ideas PDF will help you deliver an outstanding performance that everyone would remember and praise you for. Do download this presentation today.

Dashboard For Managing Warehouse Operations Mockup PDF
This slide showcases dashboard that can help organization to manage and track the warehouse operations. Its key elements are order, volume, inventory, monthly KPIs and global financial performance. Here you can discover an assortment of the finest PowerPoint and Google Slides templates. With these templates, you can create presentations for a variety of purposes while simultaneously providing your audience with an eye catching visual experience. Download Dashboard For Managing Warehouse Operations Mockup PDF to deliver an impeccable presentation. These templates will make your job of preparing presentations much quicker, yet still, maintain a high level of quality. Slidegeeks has experienced researchers who prepare these templates and write high quality content for you. Later on, you can personalize the content by editing the Dashboard For Managing Warehouse Operations Mockup PDF.

Dashboard Showing Construction Project Metrics Sample PDF
This slide shows the dashboard which depicts the construction project management performance such as billing date, working profit, total cost, billed percentage, budget spent, completed projects and comparison of two companies about revenues earned from project. Showcasing this set of slides titled Dashboard Showing Construction Project Metrics Sample PDF. The topics addressed in these templates are Dashboard, Construction Project Metrics. All the content presented in this PPT design is completely editable. Download it and make adjustments in color, background, font etc. as per your unique business setting.

Customer Support Services Analysis Dashboard Template PDF
The following slide illustrates dashboard for customer services which can be used to evaluate performance of businesses over the years. It include key elements such as request volume, customer retention, cost per support, revenue, customer satisfaction etc. Showcasing this set of slides titled Customer Support Services Analysis Dashboard Template PDF. The topics addressed in these templates are Customer Support Services, Analysis Dashboard. All the content presented in this PPT design is completely editable. Download it and make adjustments in color, background, font etc. as per your unique business setting.

Weekly Marketing Investment Report Dashboard Ideas PDF
This slide illustrates the overview of advertising expenditure weekly performance metrics. It incorporate total budget spent and estimated for advertising, estimated and actual registration, revenue, conversion metrics rates etc. Showcasing this set of slides titled Weekly Marketing Investment Report Dashboard Ideas PDF. The topics addressed in these templates are Conversion Metrics, Quality Of Traffic, Quality Of Transaction. All the content presented in this PPT design is completely editable. Download it and make adjustments in color, background, font etc. as per your unique business setting.
Project Tracking Cost Tracker Dashboard Elements PDF
The following slide highlights the cost analysis of various projects to perform feasibility analysis. It includes budgeted versus actual cost, project wise cost and revenue allocation etc. Showcasing this set of slides titled Project Tracking Cost Tracker Dashboard Elements PDF. The topics addressed in these templates are Budgeted Costs, Resource Allocation, Project Costs. All the content presented in this PPT design is completely editable. Download it and make adjustments in color, background, font etc. as per your unique business setting.

Dashboard For Strategic Evaluation Of Key Business Financials Ppt Gallery Aids PDF
This slide displays dashboard to review business performance and formulate appropriate improvement strategies. It further includes kpis such as revenue comparison, top selling categories, sales by month, customer satisfaction, etc. Showcasing this set of slides titled Dashboard For Strategic Evaluation Of Key Business Financials Ppt Gallery Aids PDF. The topics addressed in these templates are Revenue Comparison, Top Selling Categories, New Customer. All the content presented in this PPT design is completely editable. Download it and make adjustments in color, background, font etc. as per your unique business setting.
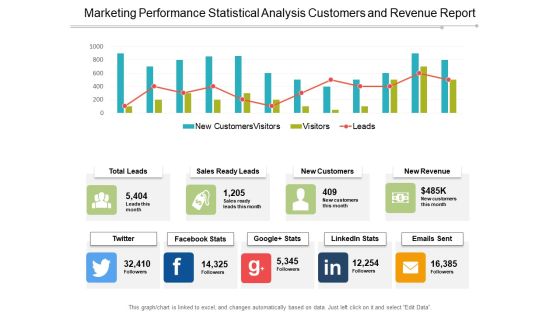
Marketing Performance Statistical Analysis Customers And Revenue Report Ppt PowerPoint Presentation Outline Shapes
This is a marketing performance statistical analysis customers and revenue report ppt powerpoint presentation outline shapes. This is a four stage process. The stages in this process are marketing analytics, marketing performance, marketing discovery.
Investment Project Prioritization KPI Dashboard Icons PDF
This slide covers project management dashboard for ranking and filtering capital projects. It also include KPIs such as top projects by NPV, top projects by IRR, investor amount, return amount, etc. Showcasing this set of slides titled Investment Project Prioritization KPI Dashboard Icons PDF. The topics addressed in these templates are Project Performance, Top Project NPV, Top Project IRR. All the content presented in this PPT design is completely editable. Download it and make adjustments in color, background, font etc. as per your unique business setting.

Data Statistics Charts And Key Performance Indicators Ppt Powerpoint Presentation Layouts Guide
This is a data statistics charts and key performance indicators ppt powerpoint presentation layouts guide. This is a four stage process. The stages in this process are business metrics, business kpi, business dashboard.
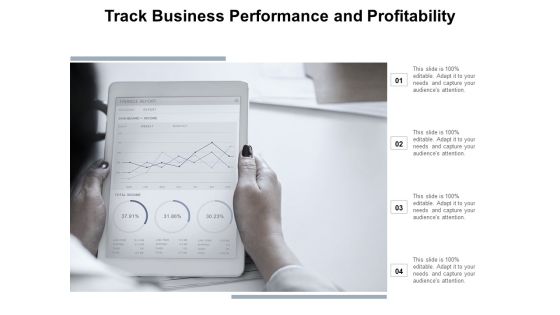
Track Business Performance And Profitability Ppt Powerpoint Presentation File Master Slide
This is a track business performance and profitability ppt powerpoint presentation file master slide. This is a four stage process. The stages in this process are business metrics, business kpi, business dashboard.

Funding Pitch On Company Financial Overview For Fy22 Ppt Infographics Display PDF
This slide illustrates corporate financial performance overview for capital fund raising. It includes profitable growth, robust order book, resilient balance sheet etc. Persuade your audience using this Funding Pitch On Company Financial Overview For Fy22 Ppt Infographics Display PDF. This PPT design covers one stages, thus making it a great tool to use. It also caters to a variety of topics including Robust Order Book, Strong Performance, Resilient Balance Sheet. Download this PPT design now to present a convincing pitch that not only emphasizes the topic but also showcases your presentation skills.

Financial Forecast After Process Improvement Develop Organizational Productivity By Enhancing Business Process Brochure PDF
The slide provides the financial forecast of the company after the process improvement. Major KPIs key performance indicators covered in the slide are total revenue, interest income, number of customers, customer churn rate, online banking users, customer satisfaction rate etc. Deliver an awe inspiring pitch with this creative financial forecast after process improvement develop organizational productivity by enhancing business process brochure pdf bundle. Topics like revenue, interest income, performance indicator, actual, target can be discussed with this completely editable template. It is available for immediate download depending on the needs and requirements of the user.

Post Implementation Other Operation And Financial Kpis Ppt Infographic Template PDF
The slide provides five years graphs 2020F-2024F forecasted number of major KPIs key performance indicators, that might help to track the performance of ABC Railway. Covered KPIs include Revenue, Total Passengers, operating income, customer satisfaction rate etc. Deliver an awe inspiring pitch with this creative post implementation other operation and financial kpis ppt infographic template pdf bundle. Topics like operating income, revenue, customer satisfaction can be discussed with this completely editable template. It is available for immediate download depending on the needs and requirements of the user.
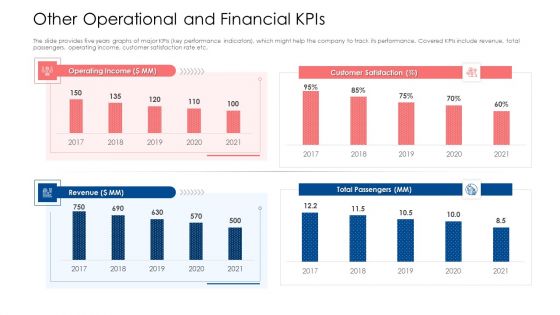
Building Brand Image Of A Railway Firm Other Operational And Financial Kpis Structure PDF
The slide provides five years graphs of major KPIs key performance indicators, which might help the company to track its performance. Covered KPIs include revenue, total passengers, operating income, customer satisfaction rate etc. Deliver and pitch your topic in the best possible manner with this building brand image of a railway firm other operational and financial kpis structure pdf. Use them to share invaluable insights on operating income, customer satisfaction, revenue and impress your audience. This template can be altered and modified as per your expectations. So, grab it now.

Guy Kawasaki 10 20 30 Rule Investor Financial Projections And Key Metrics Rules PDF
This slide illustrates key performance indicators highlighting the financial projections of the company post product launch. KPIs covered here are revenue growth, profit margin along with customer acquisition cost.Deliver an awe inspiring pitch with this creative guy kawasaki 10 20 30 rule investor financial projections and key metrics rules pdf bundle. Topics like financial projections and key metrics can be discussed with this completely editable template. It is available for immediate download depending on the needs and requirements of the user.

Ten Slides Guy Kawasaki Investor Deck Financial Projections And Key Metrics Structure PDF
This slide illustrates key performance indicators highlighting the financial projections of the company post product launch. KPIs covered here are revenue growth, profit margin along with customer acquisition cost. Deliver an awe-inspiring pitch with this creative ten slides guy kawasaki investor deck financial projections and key metrics structure pdf. bundle. Topics like financial projections and key metrics can be discussed with this completely editable template. It is available for immediate download depending on the needs and requirements of the user.
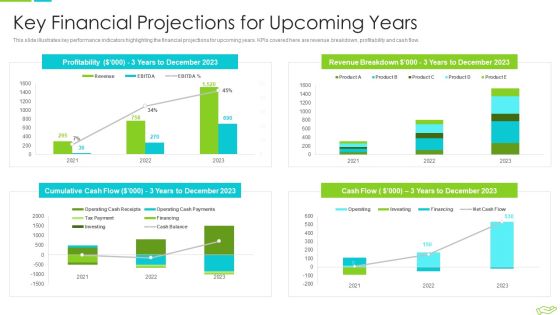
Elevator Pitch Deck To Raise Funds Key Financial Projections For Upcoming Years Pictures PDF
This slide illustrates key performance indicators highlighting the financial projections for upcoming years. KPIs covered here are revenue breakdown, profitability and cash flow. Deliver an awe inspiring pitch with this creative elevator pitch deck to raise funds key financial projections for upcoming years pictures pdf bundle. Topics like key financial projections for upcoming years can be discussed with this completely editable template. It is available for immediate download depending on the needs and requirements of the user.

Managing CFO Services Company Financials Dashboard Profit Ppt Infographics Example File PDF
Presenting this set of slides with name managing cfo services company financials dashboard profit ppt infographics example file pdf. The topics discussed in these slides are revenue, customers, vendors, profit, expense, performance. This is a completely editable PowerPoint presentation and is available for immediate download. Download now and impress your audience.

Outsourcing Of Finance And Accounting Processes Company Financials Dashboard Microsoft PDF
Presenting this set of slides with name outsourcing of finance and accounting processes company financials dashboard microsoft pdf. The topics discussed in these slides are performance, revenue, expense, profit. This is a completely editable PowerPoint presentation and is available for immediate download. Download now and impress your audience.

Accounting Pitch Deck Key Financial Projections For Upcoming Years Designs PDF
This slide illustrates key performance indicators highlighting the financial projections for upcoming years. KPIs covered here are revenue breakdown, profitability and cash flow.Deliver an awe inspiring pitch with this creative accounting pitch deck key financial projections for upcoming years designs pdf bundle. Topics like revenue breakdown, profitability, cumulative cash flow can be discussed with this completely editable template. It is available for immediate download depending on the needs and requirements of the user.
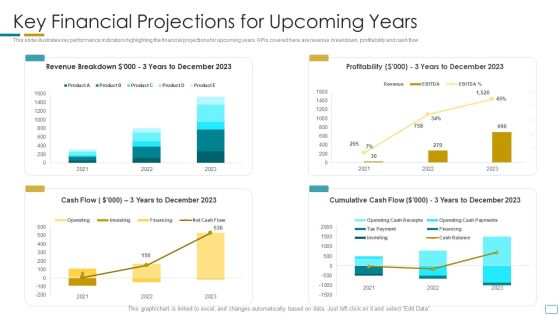
Fundraising Pitch Deck For Startup Company Key Financial Projections For Upcoming Years Brochure PDF
This slide illustrates key performance indicators highlighting the financial projections for upcoming years. KPIs covered here are revenue breakdown, profitability and cash flow Deliver an awe inspiring pitch with this creative fundraising pitch deck for startup company key financial projections for upcoming years brochure pdf bundle. Topics like profitability, revenue can be discussed with this completely editable template. It is available for immediate download depending on the needs and requirements of the user.
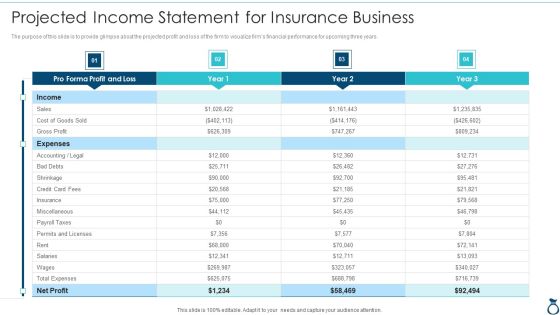
Financial Services Advisory Business Plan Projected Income Statement For Insurance Infographics PDF
The purpose of this slide is to provide glimpse about the projected profit and loss of the firm to visualize firms financial performance for upcoming three years. Deliver an awe inspiring pitch with this creative Financial Services Advisory Business Plan Projected Income Statement For Insurance Infographics PDF bundle. Topics like Profit And Loss, Insurance, Rent, Cost, Gross Profit can be discussed with this completely editable template. It is available for immediate download depending on the needs and requirements of the user.

Financial Analysis Software Pricing Plans Effective Planning For Monetary Strategy Mockup PDF
This slide provides glimpse about multiple pricing plans for selected financial analysis software with its features. It includes features such as various financial tools and reports, sample reports availability, liquidity and profitability analysis, etc.From laying roadmaps to briefing everything in detail, our templates are perfect for you. You can set the stage with your presentation slides. All you have to do is download these easy-to-edit and customizable templates. Financial Analysis Software Pricing Plans Effective Planning For Monetary Strategy Mockup PDF will help you deliver an outstanding performance that everyone would remember and praise you for. Do download this presentation today.
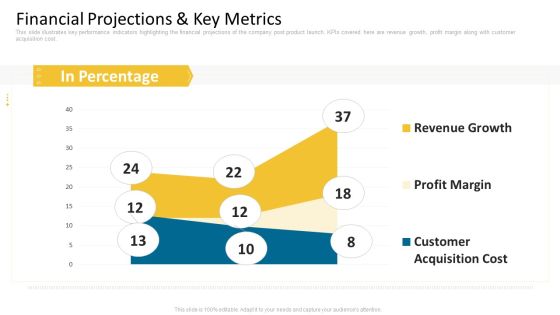
Guy Kawasaki New Venture Pitch PPT Financial Projections And Key Metrics Summary PDF
This slide illustrates key performance indicators highlighting the financial projections of the company post product launch. KPIs covered here are revenue growth, profit margin along with customer acquisition cost. Deliver and pitch your topic in the best possible manner with this guy kawasaki new venture pitch ppt financial projections and key metrics summary pdf. Use them to share invaluable insights on revenue growth, profit margin, customer acquisition cost and impress your audience. This template can be altered and modified as per your expectations. So, grab it now.

Procedure Advancements Banking Department Financial Forecast After Process Improvement Template PDF
The slide provides the financial forecast of the company after the process improvement. Major KPIs key performance indicators covered in the slide are total revenue, interest income, number of customers, customer churn rate, online banking users, customer satisfaction rate etc. Deliver and pitch your topic in the best possible manner with this procedure advancements banking department financial forecast after process improvement template pdf. Use them to share invaluable insights on total revenue, interest income, customer satisfaction rate, customer churn rate, online banking users and impress your audience. This template can be altered and modified as per your expectations. So, grab it now.

Estimating Business Overall Evaluation Criteria To Select The Best Financial Analysis Software Infographics PDF
The following slide outlines the various factors which will assist the organization in determining the financial analysis software tool. Pricing, availability of major features, support and training and deployment are some of the key factors which are outlined in the slide. From laying roadmaps to briefing everything in detail, our templates are perfect for you. You can set the stage with your presentation slides. All you have to do is download these easy-to-edit and customizable templates. Estimating Business Overall Evaluation Criteria To Select The Best Financial Analysis Software Infographics PDF will help you deliver an outstanding performance that everyone would remember and praise you for. Do download this presentation today.

Customer Goods Production Company Financial Summary With Operating Cash Flow Infographics PDF
This slide highlights company financial summary in tabular format which includes net sales, operating income, net earning attributable, diluted net earning, operating cash flow and dividends per share. From laying roadmaps to briefing everything in detail, our templates are perfect for you. You can set the stage with your presentation slides. All you have to do is download these easy-to-edit and customizable templates. Customer Goods Production Company Financial Summary With Operating Cash Flow Infographics PDF will help you deliver an outstanding performance that everyone would remember and praise you for. Do download this presentation today.

Company Financial Forecast And Essential Metrics Ppt Model Design Templates PDF
This slide shows the projections of the financials of a company with the key performance indicators to know exactly where the business stands and what needs to be enhanced or reduced to make the business profitable. Showcasing this set of slides titled Company Financial Forecast And Essential Metrics Ppt Model Design Templates PDF. The topics addressed in these templates are Budget, Income, Expense, 2018 To 2022. All the content presented in this PPT design is completely editable. Download it and make adjustments in color, background, font etc. as per your unique business setting.
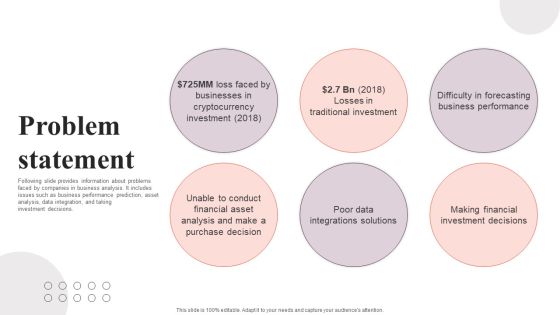
Financial Analytics Solution Investor Funding Elevator Pitch Deck Problem Statement Formats PDF
Following slide provides information about problems faced by companies in business analysis. It includes issues such as business performance prediction, asset analysis, data integration, and taking investment decisions. Make sure to capture your audiences attention in your business displays with our gratis customizable Financial Analytics Solution Investor Funding Elevator Pitch Deck Problem Statement Formats PDF. These are great for business strategies, office conferences, capital raising or task suggestions. If you desire to acquire more customers for your tech business and ensure they stay satisfied, create your own sales presentation with these plain slides.
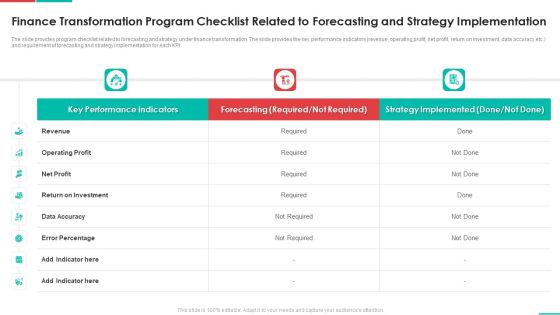
Roadmap For Financial Accounting Transformation Finance Transformation Program Checklist Related Themes PDF
The slide provides program checklist related to forecasting and strategy under finance transformation. The slide provides the key performance indicators revenue, operating profit, net profit, return on investment, data accuracy etc. and requirement of forecasting and strategy implementation for each KPI. Deliver and pitch your topic in the best possible manner with this roadmap for financial accounting transformation finance transformation program checklist related themes pdf. Use them to share invaluable insights on revenue, operating profit, net profit, return on investment, data accuracy and impress your audience. This template can be altered and modified as per your expectations. So, grab it now.

Critical Initiatives To Deploy Merger And Acquisition Process To Leverage Financial Infographics PDF
This slide provides information regarding merger and acquisition process that focuses on consolidating firm or its assets with stimulating growth, in order to gain competitive edge, improve market share. Various phases associated with MandA process include incubation, exploration, negotiation, integration. From laying roadmaps to briefing everything in detail, our templates are perfect for you. You can set the stage with your presentation slides. All you have to do is download these easy-to-edit and customizable templates. Critical Initiatives To Deploy Merger And Acquisition Process To Leverage Financial Infographics PDF will help you deliver an outstanding performance that everyone would remember and praise you for. Do download this presentation today.

Emotional Marketing Strategy To Nurture Analyzing Brands Key Financial Indicators Demonstration PDF
This slide showcases assessing key indicators for measuring financial performance of brand. It provides details about turnover, marketing costs, sales, administrative expenses, profit, percentage turnover, trade debtor days, headcount, etc. Create an editable Emotional Marketing Strategy To Nurture Analyzing Brands Key Financial Indicators Demonstration PDF that communicates your idea and engages your audience. Whether youre presenting a business or an educational presentation, pre-designed presentation templates help save time. Emotional Marketing Strategy To Nurture Analyzing Brands Key Financial Indicators Demonstration PDF is highly customizable and very easy to edit, covering many different styles from creative to business presentations. Slidegeeks has creative team members who have crafted amazing templates. So, go and get them without any delay.

Apple Emotional Marketing Strategy Analyzing Brands Key Financial Indicators Rules PDF
This slide showcases assessing key indicators for measuring financial performance of brand. It provides details about turnover, marketing costs, sales, administrative expenses, profit, percentage turnover, trade debtor days, headcount, etc. Here you can discover an assortment of the finest PowerPoint and Google Slides templates. With these templates, you can create presentations for a variety of purposes while simultaneously providing your audience with an eye catching visual experience. Download Apple Emotional Marketing Strategy Analyzing Brands Key Financial Indicators Rules PDF to deliver an impeccable presentation. These templates will make your job of preparing presentations much quicker, yet still, maintain a high level of quality. Slidegeeks has experienced researchers who prepare these templates and write high quality content for you. Later on, you can personalize the content by editing the Apple Emotional Marketing Strategy Analyzing Brands Key Financial Indicators Rules PDF.

Marketing Commodities And Offerings Analyzing Brands Key Financial Indicators Demonstration PDF
This slide showcases assessing key indicators for measuring financial performance of brand. It provides details about turnover, marketing costs, sales, administrative expenses, profit, percentage turnover, trade debtor days, headcount, etc. Here you can discover an assortment of the finest PowerPoint and Google Slides templates. With these templates, you can create presentations for a variety of purposes while simultaneously providing your audience with an eye catching visual experience. Download Marketing Commodities And Offerings Analyzing Brands Key Financial Indicators Demonstration PDF to deliver an impeccable presentation. These templates will make your job of preparing presentations much quicker, yet still, maintain a high level of quality. Slidegeeks has experienced researchers who prepare these templates and write high quality content for you. Later on, you can personalize the content by editing the Marketing Commodities And Offerings Analyzing Brands Key Financial Indicators Demonstration PDF.

Nike Emotional Branding Strategy Analyzing Brands Key Financial Indicators Summary PDF
This slide showcases assessing key indicators for measuring financial performance of brand. It provides details about turnover, marketing costs, sales, administrative expenses, profit, percentage turnover, trade debtor days, headcount, etc. Create an editable Nike Emotional Branding Strategy Analyzing Brands Key Financial Indicators Summary PDF that communicates your idea and engages your audience. Whether youre presenting a business or an educational presentation, pre designed presentation templates help save time. Nike Emotional Branding Strategy Analyzing Brands Key Financial Indicators Summary PDF is highly customizable and very easy to edit, covering many different styles from creative to business presentations. Slidegeeks has creative team members who have crafted amazing templates. So, go and get them without any delay.
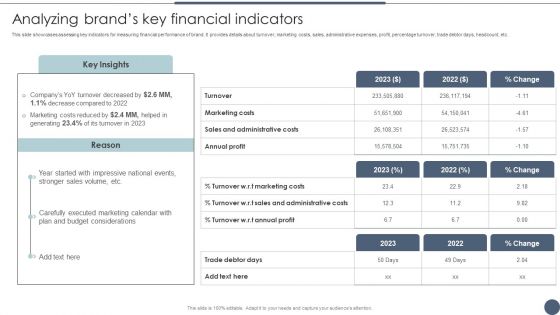
Analyzing Brands Key Financial Indicators Utilizing Emotional And Rational Branding For Improved Consumer Outreach Template PDF
This slide showcases assessing key indicators for measuring financial performance of brand. It provides details about turnover, marketing costs, sales, administrative expenses, profit, percentage turnover, trade debtor days, headcount, etc. Slidegeeks is one of the best resources for PowerPoint templates. You can download easily and regulate Analyzing Brands Key Financial Indicators Utilizing Emotional And Rational Branding For Improved Consumer Outreach Template PDF for your personal presentations from our wonderful collection. A few clicks is all it takes to discover and get the most relevant and appropriate templates. Use our Templates to add a unique zing and appeal to your presentation and meetings. All the slides are easy to edit and you can use them even for advertisement purposes.

Companys Financial Comparison Before And After Implementation Of Promotional Strategies Infographics PDF
This slide shows the comparison of companys performance before and after the product marketing strategy implementation. It shows the comparison based on parameters such as product demand, number of product sold, total sale, lead conversion rate, customer retention rate, per customer acquisition cost etc. If you are looking for a format to display your unique thoughts, then the professionally designed Companys Financial Comparison Before And After Implementation Of Promotional Strategies Infographics PDF is the one for you. You can use it as a Google Slides template or a PowerPoint template. Incorporate impressive visuals, symbols, images, and other charts. Modify or reorganize the text boxes as you desire. Experiment with shade schemes and font pairings. Alter, share or cooperate with other people on your work. Download Companys Financial Comparison Before And After Implementation Of Promotional Strategies Infographics PDF and find out how to give a successful presentation. Present a perfect display to your team and make your presentation unforgettable.
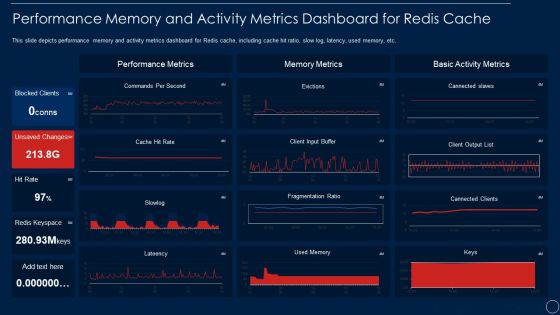
Redis Cache Data Structure IT Performance Memory And Activity Metrics Introduction PDF
This slide depicts performance memory and activity metrics dashboard for Redis cache, including cache hit ratio, slow log, latency, used memory, etc. This is a redis cache data structure it performance memory and activity metrics introduction pdf template with various stages. Focus and dispense information on one stages using this creative set, that comes with editable features. It contains large content boxes to add your information on topics like performance memory and activity metrics dashboard for redis cache. You can also showcase facts, figures, and other relevant content using this PPT layout. Grab it now.

Four Phases Of Business Turnabout Strategy And Execution For Financial Restructuring Clipart PDF
This slide covers turnaround plan to avoid insolvency. It includes cash management, providing rapid diagnostic, perform clear data analysis, prioritise opportunities and benefit from cash achievements.Presenting Four Phases Of Business Turnabout Strategy And Execution For Financial Restructuring Clipart PDF to dispense important information. This template comprises four stages. It also presents valuable insights into the topics including Analysis The Business, Develop Restructuring, Implementation. This is a completely customizable PowerPoint theme that can be put to use immediately. So, download it and address the topic impactfully.

Pitch Presentation Raise Money Spot Market Operational And Financial Overview Ppt Infographics Guide PDF
The slide provides a brief overview of the companys operations introduction, mission and vision statement and financials Revenue, EBIT, Net income and Non Performing Assets. Deliver an awe-inspiring pitch with this creative pitch presentation raise money spot market operational and financial overview ppt infographics guide pdf bundle. Topics like performing assets, mission, vision can be discussed with this completely editable template. It is available for immediate download depending on the needs and requirements of the user.
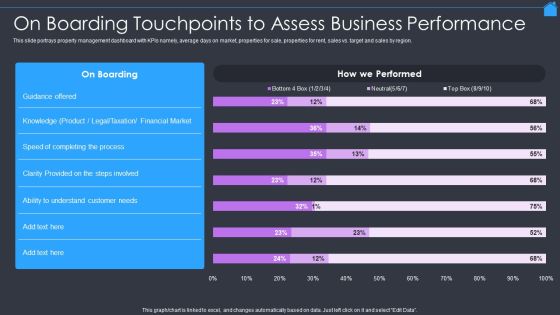
Marketing Strategy To Enhance Real Estate Sales On Boarding Touchpoints To Assess Business Performance Guidelines PDF
This slide portrays property management dashboard with KPIs namely, average days on market, properties for sale, properties for rent, sales vs. target and sales by region. Deliver an awe inspiring pitch with this creative Marketing Strategy To Enhance Real Estate Sales On Boarding Touchpoints To Assess Business Performance Guidelines PDF bundle. Topics like Financial Market, Taxation, Product can be discussed with this completely editable template. It is available for immediate download depending on the needs and requirements of the user.
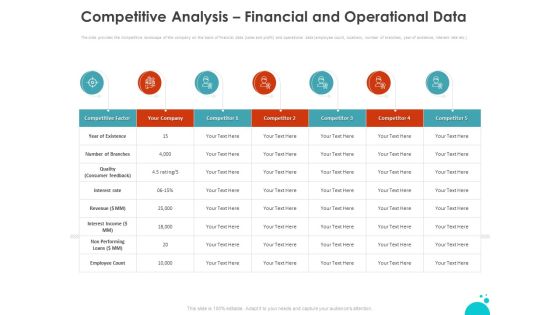
Investment Pitch For Aftermarket Competitive Analysis Financial And Operational Data Ppt PowerPoint Presentation File Structure PDF
Presenting this set of slides with name investment pitch for aftermarket competitive analysis financial and operational data ppt powerpoint presentation file structure pdf. The topics discussed in these slides are competitive factor, competitor, existence, quality consumer feedback, interest rate, revenue, interest income, non performing loans, employee count. This is a completely editable PowerPoint presentation and is available for immediate download. Download now and impress your audience.
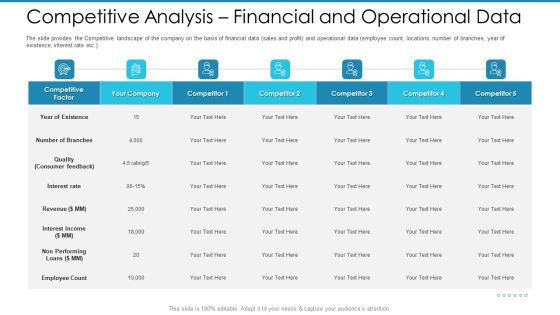
Post Initial Pubic Offering Market Pitch Deck Competitive Analysis Financial And Operational Data Diagrams PDF
The slide provides the Competitive landscape of the company on the basis of financial data sales and profit and operational data employee count, locations, number of branches, year of existence, interest rate etc.Deliver an awe-inspiring pitch with this creative post initial pubic offering market pitch deck competitive analysis financial and operational data diagrams pdf. bundle. Topics like interest rate, revenue interest income, non performing can be discussed with this completely editable template. It is available for immediate download depending on the needs and requirements of the user.

Accounting Advisory Services For Organization Financial Reporting Services Ppt PowerPoint Presentation Outline Portrait PDF
Presenting this set of slides with name accounting advisory services for organization financial reporting services ppt powerpoint presentation outline portrait pdf. The topics discussed in these slides are our services, activities performed, financial reporting performance, financial reporting processes, regulatory compliance. This is a completely editable PowerPoint presentation and is available for immediate download. Download now and impress your audience.

Corporate Execution And Financial Liability Report Table Of Contents Diagrams PDF
Presenting this set of slides with name corporate execution and financial liability report table of contents diagrams pdf. This is a seven stage process. The stages in this process are financial, performance, evaluation, social, responsibility. This is a completely editable PowerPoint presentation and is available for immediate download. Download now and impress your audience.
