Financial Performance Dashboard
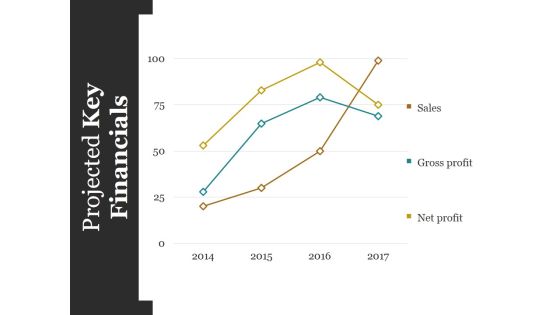
Projected Key Financials Template Ppt PowerPoint Presentation Styles Graphics Design
This is a projected key financials template ppt powerpoint presentation styles graphics design. This is a four stage process. The stages in this process are sales, gross profit, net profit.

AI And ML Driving Monetary Value For Organization Customer Engagement Tracking Kpi Dashboard Pictures PDF
This slide displays customer engagement dashboard. It include key performance indicators namely median lifetime spend. Average churn risk, brand affinities and highly engaged customers. Deliver an awe inspiring pitch with this creative ai and ml driving monetary value for organization customer engagement tracking kpi dashboard pictures pdf bundle. Topics like high earners, high engaged customers, return customers, brand affinities, interests can be discussed with this completely editable template. It is available for immediate download depending on the needs and requirements of the user.

Retail Ecommerce Merchandising Tactics For Boosting Revenue KPI Dashboard To Analyze In Store Merchandising Rules PDF
The following slide outlines a performance key performance indicator KPI dashboard used to evaluate the effectiveness of in-store merchandising strategy. The KPIs covered in the slide are total sales, average inventory, active stores, distinct products sold, etc. Crafting an eye catching presentation has never been more straightforward. Let your presentation shine with this tasteful yet straightforward Retail Ecommerce Merchandising Tactics For Boosting Revenue KPI Dashboard To Analyze In Store Merchandising Rules PDF template. It offers a minimalistic and classy look that is great for making a statement. The colors have been employed intelligently to add a bit of playfulness while still remaining professional. Construct the ideal Retail Ecommerce Merchandising Tactics For Boosting Revenue KPI Dashboard To Analyze In Store Merchandising Rules PDF that effortlessly grabs the attention of your audience. Begin now and be certain to wow your customers.
Shipping And Logistics Tracking Dashboard With Shipments And Fleet Status Pictures PDF
This slide covers Key performance indicators to track the automation system of the company. This dashboard includes Logistics Efficiency Status, delivery time accuracy etc. Deliver an awe inspiring pitch with this creative Shipping And Logistics Tracking Dashboard With Shipments And Fleet Status Pictures PDF bundle. Topics like Profit, Costs, Revenue can be discussed with this completely editable template. It is available for immediate download depending on the needs and requirements of the user.

Optimizing E Business Promotion Plan Dashboard Depicting Metrics Of Digital Marketing Campaign Pictures PDF
This slide shows the dashboard that depicts the metrics used for measuring digital marketing campaign that covers bounce rate, pageviews, conversions, social media followers, etc. Deliver and pitch your topic in the best possible manner with this Optimizing E Business Promotion Plan Dashboard Depicting Metrics Of Digital Marketing Campaign Pictures PDF. Use them to share invaluable insights on Social Media, Revenues, Website Performance and impress your audience. This template can be altered and modified as per your expectations. So, grab it now.

Assessing Impact Of Sales Risk Management With KPI Dashboard Ideas PDF
The following slide highlights some key performance indicators KPIs to measure the influence of executing sales risk management strategies on revenue performance. It includes elements such as target attainment rate, gross profit, annual growth rate etc. Presenting this PowerPoint presentation, titled Assessing Impact Of Sales Risk Management With KPI Dashboard Ideas PDF, with topics curated by our researchers after extensive research. This editable presentation is available for immediate download and provides attractive features when used. Download now and captivate your audience. Presenting this Assessing Impact Of Sales Risk Management With KPI Dashboard Ideas PDF. Our researchers have carefully researched and created these slides with all aspects taken into consideration. This is a completely customizable Assessing Impact Of Sales Risk Management With KPI Dashboard Ideas PDF that is available for immediate downloading. Download now and make an impact on your audience. Highlight the attractive features available with our PPTs.

Assessing Impact Of Sales Risk Management With Kpi Dashboard Formats PDF
The following slide highlights some key performance indicators KPIs to measure the influence of executing sales risk management strategies on revenue performance. It includes elements such as target attainment rate, gross profit, annual growth rate etc. Presenting this PowerPoint presentation, titled Assessing Impact Of Sales Risk Management With Kpi Dashboard Formats PDF, with topics curated by our researchers after extensive research. This editable presentation is available for immediate download and provides attractive features when used. Download now and captivate your audience. Presenting this Assessing Impact Of Sales Risk Management With Kpi Dashboard Formats PDF. Our researchers have carefully researched and created these slides with all aspects taken into consideration. This is a completely customizable Assessing Impact Of Sales Risk Management With Kpi Dashboard Formats PDF that is available for immediate downloading. Download now and make an impact on your audience. Highlight the attractive features available with our PPTs.

Assessing Impact Of Sales Risk Management With KPI Dashboard Guidelines PDF
The following slide highlights some key performance indicators KPIs to measure the influence of executing sales risk management strategies on revenue performance. It includes elements such as target attainment rate, gross profit, annual growth rate etc. Presenting this PowerPoint presentation, titled Assessing Impact Of Sales Risk Management With KPI Dashboard Guidelines PDF, with topics curated by our researchers after extensive research. This editable presentation is available for immediate download and provides attractive features when used. Download now and captivate your audience. Presenting this Assessing Impact Of Sales Risk Management With KPI Dashboard Guidelines PDF. Our researchers have carefully researched and created these slides with all aspects taken into consideration. This is a completely customizable Assessing Impact Of Sales Risk Management With KPI Dashboard Guidelines PDF that is available for immediate downloading. Download now and make an impact on your audience. Highlight the attractive features available with our PPTs.
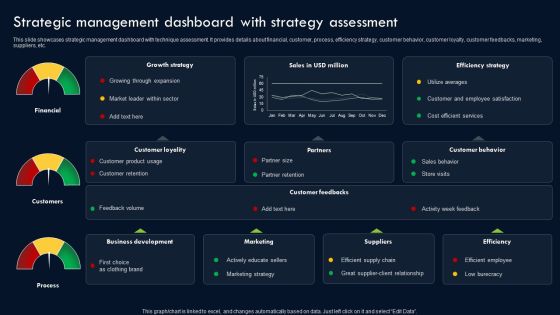
Transforming Sustainability Into Competitive Strategic Management Dashboard With Strategy Assessment Summary PDF
This slide showcases strategic management dashboard with technique assessment. It provides details about financial, customer, process, efficiency strategy, customer behavior, customer loyalty, customer feedbacks, marketing, suppliers, etc. From laying roadmaps to briefing everything in detail, our templates are perfect for you. You can set the stage with your presentation slides. All you have to do is download these easy-to-edit and customizable templates. Transforming Sustainability Into Competitive Strategic Management Dashboard With Strategy Assessment Summary PDF will help you deliver an outstanding performance that everyone would remember and praise you for. Do download this presentation today.
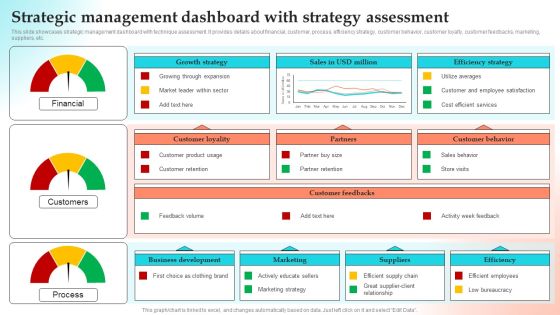
Implementing Strategies To Gain Competitive Advantage Strategic Management Dashboard With Strategy Assessment Inspiration PDF
This slide showcases strategic management dashboard with technique assessment. It provides details about financial, customer, process, efficiency strategy, customer behavior, customer loyalty, customer feedbacks, marketing, suppliers, etc. From laying roadmaps to briefing everything in detail, our templates are perfect for you. You can set the stage with your presentation slides. All you have to do is download these easy to edit and customizable templates. Implementing Strategies To Gain Competitive Advantage Strategic Management Dashboard With Strategy Assessment Inspiration PDF will help you deliver an outstanding performance that everyone would remember and praise you for. Do download this presentation today.
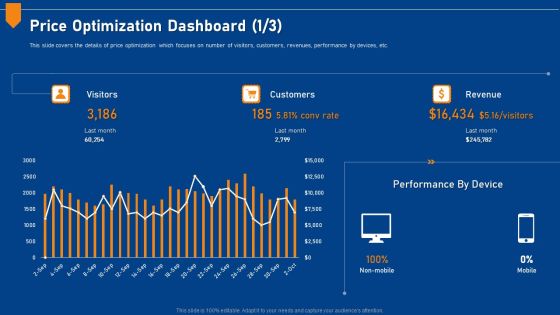
Evaluating Price Efficiency In Organization Price Optimization Dashboard Customers Microsoft PDF
This slide covers the details of price optimization which focuses on number of visitors, customers, revenues, performance by devices, etc. Deliver and pitch your topic in the best possible manner with this evaluating price efficiency in organization price optimization dashboard customers microsoft pdf. Use them to share invaluable insights on visitors, customers, revenue and impress your audience. This template can be altered and modified as per your expectations. So, grab it now.

BI Technique For Data Informed Decisions Sap Analytics Cloud Dashboard For Product Sales Analysis Sample PDF
This slide illustrates the SAP Analytics Cloud dashboard to monitor product sales performance. It provides information regarding the gross margin and net revenue earned, product performance state wise and year wise. Welcome to our selection of the Budget Plan For BI Technique For Data Informed Decisions Clipart PDF. These are designed to help you showcase your creativity and bring your sphere to life. Planning and Innovation are essential for any business that is just starting out. This collection contains the designs that you need for your everyday presentations. All of our PowerPoints are 100 percent editable, so you can customize them to suit your needs. This multi purpose template can be used in various situations. Grab these presentation templates today.

Assessing Impact Of Sales Risk Management With Kpi Dashboard Diagrams PDF
The following slide highlights some key performance indicators KPIs to measure the influence of executing sales risk management strategies on revenue performance. It includes elements such as target attainment rate, gross profit, annual growth rate etc. Boost your pitch with our creative Assessing Impact Of Sales Risk Management With Kpi Dashboard Diagrams PDF. Deliver an awe inspiring pitch that will mesmerize everyone. Using these presentation templates you will surely catch everyones attention. You can browse the ppts collection on our website. We have researchers who are experts at creating the right content for the templates. So you do not have to invest time in any additional work. Just grab the template now and use them.

Assessing Impact Of Sales Risk Management With KPI Dashboard Ppt Professional Graphics Pictures PDF
The following slide highlights some key performance indicators KPIs to measure the influence of executing sales risk management strategies on revenue performance. It includes elements such as target attainment rate, gross profit, annual growth rate etc. Are you in need of a template that can accommodate all of your creative concepts This one is crafted professionally and can be altered to fit any style. Use it with Google Slides or PowerPoint. Include striking photographs, symbols, depictions, and other visuals. Fill, move around, or remove text boxes as desired. Test out color palettes and font mixtures. Edit and save your work, or work with colleagues. Download Assessing Impact Of Sales Risk Management With KPI Dashboard Ppt Professional Graphics Pictures PDF and observe how to make your presentation outstanding. Give an impeccable presentation to your group and make your presentation unforgettable.

Procurement Strategies For Reducing Stock Wastage Dashboard For Managing Warehouse Infographics PDF
This slide showcases dashboard that can help organization to manage and track the warehouse operations. Its key elements are order, volume, inventory, monthly KPIs and global financial performance. Here you can discover an assortment of the finest PowerPoint and Google Slides templates. With these templates, you can create presentations for a variety of purposes while simultaneously providing your audience with an eye catching visual experience. Download Procurement Strategies For Reducing Stock Wastage Dashboard For Managing Warehouse Infographics PDF to deliver an impeccable presentation. These templates will make your job of preparing presentations much quicker, yet still, maintain a high level of quality. Slidegeeks has experienced researchers who prepare these templates and write high quality content for you. Later on, you can personalize the content by editing the Procurement Strategies For Reducing Stock Wastage Dashboard For Managing Warehouse Infographics PDF.

Data Quality Dashboard For Linked Data Integrating Linked Data To Enhance Operational Template PDF
This slide describes the data quality dashboard for linked data by covering details of account information quality, contact details quality, financial data quality, and missing account information.This Data Quality Dashboard For Linked Data Integrating Linked Data To Enhance Operational Template PDF from Slidegeeks makes it easy to present information on your topic with precision. It provides customization options, so you can make changes to the colors, design, graphics, or any other component to create a unique layout. It is also available for immediate download, so you can begin using it right away. Slidegeeks has done good research to ensure that you have everything you need to make your presentation stand out. Make a name out there for a brilliant performance.
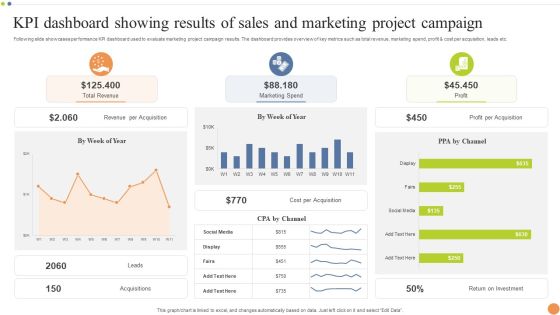
KPI Dashboard Showing Results Of Sales And Marketing Project Campaign Formats PDF
Following slide showcases performance KPI dashboard used to evaluate marketing project campaign results. The dashboard provides overview of key metrics such as total revenue, marketing spend, profit and cost per acquisition, leads etc. Showcasing this set of slides titled KPI Dashboard Showing Results Of Sales And Marketing Project Campaign Formats PDF. The topics addressed in these templates are Marketing Spend, Revenue, Profit Per Acquisition. All the content presented in this PPT design is completely editable. Download it and make adjustments in color, background, font etc. as per your unique business setting.
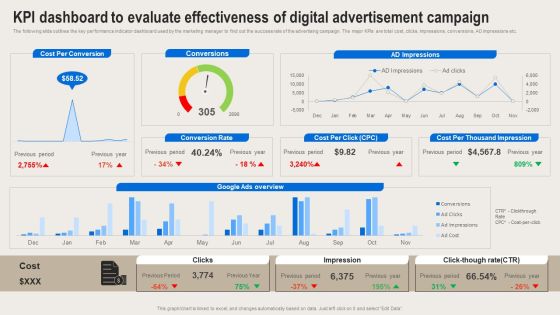
Formulating Branding Strategy To Enhance Revenue And Sales KPI Dashboard To Evaluate Effectivenessl Clipart PDF
The following slide outlines the key performance indicator dashboard used by the marketing manager to find out the success rate of the advertising campaign. The major KPIs are total cost, clicks, impressions, conversions, AD impressions etc. There are so many reasons you need a Formulating Branding Strategy To Enhance Revenue And Sales KPI Dashboard To Evaluate Effectivenessl Clipart PDF. The first reason is you cannot spend time making everything from scratch, Thus, Slidegeeks has made presentation templates for you too. You can easily download these templates from our website easily.

KPI Metrics Dashboard To Analyze The Effectiveness Of New Introducing New Food Pictures PDF
The following slide outlines key performance indicator KPI dashboard which can be used to measure the success of product launch. The KPIs are total units, revenue, average selling price ASP, number of penetrated planned customers etc. Make sure to capture your audiences attention in your business displays with our gratis customizable KPI Metrics Dashboard To Analyze The Effectiveness Of New Introducing New Food Pictures PDF. These are great for business strategies, office conferences, capital raising or task suggestions. If you desire to acquire more customers for your tech business and ensure they stay satisfied, create your own sales presentation with these plain slides.
Sales L2RM System Tracking Key Metrics Dashboard Ppt Professional Format Ideas PDF
This slide represents the dashboard for tracking the key performance indicators of sales lead to revenue management. It includes key metrics such as leads by campaign, ratings, lead generation rate, top accounts by revenue and top owners by number of accounts. Showcasing this set of slides titled Sales L2RM System Tracking Key Metrics Dashboard Ppt Professional Format Ideas PDF. The topics addressed in these templates are Leads By Campaign, Leads By Rating, Leads Generation Rate. All the content presented in this PPT design is completely editable. Download it and make adjustments in color, background, font etc. as per your unique business setting.
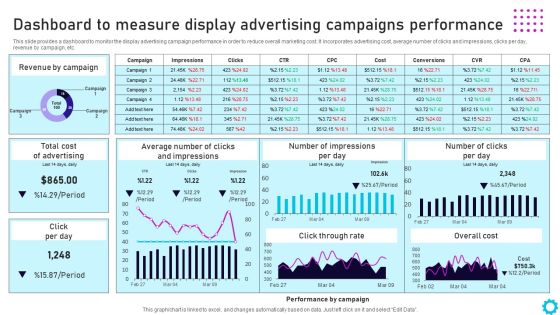
Complete Guide For Display Dashboard To Measure Display Advertising Campaigns Themes PDF
This slide provides a dashboard to monitor the display advertising campaign performance in order to reduce overall marketing cost. It incorporates advertising cost, average number of clicks and impressions, clicks per day, revenue by campaign, etc. Make sure to capture your audiences attention in your business displays with our gratis customizable Complete Guide For Display Dashboard To Measure Display Advertising Campaigns Themes PDF. These are great for business strategies, office conferences, capital raising or task suggestions. If you desire to acquire more customers for your tech business and ensure they stay satisfied, create your own sales presentation with these plain slides.

Customer Success KPIS Overview Dashboard For Technical Support Team Ppt PowerPoint Presentation Gallery Layouts PDF
This slide covers dashboard with parameters to monitor performance for customer success programs. It includes percentage of customers helped, team report metrics, new customers, MRR, revenue churn, cancellation and refunds. Showcasing this set of slides titled Customer Success KPIS Overview Dashboard For Technical Support Team Ppt PowerPoint Presentation Gallery Layouts PDF. The topics addressed in these templates are Customer, Cancelations, New Customer, Revenue Churn. All the content presented in this PPT design is completely editable. Download it and make adjustments in color, background, font etc. as per your unique business setting.
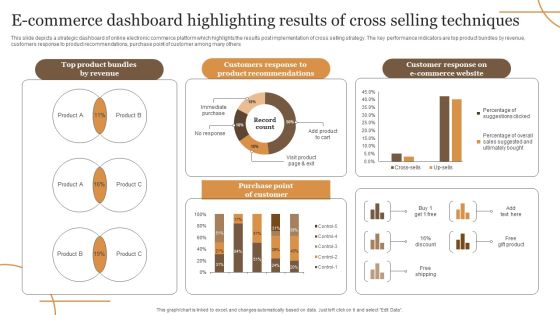
E Commerce Dashboard Highlighting Results Of Cross Selling Techniques Elements PDF
This slide depicts a strategic dashboard of online electronic commerce platform which highlights the results post implementation of cross selling strategy. The key performance indicators are top product bundles by revenue, customers response to product recommendations, purchase point of customer among many others. Showcasing this set of slides titled E Commerce Dashboard Highlighting Results Of Cross Selling Techniques Elements PDF. The topics addressed in these templates are Revenue, E Commerce Website, Purchase. All the content presented in this PPT design is completely editable. Download it and make adjustments in color, background, font etc. as per your unique business setting.
Illustrating Product Leadership Plan Incorporating Innovative Techniques Dashboard Depicting Sales Icons PDF
This slide focuses on dashboard that depicts sales product performance that includes top products in revenues, online verses offline purchases, incremental sales by campaign and cost of goods sold. Deliver an awe inspiring pitch with this creative illustrating product leadership plan incorporating innovative techniques dashboard depicting sales icons pdf bundle. Topics like incremental sales by campaign, top products in revenue, online vs offline purchases, cost of goods sold can be discussed with this completely editable template. It is available for immediate download depending on the needs and requirements of the user.

Successful Staff Retention Techniques KPI Metrics Dashboard Highlighting Employee Retention Rate Pictures PDF
The purpose of this slide is to exhibit a key performance indicator KPI dashboard through which managers can analyze the monthly employee retention rate. The metrics covered in the slide are active employees, new candidates hired, internal, exit, employee turnover rate, etc. Make sure to capture your audiences attention in your business displays with our gratis customizable Successful Staff Retention Techniques KPI Metrics Dashboard Highlighting Employee Retention Rate Pictures PDF. These are great for business strategies, office conferences, capital raising or task suggestions. If you desire to acquire more customers for your tech business and ensure they stay satisfied, create your own sales presentation with these plain slides.

Action Plan To Enhance Client Service Customer Service Dashboard To Monitor Kpis Clipart PDF
This slide showcases support service dashboard to track relevant performance metrics. Major KPIs covered are customer satisfaction, average time to resolve problem, cost per support, customer retention, request volume, etc. Make sure to capture your audiences attention in your business displays with our gratis customizable Action Plan To Enhance Client Service Customer Service Dashboard To Monitor Kpis Clipart PDF. These are great for business strategies, office conferences, capital raising or task suggestions. If you desire to acquire more customers for your tech business and ensure they stay satisfied, create your own sales presentation with these plain slides.
Implementing Change Management Strategy To Transform Business Processes Dashboard Depicting Kpis To Track Icons PDF
This slide covers the dashboard that depicts metrics to track company sales performance that focuses on number of sales, cost breakdown, accumulated revenues, incremental sales, etc. Boost your pitch with our creative Implementing Change Management Strategy To Transform Business Processes Dashboard Depicting Kpis To Track Icons PDF. Deliver an awe-inspiring pitch that will mesmerize everyone. Using these presentation templates you will surely catch everyones attention. You can browse the ppts collection on our website. We have researchers who are experts at creating the right content for the templates. So you do not have to invest time in any additional work. Just grab the template now and use them.

L2RM System Analysis KPI Dashboard Ppt PowerPoint Presentation File Microsoft PDF
This slide represents the dashboard showing the key performance indicators of the lead to revenue management. It includes key metrics such as cost per lead, cost per customers, customer lifetime value and returns on marketing investment. Presenting L2RM System Analysis KPI Dashboard Ppt PowerPoint Presentation File Microsoft PDF to dispense important information. This template comprises one stages. It also presents valuable insights into the topics including Audience, Prospects, Lead Conversion Funnel. This is a completely customizable PowerPoint theme that can be put to use immediately. So, download it and address the topic impactfully.

KPI Dashboard To Track Corporate Sales From Various Channels Information PDF
This slide shows KPI dashboard which can be used by organizations to monitor sales performance of various channels. It includes various metrics such as total revenue, total profit, monthly sales revenue, cost breakup, etc. Showcasing this set of slides titled KPI Dashboard To Track Corporate Sales From Various Channels Information PDF. The topics addressed in these templates are Track Corporate Sales, Various Channels. All the content presented in this PPT design is completely editable. Download it and make adjustments in color, background, font etc. as per your unique business setting.

Dashboard To Track Progress Post Implementing Drug Launch Strategy Slides PDF
Following dashboard provides a brief overview of progress post implementing drug launch strategy which can be used by medical representatives to monitor the effectiveness. The key performance indicators are units sold, target, revenue, units unsold etc. Showcasing this set of slides titled Dashboard To Track Progress Post Implementing Drug Launch Strategy Slides PDF. The topics addressed in these templates are Planning, Design, Development, Testing, Launch. All the content presented in this PPT design is completely editable. Download it and make adjustments in color, background, font etc. as per your unique business setting.
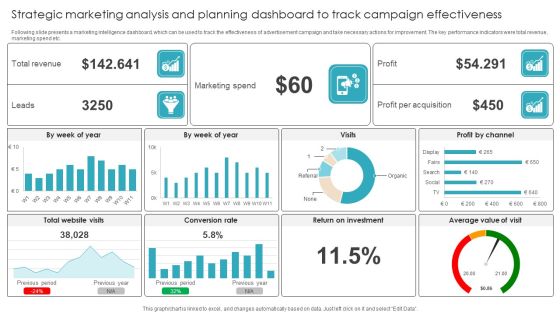
Strategic Marketing Analysis And Planning Dashboard To Track Campaign Effectiveness Summary PDF
Following slide presents a marketing intelligence dashboard, which can be used to track the effectiveness of advertisement campaign and take necessary actions for improvement. The key performance indicators were total revenue, marketing spend etc. Showcasing this set of slides titled Strategic Marketing Analysis And Planning Dashboard To Track Campaign Effectiveness Summary PDF. The topics addressed in these templates are Marketing Spend, Conversion Rate, Return Investment. All the content presented in this PPT design is completely editable. Download it and make adjustments in color, background, font etc. as per your unique business setting.
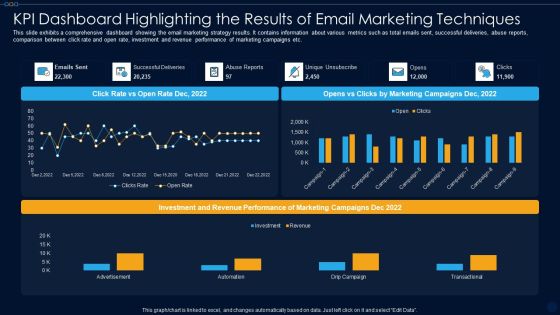
KPI Dashboard Highlighting The Results Of Email Marketing Techniques Ppt PowerPoint Presentation File Format PDF
This slide exhibits a comprehensive dashboard showing the email marketing strategy results. It contains information about various metrics such as total emails sent, successful deliveries, abuse reports, comparison between click rate and open rate, investment and revenue performance of marketing campaigns etc. Showcasing this set of slides titled kpi dashboard highlighting the results of email marketing techniques ppt powerpoint presentation file format pdf. The topics addressed in these templates are advertisement, automation, drip campaign, transactional. All the content presented in this PPT design is completely editable. Download it and make adjustments in color, background, font etc. as per your unique business setting.

Creating Content Marketing Technique For Brand Promotions Content Marketing Lead Tracking Dashboard Themes PDF
This slide showcases dashboard used to track leads generated from implementing content marketing strategy. Key metrics evaluated are total visitors, leads generated, qualified leads, revenue generated, bounce rate and customer churn rate. From laying roadmaps to briefing everything in detail, our templates are perfect for you. You can set the stage with your presentation slides. All you have to do is download these easy-to-edit and customizable templates. Creating Content Marketing Technique For Brand Promotions Content Marketing Lead Tracking Dashboard Themes PDF will help you deliver an outstanding performance that everyone would remember and praise you for. Do download this presentation today.
Strategies For Marketing Dashboard For Tracking Brand Awareness Advertisement Themes PDF
This slide showcases dashboard that can help organization to track results of online advertisement campaigns. Its key components ad impressions, click through rate, cost per conversion, revenue per click, impressions, new users and sessions. From laying roadmaps to briefing everything in detail, our templates are perfect for you. You can set the stage with your presentation slides. All you have to do is download these easy-to-edit and customizable templates. Strategies For Marketing Dashboard For Tracking Brand Awareness Advertisement Themes PDF will help you deliver an outstanding performance that everyone would remember and praise you for. Do download this presentation today.

Dashboard To Evaluate Display Advertising Source Conversion And Cost Ppt Styles Icon PDF
This slide provides a dashboard to assess the rate of conversion and cost of display advertising campaign by different sources. It includes source, average cost of marketing, conversion, click, revenue, impression by source. From laying roadmaps to briefing everything in detail, our templates are perfect for you. You can set the stage with your presentation slides. All you have to do is download these easy to edit and customizable templates. Dashboard To Evaluate Display Advertising Source Conversion And Cost Ppt Styles Icon PDF will help you deliver an outstanding performance that everyone would remember and praise you for. Do download this presentation today.

Construction Expenses Dashboard With Progress Report And Budget Development Background PDF
This slide displays construction analytics for a specific project to track capital project outcomes, reduce risks, and uncover critical insights. It includes information such as contract and client name, schedule performance index and construction price index. Showcasing this set of slides titled Construction Expenses Dashboard With Progress Report And Budget Development Background PDF. The topics addressed in these templates are Budget Development, Execution Status, Commercial Store. All the content presented in this PPT design is completely editable. Download it and make adjustments in color, background, font etc. as per your unique business setting.

Complete Guide To Product Pricing Techniques Price Optimization Dashboard Rules PDF
This template covers the details of price optimization which focuses on number of visitors, customers, revenues, performance by devices, etc. Take your projects to the next level with our ultimate collection of Complete Guide To Product Pricing Techniques Price Optimization Dashboard Rules PDF. Slidegeeks has designed a range of layouts that are perfect for representing task or activity duration, keeping track of all your deadlines at a glance. Tailor these designs to your exact needs and give them a truly corporate look with your own brand colors they will make your projects stand out from the rest.

Measuring Net Retention And Revenue Churn With KPI Dashboard Introduction PDF
Mentioned slide outlines a comprehensive dashboard outlining the results of customer churn prevention strategies. The key performance indicators KPIs covered in the slide are net promoter score NPS, loyal customer rate, customer lifetime value CLV, revenue churn, net retention rate, etc. Do you have to make sure that everyone on your team knows about any specific topic I yes, then you should give Measuring Net Retention And Revenue Churn With KPI Dashboard Introduction PDF a try. Our experts have put a lot of knowledge and effort into creating this impeccable Measuring Net Retention And Revenue Churn With KPI Dashboard Introduction PDF. You can use this template for your upcoming presentations, as the slides are perfect to represent even the tiniest detail. You can download these templates from the Slidegeeks website and these are easy to edit. So grab these today.

KPI Metrics Dashboard To Measure Success Of Customer Churn Prevention Strategies Diagrams PDF
Mentioned slide outlines a key performance indicator KPI dashboard which will assist managers to showcase the result of customer attrition prevention strategies. The KPIs are risky customers, retention rate, monthly recurring revenue MRR, churn risk by location and income, etc. This KPI Metrics Dashboard To Measure Success Of Customer Churn Prevention Strategies Diagrams PDF is perfect for any presentation, be it in front of clients or colleagues. It is a versatile and stylish solution for organizing your meetings. The KPI Metrics Dashboard To Measure Success Of Customer Churn Prevention Strategies Diagrams PDF features a modern design for your presentation meetings. The adjustable and customizable slides provide unlimited possibilities for acing up your presentation. Slidegeeks has done all the homework before launching the product for you. So, do not wait, grab the presentation templates today

Comprehensive Sports Event Marketing Plan Sports Event Marketing KPI Dashboard Introduction PDF
This slide represents KPI dashboard to measure and monitor the performance of sports event marketing. It includes details related to KPIs such as revenue, attendance etc. in last 5 games. Do you have to make sure that everyone on your team knows about any specific topic I yes, then you should give Comprehensive Sports Event Marketing Plan Sports Event Marketing KPI Dashboard Introduction PDF a try. Our experts have put a lot of knowledge and effort into creating this impeccable Comprehensive Sports Event Marketing Plan Sports Event Marketing KPI Dashboard Introduction PDF. You can use this template for your upcoming presentations, as the slides are perfect to represent even the tiniest detail. You can download these templates from the Slidegeeks website and these are easy to edit. So grab these today

Field Marketing Strategies To Boost Product Sales Dashboard To Track Retail Store Marketing Download PDF
This slide showcases dashboard that can help organization to evaluate the performance of retail outlet after implementing in store promotional campaign. Its key elements are sales revenue, customers, average transaction value, sales by city etc. Do you have an important presentation coming up Are you looking for something that will make your presentation stand out from the rest Look no further than Field Marketing Strategies To Boost Product Sales Dashboard To Track Retail Store Marketing Download PDF. With our professional designs, you can trust that your presentation will pop and make delivering it a smooth process. And with Slidegeeks, you can trust that your presentation will be unique and memorable. So why wait Grab Field Marketing Strategies To Boost Product Sales Dashboard To Track Retail Store Marketing Download PDF today and make your presentation stand out from the rest.

Measuring Net Retention And Revenue Churn With Kpi Dashboard Ideas PDF
Mentioned slide outlines a comprehensive dashboard outlining the results of customer churn prevention strategies. The key performance indicators KPIs covered in the slide are net promoter score NPS, loyal customer rate, customer lifetime value CLV, revenue churn, net retention rate, etc. The Measuring Net Retention And Revenue Churn With Kpi Dashboard Ideas PDF is a compilation of the most recent design trends as a series of slides. It is suitable for any subject or industry presentation, containing attractive visuals and photo spots for businesses to clearly express their messages. This template contains a variety of slides for the user to input data, such as structures to contrast two elements, bullet points, and slides for written information. Slidegeeks is prepared to create an impression.
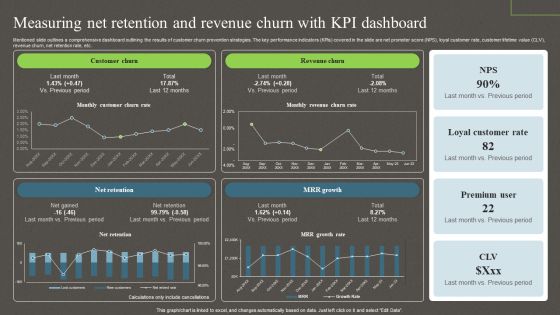
Measuring Net Retention And Revenue Churn With Kpi Dashboard Ppt PowerPoint Presentation File Backgrounds PDF
Mentioned slide outlines a comprehensive dashboard outlining the results of customer churn prevention strategies. The key performance indicators KPIs covered in the slide are net promoter score NPS, loyal customer rate, customer lifetime value CLV, revenue churn, net retention rate, etc. Boost your pitch with our creative Measuring Net Retention And Revenue Churn With Kpi Dashboard Ppt PowerPoint Presentation File Backgrounds PDF. Deliver an awe inspiring pitch that will mesmerize everyone. Using these presentation templates you will surely catch everyones attention. You can browse the ppts collection on our website. We have researchers who are experts at creating the right content for the templates. So you do not have to invest time in any additional work. Just grab the template now and use them.

Implementing Digital Transformation Kpi Dashboard To Track Digital Transformation Initiatives Structure PDF
Following slide provides dashboard that can be used by the businesses to measure the performance of digital transformation initiatives with the help of different KPIs. KPIs covered are social presence, click through rate, sales revenue, churn amount etc. The Implementing Digital Transformation Kpi Dashboard To Track Digital Transformation Initiatives Structure PDF is a compilation of the most recent design trends as a series of slides. It is suitable for any subject or industry presentation, containing attractive visuals and photo spots for businesses to clearly express their messages. This template contains a variety of slides for the user to input data, such as structures to contrast two elements, bullet points, and slides for written information. Slidegeeks is prepared to create an impression.
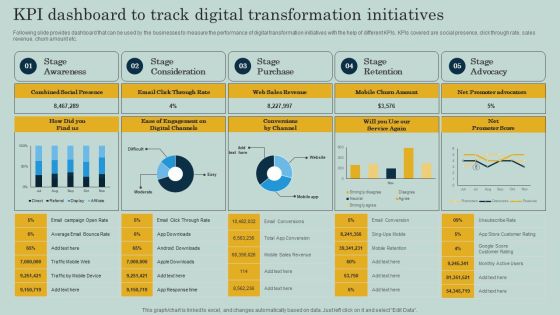
KPI Dashboard To Track Digital Transformation Initiatives Ppt Show Backgrounds PDF
Following slide provides dashboard that can be used by the businesses to measure the performance of digital transformation initiatives with the help of different KPIs. KPIs covered are social presence, click through rate, sales revenue, churn amount etc. The KPI Dashboard To Track Digital Transformation Initiatives Ppt Show Backgrounds PDF is a compilation of the most recent design trends as a series of slides. It is suitable for any subject or industry presentation, containing attractive visuals and photo spots for businesses to clearly express their messages. This template contains a variety of slides for the user to input data, such as structures to contrast two elements, bullet points, and slides for written information. Slidegeeks is prepared to create an impression.
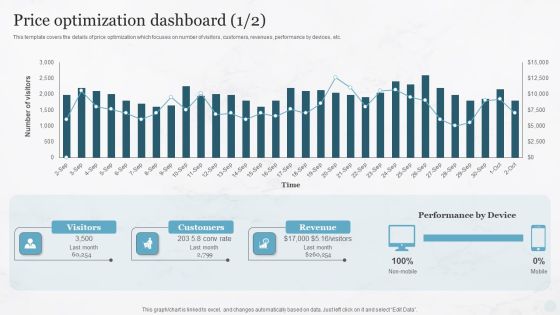
Price Optimization Dashboard Pricing Strategies For New Product In Market Infographics PDF
This template covers the details of price optimization which focuses on number of visitors, customers, revenues, performance by devices, etc.Find highly impressive Price Optimization Dashboard Pricing Strategies For New Product In Market Infographics PDF on Slidegeeks to deliver a meaningful presentation. You can save an ample amount of time using these presentation templates. No need to worry to prepare everything from scratch because Slidegeeks experts have already done a huge research and work for you. You need to download Price Optimization Dashboard Pricing Strategies For New Product In Market Infographics PDF for your upcoming presentation. All the presentation templates are 100precent editable and you can change the color and personalize the content accordingly. Download now.

KPI Dashboard To Track Digital Transformation Initiatives Ppt Styles Graphics PDF
Following slide provides dashboard that can be used by the businesses to measure the performance of digital transformation initiatives with the help of different KPIs. KPIs covered are social presence, click through rate, sales revenue, churn amount etc. Take your projects to the next level with our ultimate collection of KPI Dashboard To Track Digital Transformation Initiatives Ppt Styles Graphics PDF. Slidegeeks has designed a range of layouts that are perfect for representing task or activity duration, keeping track of all your deadlines at a glance. Tailor these designs to your exact needs and give them a truly corporate look with your own brand colors they will make your projects stand out from the rest.
Playbook For Advancing Technology Managing It Services Spending Tracking Dashboard Clipart PDF
This slide provides information regarding the management of the digital services performance and IT spending tracking dashboard in terms of ROI, spend vs. budget, IT costs software, hardware, personnel and goals, IT spending in terms of revenues, etc. Are you in need of a template that can accommodate all of your creative concepts This one is crafted professionally and can be altered to fit any style. Use it with Google Slides or PowerPoint. Include striking photographs, symbols, depictions, and other visuals. Fill, move around, or remove text boxes as desired. Test out color palettes and font mixtures. Edit and save your work, or work with colleagues. Download Playbook For Advancing Technology Managing It Services Spending Tracking Dashboard Clipart PDF and observe how to make your presentation outstanding. Give an impeccable presentation to your group and make your presentation unforgettable.
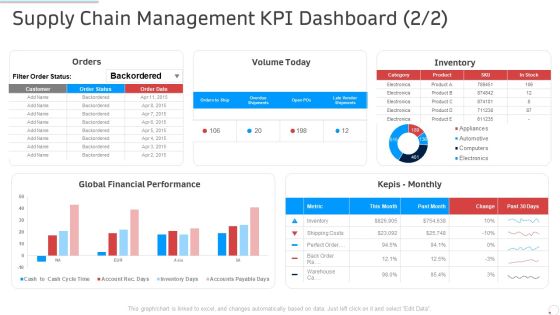
Supply Chain Management Kpi Dashboard Manufacturing Control Ppt Outline Picture PDF
Deliver an awe inspiring pitch with this creative supply chain management kpi dashboard manufacturing control ppt outline picture pdf bundle. Topics like global, financial, performance, inventory can be discussed with this completely editable template. It is available for immediate download depending on the needs and requirements of the user.
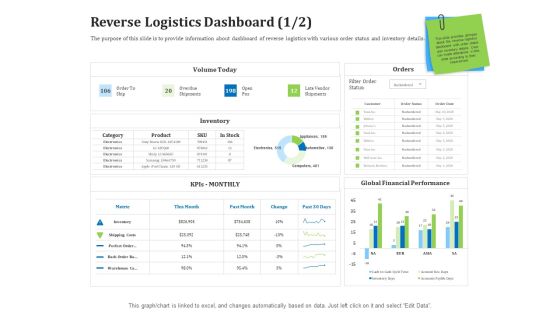
Reverse Logistics Management Reverse Logistics Dashboard Days Ppt Infographics Files PDF
The purpose of this slide is to provide information about dashboard of reverse logistics with various order status and inventory details. Deliver an awe inspiring pitch with this creative reverse logistics management reverse logistics dashboard days ppt infographics files pdf bundle. Topics like global, financial, performance, metric, inventory can be discussed with this completely editable template. It is available for immediate download depending on the needs and requirements of the user.

Dashboard To Depict Strategic B2B Communication Rollout Plan Success Portrait PDF
This slide consists of a dashboard that can be used to depict the success of a B2B communication rollout. Key performing indicators included in the slide are products sold, total revenue, client satisfaction, net profit, etc. Showcasing this set of slides titled Dashboard To Depict Strategic B2B Communication Rollout Plan Success Portrait PDF. The topics addressed in these templates are Product Sold, Total Revenue, B2b Client Satisfication. All the content presented in this PPT design is completely editable. Download it and make adjustments in color, background, font etc. as per your unique business setting.

Sales Optimization Best Practices To Close More Deals Sales KPI Dashboard Revenue Diagrams PDF
The sales dashboard is an effective tool that helps in monitoring various sales KPIs in order to aid sales teams in reaching sales goals by analyzing the sales performance. Deliver an awe inspiring pitch with this creative sales optimization best practices to close more deals sales kpi dashboard revenue diagrams pdf bundle. Topics like sales kpi dashboard can be discussed with this completely editable template. It is available for immediate download depending on the needs and requirements of the user.

Capital Investment Options KPI Dashboard To Monitor Project Status Summary PDF
Following slide illustrates KPI dashboard for monitoring the project performance. KPIs covered in the dashboard are project progress and task status, project health and project timeline. Deliver an awe inspiring pitch with this creative Capital Investment Options KPI Dashboard To Monitor Project Status Summary PDF bundle. Topics like Analysis, Development, Testing, Implement can be discussed with this completely editable template. It is available for immediate download depending on the needs and requirements of the user.

Sales Department Strategies Increase Revenues Sales KPI Dashboard Email Ppt Outline Microsoft PDF
The sales dashboard is an effective tool that helps in monitoring various sales KPIs in order to aid sales teams in reaching sales goals by analyzing the sales performance. Deliver an awe-inspiring pitch with this creative sales department strategies increase revenues sales kpi dashboard email ppt outline microsoft pdf bundle. Topics like sales revenue, cost breakdown, marketing can be discussed with this completely editable template. It is available for immediate download depending on the needs and requirements of the user.

Communication Barriers Manager Dashboard For Analyzing Ppt PowerPoint Presentation Inspiration Grid PDF
This slide represents the dashboard of communication manager. It includes KPIs such as current conversation, performance, customers and opportunities.Pitch your topic with ease and precision using this Communication Barriers Manager Dashboard For Analyzing Ppt PowerPoint Presentation Inspiration Grid PDF. This layout presents information on Current Conversation, Economic Indicator, Conversation Calls. It is also available for immediate download and adjustment. So, changes can be made in the color, design, graphics or any other component to create a unique layout.
Strategic Brand Management Customer Tracking Dashboard To Monitor Brand Loyalty Mockup PDF
This slide provides information brand loyalty tracking dashboard in order to monitor customer engagement, average revenues, new vs. returning visitors performance, etc. Deliver and pitch your topic in the best possible manner with this Strategic Brand Management Customer Tracking Dashboard To Monitor Brand Loyalty Mockup PDF. Use them to share invaluable insights on Avg Revenue, Visit Frequency, Returning Visitors, Value Comparison and impress your audience. This template can be altered and modified as per your expectations. So, grab it now.

Sales Assistance Boost Overall Efficiency Sales KPI Dashboard Ppt Pictures File Formats PDF
The sales dashboard is an effective tool that helps in monitoring various sales KPIs in order to aid sales teams in reaching sales goals by analyzing the sales performance. Deliver an awe-inspiring pitch with this creative sales assistance boost overall efficiency sales kpi dashboard ppt pictures file formats pdf bundle. Topics like sales revenue, cost breakdown, incremental sales can be discussed with this completely editable template. It is available for immediate download depending on the needs and requirements of the user.

Product Sales Analysis Dashboard Report Ppt PowerPoint Presentation Infographics Graphics Pictures PDF
Presenting this set of slides with name product sales analysis dashboard report ppt powerpoint presentation infographics graphics pictures pdf. The topics discussed in these slides are average operative costs, product models performance, production last year, sales by month, taxed amount. This is a completely editable PowerPoint presentation and is available for immediate download. Download now and impress your audience.
Successful Brand Management Customer Tracking Dashboard To Monitor Brand Loyalty Elements PDF
This slide provides information brand loyalty tracking dashboard in order to monitor customer engagement, average revenues, new vs. returning visitors performance, etc. This Successful Brand Management Customer Tracking Dashboard To Monitor Brand Loyalty Elements PDF is perfect for any presentation, be it in front of clients or colleagues. It is a versatile and stylish solution for organizing your meetings. The Successful Brand Management Customer Tracking Dashboard To Monitor Brand Loyalty Elements PDF features a modern design for your presentation meetings. The adjustable and customizable slides provide unlimited possibilities for acing up your presentation. Slidegeeks has done all the homework before launching the product for you. So, dont wait, grab the presentation templates today.

Core Components Of Strategic Brand Administration Customer Tracking Dashboard Demonstration PDF
This slide provides information brand loyalty tracking dashboard in order to monitor customer engagement, average revenues, new vs. returning visitors performance, etc. Create an editable Core Components Of Strategic Brand Administration Customer Tracking Dashboard Demonstration PDF that communicates your idea and engages your audience. Whether you are presenting a business or an educational presentation, pre-designed presentation templates help save time. Core Components Of Strategic Brand Administration Customer Tracking Dashboard Demonstration PDF is highly customizable and very easy to edit, covering many different styles from creative to business presentations. Slidegeeks has creative team members who have crafted amazing templates. So, go and get them without any delay.
Sales Department Strategies Increase Revenues Sales KPI Dashboard Ppt Icon Visual Aids PDF
The sales dashboard is an effective tool that helps in monitoring various sales KPIs in order to aid sales teams in reaching sales goals by analyzing the sales performance. Deliver and pitch your topic in the best possible manner with this sales department strategies increase revenues sales kpi dashboard ppt icon visual aids pdf. Use them to share invaluable insights on average revenue, customer lifetime value, customer acquisition cost and impress your audience. This template can be altered and modified as per your expectations. So, grab it now.
Key Elements Of Strategic Brand Administration Customer Tracking Dashboard To Monitor Brand Loyalty Information PDF
This slide provides information brand loyalty tracking dashboard in order to monitor customer engagement, average revenues, new vs. returning visitors performance, etc. Make sure to capture your audiences attention in your business displays with our gratis customizable Key Elements Of Strategic Brand Administration Customer Tracking Dashboard To Monitor Brand Loyalty Information PDF. These are great for business strategies, office conferences, capital raising or task suggestions. If you desire to acquire more customers for your tech business and ensure they stay satisfied, create your own sales presentation with these plain slides.
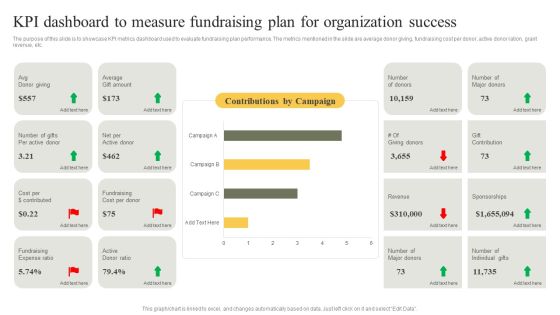
KPI Dashboard To Measure Fundraising Plan For Organization Success Infographics PDF
The purpose of this slide is to showcase KPI metrics dashboard used to evaluate fundraising plan performance. The metrics mentioned in the slide are average donor giving, fundraising cost per donor, active donor ration, grant revenue, etc. Showcasing this set of slides titled KPI Dashboard To Measure Fundraising Plan For Organization Success Infographics PDF. The topics addressed in these templates are Fundraising Cost, Average, Ratio. All the content presented in this PPT design is completely editable. Download it and make adjustments in color, background, font etc. as per your unique business setting.

Sales Optimization Best Practices To Close More Deals Sales KPI Dashboard Accumulated Topics PDF
The sales dashboard is an effective tool that helps in monitoring various sales KPIs in order to aid sales teams in reaching sales goals by analyzing the sales performance. Deliver and pitch your topic in the best possible manner with this sales optimization best practices to close more deals sales kpi dashboard accumulated topics pdf. Use them to share invaluable insights on incremental sales, sales revenue, cost breakdown, accumulated revenue and impress your audience. This template can be altered and modified as per your expectations. So, grab it now.
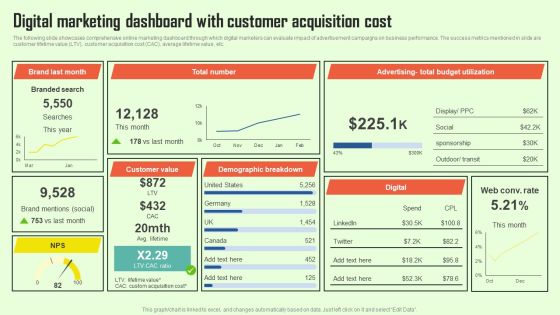
Increasing Consumer Engagement With Database Digital Marketing Dashboard With Customer Infographics PDF
The following slide showcases comprehensive online marketing dashboard through which digital marketers can evaluate impact of advertisement campaigns on business performance. The success metrics mentioned in slide are customer lifetime value LTV, customer acquisition cost CAC, average lifetime value, etc. Make sure to capture your audiences attention in your business displays with our gratis customizable Increasing Consumer Engagement With Database Digital Marketing Dashboard With Customer Infographics PDF. These are great for business strategies, office conferences, capital raising or task suggestions. If you desire to acquire more customers for your tech business and ensure they stay satisfied, create your own sales presentation with these plain slides.

Sales Assistance Boost Overall Efficiency Sales KPI Dashboard New Topics PDF
The sales dashboard is an effective tool that helps in monitoring various sales KPIs in order to aid sales teams in reaching sales goals by analyzing the sales performance. Deliver and pitch your topic in the best possible manner with this sales assistance boost overall efficiency sales kpi dashboard new topics pdf. Use them to share invaluable insights on customer acquisition cost, customer lifetime value, average revenue and impress your audience. This template can be altered and modified as per your expectations. So, grab it now.

Project Drivers Kpi Dashboard With Digital Marketing Metrics Ppt PowerPoint Presentation File Clipart PDF
This slide outlines the digital marketing project drivers dashboard which includes components such as growth, No. orders, revenue and EBITDA margin. It also provides information about the website traffic, conversion rate and new customers which can assist managers to track digital marketing performance. Showcasing this set of slides titled Project Drivers Kpi Dashboard With Digital Marketing Metrics Ppt PowerPoint Presentation File Clipart PDF. The topics addressed in these templates are Website Traffic, Conversion Rate, New Customers. All the content presented in this PPT design is completely editable. Download it and make adjustments in color, background, font etc. as per your unique business setting.

Customer Tracking Dashboard To Monitor Brand Loyalty Brand Administration Information PDF
This slide provides information brand loyalty tracking dashboard in order to monitor customer engagement, average revenues, new vs. returning visitors performance, etc. The best PPT templates are a great way to save time, energy, and resources. Slidegeeks have 100precent editable powerpoint slides making them incredibly versatile. With these quality presentation templates, you can create a captivating and memorable presentation by combining visually appealing slides and effectively communicating your message. Download Customer Tracking Dashboard To Monitor Brand Loyalty Brand Administration Information PDF from Slidegeeks and deliver a wonderful presentation.
Guide For Effective Brand Customer Tracking Dashboard To Monitor Brand Loyalty Sample PDF
This slide provides information brand loyalty tracking dashboard in order to monitor customer engagement, average revenues, new vs. returning visitors performance, etc. This modern and well-arranged Guide For Effective Brand Customer Tracking Dashboard To Monitor Brand Loyalty Sample PDF provides lots of creative possibilities. It is very simple to customize and edit with the Powerpoint Software. Just drag and drop your pictures into the shapes. All facets of this template can be edited with Powerpoint, no extra software is necessary. Add your own material, put your images in the places assigned for them, adjust the colors, and then you can show your slides to the world, with an animated slide included.

Business Process Redesigning Dashboard To Determine Sales Profit And Conversions Slides PDF
This slide focuses on dashboard to determine sales profits and conversions that also includes revenues, profits, number of orders placed, total customers, procured items that will help company to measure the overall business performance. There are so many reasons you need a Business Process Redesigning Dashboard To Determine Sales Profit And Conversions Slides PDF. The first reason is you cant spend time making everything from scratch, Thus, Slidegeeks has made presentation templates for you too. You can easily download these templates from our website easily.

Business Restructuring Process Dashboard To Determine Sales Profit And Conversions Inspiration PDF
This slide focuses on dashboard to determine sales profits and conversions that also includes revenues, profits, number of orders placed, total customers, procured items that will help company to measure the overall business performance. There are so many reasons you need a Business Restructuring Process Dashboard To Determine Sales Profit And Conversions Inspiration PDF. The first reason is you cant spend time making everything from scratch, Thus, Slidegeeks has made presentation templates for you too. You can easily download these templates from our website easily.

Deployment Of Business Process Dashboard To Determine Sales Profit And Conversions Demonstration PDF
This slide focuses on dashboard to determine sales profits and conversions that also includes revenues, profits, number of orders placed, total customers, procured items that will help company to measure the overall business performance. There are so many reasons you need a Deployment Of Business Process Dashboard To Determine Sales Profit And Conversions Demonstration PDF. The first reason is you cant spend time making everything from scratch, Thus, Slidegeeks has made presentation templates for you too. You can easily download these templates from our website easily.
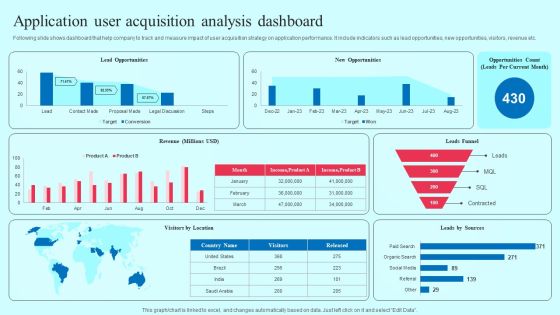
Smartphone Application User Acquisition Techniques Application User Acquisition Analysis Dashboard Information PDF
Following slide shows dashboard that help company to track and measure impact of user acquisition strategy on application performance. It include indicators such as lead opportunities, new opportunities, visitors, revenue etc. Boost your pitch with our creative Smartphone Application User Acquisition Techniques Application User Acquisition Analysis Dashboard Information PDF. Deliver an awe inspiring pitch that will mesmerize everyone. Using these presentation templates you will surely catch everyones attention. You can browse the ppts collection on our website. We have researchers who are experts at creating the right content for the templates. So you do not have to invest time in any additional work. Just grab the template now and use them.

ATS Administration To Improve Asset Management Dashboard To Track System Guidelines PDF
This slide covers KPI dashboard to track system performance. It involves detail such as total number of assets, value of assets and purchases in fiscal year. Get a simple yet stunning designed ATS Administration To Improve Asset Management Dashboard To Track System Guidelines PDF. It is the best one to establish the tone in your meetings. It is an excellent way to make your presentations highly effective. So, download this PPT today from Slidegeeks and see the positive impacts. Our easy-to-edit ATS Administration To Improve Asset Management Dashboard To Track System Guidelines PDF can be your go-to option for all upcoming conferences and meetings. So, what are you waiting for Grab this template today.

Dashboard Indicating Status Of Change Requests For Effective Leadership Decisions Themes PDF
This slide showcase leadership dashboard indicating status of change requests for effective leadership decisions which can benefit organizations in earning additional revenues and stimulate employee performance. It contains change request due in a week, change request due in month, open changes, waiting for approval, open changes by risk, change requests by status and change requests by due date.Showcasing this set of slides titled Dashboard Indicating Status Of Change Requests For Effective Leadership Decisions Themes PDF The topics addressed in these templates are Dashboard Indicating, Requests Effective, Leadership Decisions All the content presented in this PPT design is completely editable. Download it and make adjustments in color, background, font etc. as per your unique business setting.
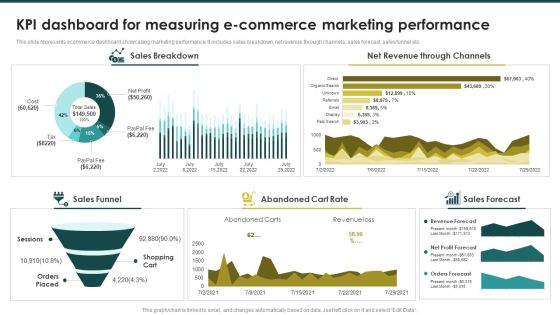
KPI Dashboard For Measuring Ecommerce Marketing Ecommerce Marketing Plan To Enhance Brochure PDF
This slide represents ecommerce dashboard showcasing marketing performance. It includes sales breakdown, net revenue through channels, sales forecast, sales funnel etc.Find highly impressive KPI Dashboard For Measuring Ecommerce Marketing Ecommerce Marketing Plan To Enhance Brochure PDF on Slidegeeks to deliver a meaningful presentation. You can save an ample amount of time using these presentation templates. No need to worry to prepare everything from scratch because Slidegeeks experts have already done a huge research and work for you. You need to download KPI Dashboard For Measuring Ecommerce Marketing Ecommerce Marketing Plan To Enhance Brochure PDF for your upcoming presentation. All the presentation templates are 100precent editable and you can change the color and personalize the content accordingly. Download now.

BPR To Develop Operational Effectiveness Dashboard To Determine Sales Profit And Conversions Slides PDF
This slide focuses on dashboard to determine sales profits and conversions that also includes revenues, profits, number of orders placed, total customers, procured items that will help company to measure the overall business performance. Formulating a presentation can take up a lot of effort and time, so the content and message should always be the primary focus. The visuals of the PowerPoint can enhance the presenters message, so our BPR To Develop Operational Effectiveness Dashboard To Determine Sales Profit And Conversions Slides PDF was created to help save time. Instead of worrying about the design, the presenter can concentrate on the message while our designers work on creating the ideal templates for whatever situation is needed. Slidegeeks has experts for everything from amazing designs to valuable content, we have put everything into BPR To Develop Operational Effectiveness Dashboard To Determine Sales Profit And Conversions Slides PDF.

Brand Management To Enhance Customer Tracking Dashboard To Monitor Brand Loyalty Microsoft PDF
This slide provides information brand loyalty tracking dashboard in order to monitor customer engagement, average revenues, new vs. returning visitors performance, etc. This Brand Management To Enhance Customer Tracking Dashboard To Monitor Brand Loyalty Microsoft PDF is perfect for any presentation, be it in front of clients or colleagues. It is a versatile and stylish solution for organizing your meetings. The Brand Management To Enhance Customer Tracking Dashboard To Monitor Brand Loyalty Microsoft PDF features a modern design for your presentation meetings. The adjustable and customizable slides provide unlimited possibilities for acing up your presentation. Slidegeeks has done all the homework before launching the product for you. So, dont wait, grab the presentation templates today
Effective Brand Reputation Management Customer Tracking Dashboard To Monitor Brand Introduction PDF
This slide provides information brand loyalty tracking dashboard in order to monitor customer engagement, average revenues, new vs. Returning visitors performance, etc. Formulating a presentation can take up a lot of effort and time, so the content and message should always be the primary focus. The visuals of the PowerPoint can enhance the presenters message, so our Effective Brand Reputation Management Customer Tracking Dashboard To Monitor Brand Introduction PDF was created to help save time. Instead of worrying about the design, the presenter can concentrate on the message while our designers work on creating the ideal templates for whatever situation is needed. Slidegeeks has experts for everything from amazing designs to valuable content, we have put everything into Effective Brand Reputation Management Customer Tracking Dashboard To Monitor Brand Introduction PDF.

Brand Personality Improvement To Increase Profits Customer Tracking Dashboard To Monitor Brand Themes PDF
This slide provides information brand loyalty tracking dashboard in order to monitor customer engagement, average revenues, new vs. returning visitors performance, etc. Get a simple yet stunning designed Brand Personality Improvement To Increase Profits Customer Tracking Dashboard To Monitor Brand Themes PDF. It is the best one to establish the tone in your meetings. It is an excellent way to make your presentations highly effective. So, download this PPT today from Slidegeeks and see the positive impacts. Our easy to edit Brand Personality Improvement To Increase Profits Customer Tracking Dashboard To Monitor Brand Themes PDF can be your go to option for all upcoming conferences and meetings. So, what are you waiting for Grab this template today.
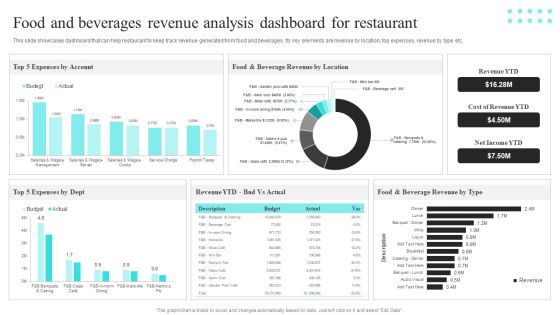
Strategic Promotional Guide For Restaurant Business Advertising Food And Beverages Revenue Analysis Dashboard Template PDF
This slide showcases dashboard that can help restaurant to keep track revenue generated from food and beverages. Its key elements are revenue by location, top expenses, revenue by type etc. This Strategic Promotional Guide For Restaurant Business Advertising Food And Beverages Revenue Analysis Dashboard Template PDF from Slidegeeks makes it easy to present information on your topic with precision. It provides customization options, so you can make changes to the colors, design, graphics, or any other component to create a unique layout. It is also available for immediate download, so you can begin using it right away. Slidegeeks has done good research to ensure that you have everything you need to make your presentation stand out. Make a name out there for a brilliant performance.

Deploying B2B Advertising Techniques For Lead Generation Social Media Marketing Kpi Dashboard Analyse Pictures PDF
This slide covers ecommerce marketing KPI dashboard to track performance. It involves details such as ecommerce revenue generated, number of new customers, repeat buying rate, attribute revenue and conversion rate and attributed revenue and conversion rate by marketing channel. Slidegeeks is here to make your presentations a breeze with Deploying B2B Advertising Techniques For Lead Generation Social Media Marketing Kpi Dashboard Analyse Pictures PDF With our easy to use and customizable templates, you can focus on delivering your ideas rather than worrying about formatting. With a variety of designs to choose from, you are sure to find one that suits your needs. And with animations and unique photos, illustrations, and fonts, you can make your presentation pop. So whether you are giving a sales pitch or presenting to the board, make sure to check out Slidegeeks first.
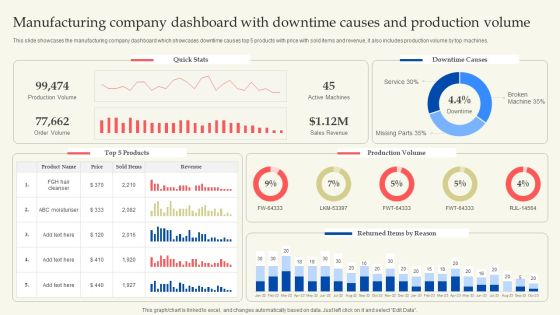
Manufacturing Company Dashboard With Downtime Causes And Production Volume Themes PDF
This slide showcases the manufacturing company dashboard which showcases downtime causes top 5 products with price with sold items and revenue, it also includes production volume by top machines. This Manufacturing Company Dashboard With Downtime Causes And Production Volume Themes PDF from Slidegeeks makes it easy to present information on your topic with precision. It provides customization options, so you can make changes to the colors, design, graphics, or any other component to create a unique layout. It is also available for immediate download, so you can begin using it right away. Slidegeeks has done good research to ensure that you have everything you need to make your presentation stand out. Make a name out there for a brilliant performance.

Information Technology Expenditure Summary Dashboard Ppt PowerPoint Presentation Diagram Graph Charts PDF
The following slide showcases the cyber security expense overview to better allocate budget. It includes elements such as IT cost, revenue, security incidents, services down, issue status summary, total business hours lost etc. This Information Technology Expenditure Summary Dashboard Ppt PowerPoint Presentation Diagram Graph Charts PDF from Slidegeeks makes it easy to present information on your topic with precision. It provides customization options, so you can make changes to the colors, design, graphics, or any other component to create a unique layout. It is also available for immediate download, so you can begin using it right away. Slidegeeks has done good research to ensure that you have everything you need to make your presentation stand out. Make a name out there for a brilliant performance.

Case Competition Inflated Fuel Price In Logistics Firm Logistics Dashboard For XYZ Logistic Company Product Icons PDF
The slide shows the logistic measurement dashboard for measuring order status, total orders, overdue shipments, global financial performance etc. Deliver and pitch your topic in the best possible manner with this case competition inflated fuel price in logistics firm logistics dashboard for xyz logistic company product icons pdf. Use them to share invaluable insights on overdue to ship, overdue shipments, open pos, late vendor shipments and impress your audience. This template can be altered and modified as per your expectations. So, grab it now.
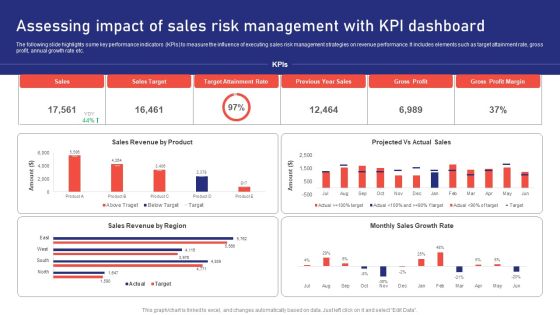
Sales Risk Assessment For Profit Maximization Assessing Impact Of Sales Risk Management With Kpi Dashboard Inspiration PDF
The following slide highlights some key performance indicators KPIs to measure the influence of executing sales risk management strategies on revenue performance. It includes elements such as target attainment rate, gross profit, annual growth rate etc. Find a pre designed and impeccable Sales Risk Assessment For Profit Maximization Assessing Impact Of Sales Risk Management With Kpi Dashboard Inspiration PDF. The templates can ace your presentation without additional effort. You can download these easy to edit presentation templates to make your presentation stand out from others. So, what are you waiting for Download the template from Slidegeeks today and give a unique touch to your presentation.
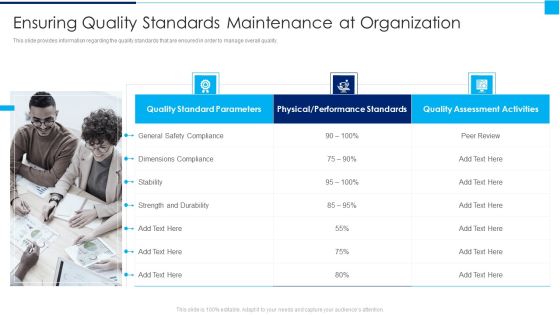
Ways To Enhance Organizations Profitability Ensuring Quality Standards Maintenance At Organization Topics PDF
This slide provides information regarding the quality standards that are ensured in order to manage overall quality. Presenting ways to enhance organizations profitability ensuring quality standards maintenance at organization topics pdf to provide visual cues and insights. Share and navigate important information on one stag that need your due attention. This template can be used to pitch topics like financial performance tracking dashboard In addtion, this PPT design contains high resolution images, graphics, etc, that are easily editable and available for immediate download.
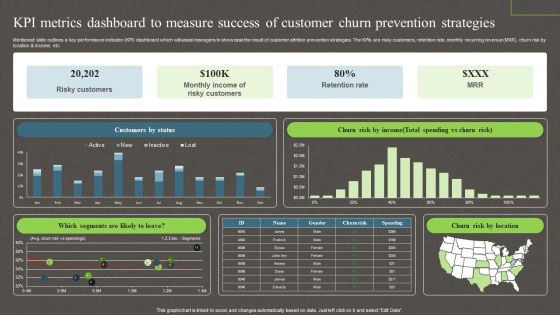
Kpi Metrics Dashboard To Measure Success Of Customer Churn Prevention Strategies Ppt PowerPoint Presentation File Model PDF
Mentioned slide outlines a key performance indicator KPI dashboard which will assist managers to showcase the result of customer attrition prevention strategies. The KPIs are risky customers, retention rate, monthly recurring revenue MRR, churn risk by location and income, etc. This Kpi Metrics Dashboard To Measure Success Of Customer Churn Prevention Strategies Ppt PowerPoint Presentation File Model PDF from Slidegeeks makes it easy to present information on your topic with precision. It provides customization options, so you can make changes to the colors, design, graphics, or any other component to create a unique layout. It is also available for immediate download, so you can begin using it right away. Slidegeeks has done good research to ensure that you have everything you need to make your presentation stand out. Make a name out there for a brilliant performance.
Integrating Logistics Automation Solution Shipping And Logistics Tracking Dashboard With Shipments And Fleet Status Ppt Ideas Model PDF
This slide covers Key performance indicators to track the automation system of the company. This dashboard includes Logistics Efficiency Status, delivery time accuracy etc. Make sure to capture your audiences attention in your business displays with our gratis customizable Integrating Logistics Automation Solution Shipping And Logistics Tracking Dashboard With Shipments And Fleet Status Ppt Ideas Model PDF. These are great for business strategies, office conferences, capital raising or task suggestions. If you desire to acquire more customers for your tech business and ensure they stay satisfied, create your own sales presentation with these plain slides.

Kpi Metrics Dashboard To Analyze The Effectiveness Of New Product Launch Launching New Beverage Product Diagrams PDF
The following slide outlines key performance indicator KPI dashboard which can be used to measure the success of product launch. The kpis are total units, revenue, average selling price ASP, number of penetrated planned customers etc. Create an editable Kpi Metrics Dashboard To Analyze The Effectiveness Of New Product Launch Launching New Beverage Product Diagrams PDF that communicates your idea and engages your audience. Whether you are presenting a business or an educational presentation, pre-designed presentation templates help save time. Kpi Metrics Dashboard To Analyze The Effectiveness Of New Product Launch Launching New Beverage Product Diagrams PDF is highly customizable and very easy to edit, covering many different styles from creative to business presentations. Slidegeeks has creative team members who have crafted amazing templates. So, go and get them without any delay.

Strategic Guide To Perform Marketing Benefits And Limitations Of Marketing For Enterprises Diagrams PDF
This slide highlights various advantages and disadvantages of using marketing concept on business to promote products or services among audience. It presents benefits like broadens market area, increase brand awareness, increase business revenue and limitation such as budgetary and time constraints and data reliability. Coming up with a presentation necessitates that the majority of the effort goes into the content and the message you intend to convey. The visuals of a PowerPoint presentation can only be effective if it supplements and supports the story that is being told. Keeping this in mind our experts created Strategic Guide To Perform Marketing Benefits And Limitations Of Marketing For Enterprises Diagrams PDF to reduce the time that goes into designing the presentation. This way, you can concentrate on the message while our designers take care of providing you with the right template for the situation.
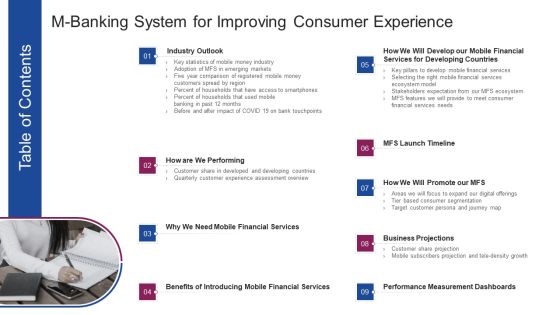
M Banking System For Improving Consumer Experience Table Of Contents Microsoft PDF
This is a m banking system for improving consumer experience table of contents microsoft pdf template with various stages. Focus and dispense information on nine stages using this creative set, that comes with editable features. It contains large content boxes to add your information on topics like industry outlook, performing, mobile financial services, performance measurement dashboards. You can also showcase facts, figures, and other relevant content using this PPT layout. Grab it now.

Online Merchandising Techniques Enhance Conversion Rate Digital Marketing Dashboard With Conversions And Revenue Growth Rate Elements PDF
Deliver and pitch your topic in the best possible manner with this online merchandising techniques enhance conversion rate digital marketing dashboard with conversions and revenue growth rate elements pdf. Use them to share invaluable insights on social media, website performance, conversion funnel, traffic sources and impress your audience. This template can be altered and modified as per your expectations. So, grab it now.

Content Ppt PowerPoint Presentation Infographics Diagrams
This is a content ppt powerpoint presentation infographics diagrams. This is a thirteen stage process. The stages in this process are business highlights, financial highlights, products offering, sales performance dashboard, sales revenue by region.

Balanced Scorecard Kpi S Ppt Slide Examples
This is a balanced scorecard kpi s ppt slide examples. This is a four stage process. The stages in this process are learning and growth, customer, financial, internal business processes.
Sales Motivation Outline Ppt PowerPoint Presentation Icon
This is a sales motivation outline ppt powerpoint presentation icon. This is a seven stage process. The stages in this process are sales performance dashboard template, sales target for current financial year, talk about the mission, encourage leadership, personalize rewards.

Balanced Scorecard Outline Ppt PowerPoint Presentation Complete Deck With Slides
Presenting this set of slides with name balanced scorecard outline ppt powerpoint presentation complete deck with slides. The topics discussed in these slides are implementation, performance, dashboard, financial, customer. This is a completely editable PowerPoint presentation and is available for immediate download. Download now and impress your audience.
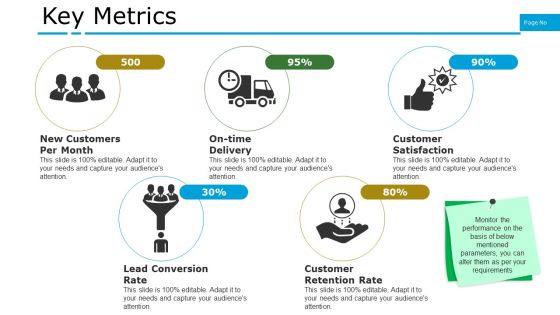
Key Metrics Ppt PowerPoint Presentation Infographics Example Topics
This is a key metrics ppt powerpoint presentation infographics example topics. This is a five stage process. The stages in this process are new customers per month, on time delivery, customer satisfaction, lead conversion rate, customer retention rate.
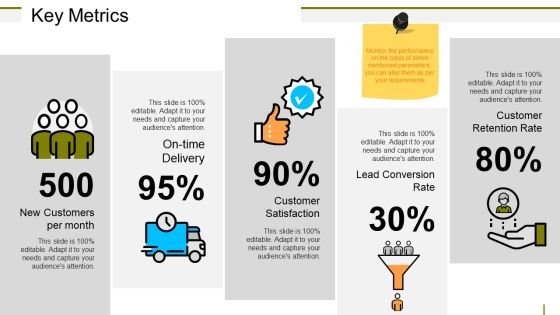
Key Metrics Ppt PowerPoint Presentation Model Portrait

Customer Satisfaction Template Ppt PowerPoint Presentation Show Introduction
This is a customer satisfaction template ppt powerpoint presentation show introduction. This is a three stage process. The stages in this process are overall satisfaction with service, satisfaction with value for money, overall satisfaction with relationship.

Information Technology Project Budget Evaluation Plan Pictures PDF
This slide signifies the project key performance indicator dashboard to evaluate financial budget evaluation. It covers information regarding to allocated and used budget. Pitch your topic with ease and precision using this Information Technology Project Budget Evaluation Plan Pictures PDF. This layout presents information on Develop Risk Assessment Report, Environment, Security. It is also available for immediate download and adjustment. So, changes can be made in the color, design, graphics or any other component to create a unique layout.
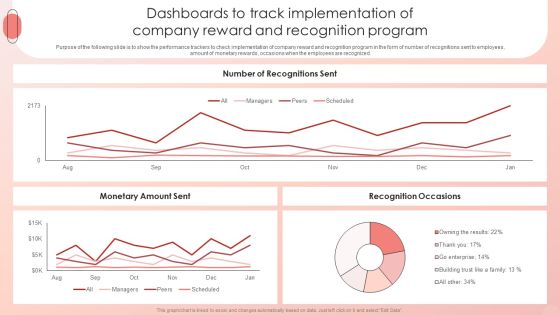
Improving HRM Process Dashboards To Track Implementation Of Company Reward Themes PDF
Purpose of the following slide is to show the performance trackers to check implementation of company reward and recognition program in the form of number of recognitions sent to employees, amount of monetary rewards, occasions when the employees are recognized. Make sure to capture your audiences attention in your business displays with our gratis customizable Improving HRM Process Dashboards To Track Implementation Of Company Reward Themes PDF. These are great for business strategies, office conferences, capital raising or task suggestions. If you desire to acquire more customers for your tech business and ensure they stay satisfied, create your own sales presentation with these plain slides.

4 Key Market Drivers Of Economic Growth Ppt PowerPoint Presentation Templates
This is a 4 key market drivers of economic growth ppt powerpoint presentation templates. This is a four stage process. The stages in this process are key market driver.
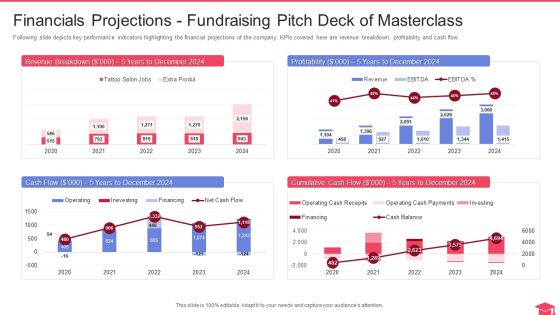
Fundraising Pitch Deck Of Masterclass Financials Projections Fundraising Pitch Deck Of Masterclass Elements PDF
Following slide depicts key performance indicators highlighting the financial projections of the company. KPIs covered here are revenue breakdown, profitability and cash flow. Deliver and pitch your topic in the best possible manner with this fundraising pitch deck of masterclass financials projections fundraising pitch deck of masterclass elements pdf. Use them to share invaluable insights on financials projections fundraising pitch deck of masterclass and impress your audience. This template can be altered and modified as per your expectations. So, grab it now.
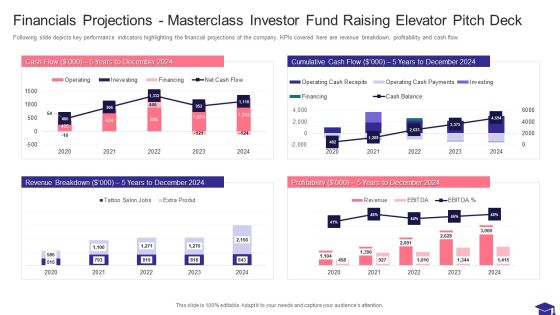
Financials Projections Masterclass Investor Fund Raising Elevator Pitch Deck Mockup PDF
Following slide depicts key performance indicators highlighting the financial projections of the company. KPIs covered here are revenue breakdown, profitability and cash flow.Deliver an awe inspiring pitch with this creative Financials Projections Masterclass Investor Fund Raising Elevator Pitch Deck Mockup PDF bundle. Topics like Cumulative Cash, Profitability, Revenue Breakdown can be discussed with this completely editable template. It is available for immediate download depending on the needs and requirements of the user.

Process Optimization Through Product Life Process Management Techniques Company Brochure PDF
This slide highlights KPI dashboard exhibiting overall improvement in the financial performance of company as the consequences of program implementation. Deliver and pitch your topic in the best possible manner with this process optimization through product life process management techniques company brochure pdf Use them to share invaluable insights on showing increase, average purchase value, quarterly scorecard and impress your audience. This template can be altered and modified as per your expectations. So, grab it now.
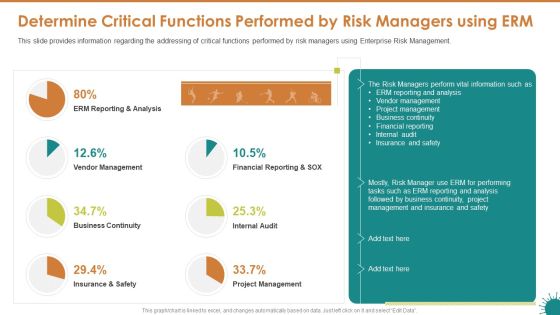
Determine Critical Functions Performed By Risk Managers Using ERM Portrait PDF
This slide provides information regarding the addressing of critical functions performed by risk managers using Enterprise Risk Management. Deliver an awe-inspiring pitch with this creative determine critical functions performed by risk managers using erm portrait pdf bundle. Topics like vendor management, business continuity, project management, financial reporting can be discussed with this completely editable template. It is available for immediate download depending on the needs and requirements of the user.
Operation And Financials Forecast Management Vs Consensus Ppt Infographic Template Icons PDF
The slide provides the operations and financials forecast of the company by the management and Consensus. Key heads includes revenue, interest income, non-performing assets, total assets etc. Deliver an awe-inspiring pitch with this creative operation and financials forecast management vs consensus ppt infographic template icons pdf bundle. Topics like interest income, revenue, non performing assets can be discussed with this completely editable template. It is available for immediate download depending on the needs and requirements of the user.

10 Designs To An Amazing Pitch Example Of Ppt
This is a 10 designs to an amazing pitch example of ppt. This is a ten stage process. The stages in this process are business model, money, market size, the solution, team, marketing plan, competition, elevator pitch, proprietary tech, the problem.
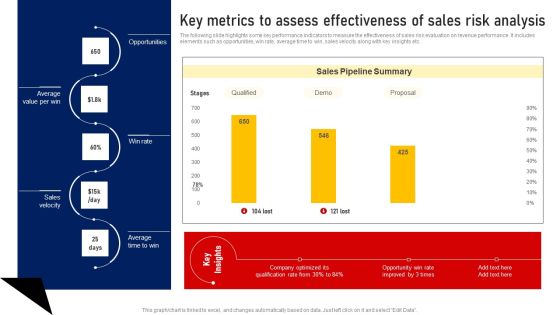
Performing Sales Risk Analysis Procedure Key Metrics To Assess Effectiveness Of Sales Risk Analysis Brochure PDF
The following slide highlights some key performance indicators to measure the effectiveness of sales risk evaluation on revenue performance. It includes elements such as opportunities, win rate, average time to win, sales velocity along with key insights etc. Get a simple yet stunning designed Performing Sales Risk Analysis Procedure Key Metrics To Assess Effectiveness Of Sales Risk Analysis Brochure PDF. It is the best one to establish the tone in your meetings. It is an excellent way to make your presentations highly effective. So, download this PPT today from Slidegeeks and see the positive impacts. Our easy to edit Performing Sales Risk Analysis Procedure Key Metrics To Assess Effectiveness Of Sales Risk Analysis Brochure PDF can be your go to option for all upcoming conferences and meetings. So, what are you waiting for Grab this template today.

Star Performer Companys Revenue Per Employee Rpe Ppt Infographic Template Format Ideas PDF
Presenting this set of slides with name star performer companys revenue per employee rpe ppt infographic template format ideas pdf. The topics discussed in these slides are insights, revenue, revenue per employee. This is a completely editable PowerPoint presentation and is available for immediate download. Download now and impress your audience.
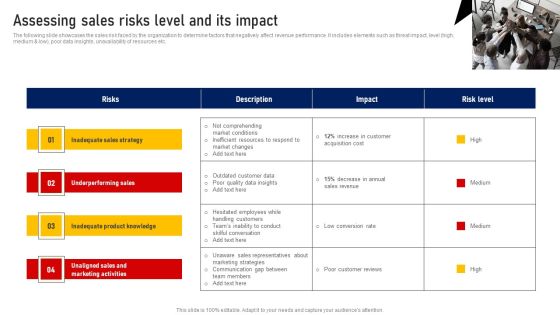
Performing Sales Risk Analysis Procedure Assessing Sales Risks Level And Its Impact Clipart PDF
The following slide showcases the sales risk faced by the organization to determine factors that negatively affect revenue performance. It includes elements such as threat impact, level high, medium and low, poor data insights, unavailability of resources etc. Do you have to make sure that everyone on your team knows about any specific topic I yes, then you should give Performing Sales Risk Analysis Procedure Assessing Sales Risks Level And Its Impact Clipart PDF a try. Our experts have put a lot of knowledge and effort into creating this impeccable Performing Sales Risk Analysis Procedure Assessing Sales Risks Level And Its Impact Clipart PDF. You can use this template for your upcoming presentations, as the slides are perfect to represent even the tiniest detail. You can download these templates from the Slidegeeks website and these are easy to edit. So grab these today.

Star Performer Best Employee Recognition Ideas Ppt Infographics Clipart Images PDF
Presenting this set of slides with name star performer best employee recognition ideas ppt infographics clipart images pdf. This is a four stage process. The stages in this process are public recognition ideas, private recognition ideas, promotion and similar recognition ideas, monetary and other tangible awards. This is a completely editable PowerPoint presentation and is available for immediate download. Download now and impress your audience.
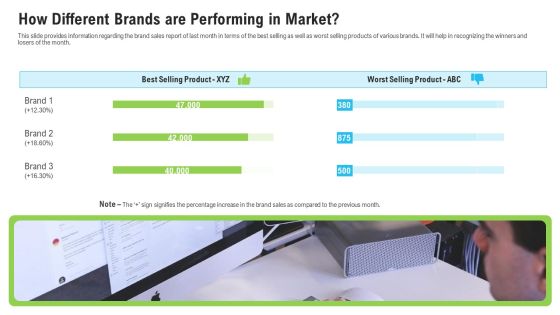
Sales Department Strategies Increase Revenues How Different Brands Are Performing In Market Ideas PDF
This slide provides information regarding the brand sales report of last month in terms of the best selling as well as worst selling products of various brands. It will help in recognizing the winners and losers of the month. Deliver and pitch your topic in the best possible manner with this sales department strategies increase revenues how different brands are performing in market ideas pdf. Use them to share invaluable insights on how different brands are performing in market and impress your audience. This template can be altered and modified as per your expectations. So, grab it now.

Market Share And Earnings Generated From Sales Of Company Top Performers Stock Designs PDF
This slide covers companys top stock summary report. It includes revenue from stock sales and selecting stock whose market share is more than 20 percentage. Showcasing this set of slides titled Market Share And Earnings Generated From Sales Of Company Top Performers Stock Designs PDF. The topics addressed in these templates are Revenue, Industry Sales, Market Share. All the content presented in this PPT design is completely editable. Download it and make adjustments in color, background, font etc. as per your unique business setting.

Best Performing Tools For Real Time Data Processing Ppt Inspiration Information PDF
This slide covers the technologies used for real time data management which reduces workloads, protects data from being damaged that allows organization to control data and use it for driving revenues. Persuade your audience using this Best Performing Tools For Real Time Data Processing Ppt Inspiration Information PDF. This PPT design covers four stages, thus making it a great tool to use. It also caters to a variety of topics including Reduces Data, Flexible And Developer Friendly, Programming Tools, Data Streaming. Download this PPT design now to present a convincing pitch that not only emphasizes the topic but also showcases your presentation skills.

Impact Of COVID 19 On The Hospitality Industry Determine Critical Functions Performed By Risk Managers Using ERM Infographics PDF
Presenting this set of slides with name impact of covid 19 on the hospitality industry determine critical functions performed by risk managers using erm infographics pdf. This is a one stage process. The stages in this process are erm reporting and analysis, vendor management, project management, business continuity, financial reporting, internal audit, insurance and safety. This is a completely editable PowerPoint presentation and is available for immediate download. Download now and impress your audience.

Customer Satisfaction Template 1 Ppt PowerPoint Presentation Infographics Outfit
This is a customer satisfaction template 1 ppt powerpoint presentation infographics outfit. This is a three stage process. The stages in this process are key performance indicators, overall satisfaction with service, satisfaction with value for money.

Customer Satisfaction Template 1 Ppt PowerPoint Presentation Ideas Tips
This is a customer satisfaction template 1 ppt powerpoint presentation ideas tips. This is a three stage process. The stages in this process are key performance indicators, overall satisfaction with service, satisfaction with value for money.

HR Software Solution Capital Funding Pitch Deck How Our Software Is Performing In The Market Infographics PDF
Purpose of the following slide is to show the key performing indicators for the software as it highlights the Monthly interview request, candidate acceptance rate and Monthly average invites Deliver an awe inspiring pitch with this creative hr software solution capital funding pitch deck how our software is performing in the market infographics pdf bundle. Topics like monthly interview requests, candidate acceptance, monthly active hiring managers can be discussed with this completely editable template. It is available for immediate download depending on the needs and requirements of the user.
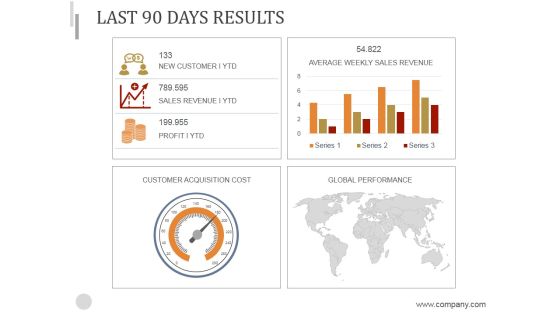
Last 90 Days Results Ppt PowerPoint Presentation Background Image
This is a last 90 days results ppt powerpoint presentation background image. This is a four stage process. The stages in this process are customer acquisition cost, global performance, average weekly sales revenue.
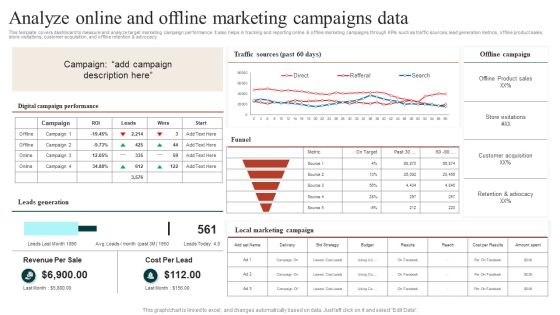
Target Marketing Techniques Analyze Online And Offline Marketing Campaigns Data Ideas PDF
This template covers dashboard to measure and analyze target marketing campaign performance. It also helps in tracking and reporting online and offline marketing campaigns through KPIs such as traffic sources, lead generation metrics, offline product sales, store visitations, customer acquisition, and offline retention and advocacy Find a pre designed and impeccable Target Marketing Techniques Evaluating Growth Rate For Target Marketing Slides PDF. The templates can ace your presentation without additional effort. You can download these easy to edit presentation templates to make your presentation stand out from others. So, what are you waiting for Download the template from Slidegeeks today and give a unique touch to your presentation.

Product Data Insights Analysis Sheet Infographics PDF
The following slide depicts the annual performance of multiple products in terms of profit or loss to track whether they are doing well or not. The analysis sheet includes element such as cost, units, selling price, sales etc. Pitch your topic with ease and precision using this Product Data Insights Analysis Sheet Infographics PDF. This layout presents information on Unit Sold, Selling Price, Total Sales. It is also available for immediate download and adjustment. So, changes can be made in the color, design, graphics or any other component to create a unique layout.

Feature Development Data Associated Activities Guidelines PDF
This slide exhibits survey of data scientists to understand feature engineering activities that helps to improve performance of machine learning business models. It includes activities such as data cleaning, organizing, collection, mining, refining algorithms etc. Pitch your topic with ease and precision using this Feature Development Data Associated Activities Guidelines PDF. This layout presents information on Programming, Developing Training Sets, Gathering Data Sets. It is also available for immediate download and adjustment. So, changes can be made in the color, design, graphics or any other component to create a unique layout.

Effectiveness Of Social Media Data Insights For Marketers Ideas PDF
The following slide depicts the effectiveness of social media insights for marketers. This data analysis helps them to formulate strategies, understand the target audience, evaluate campaign performance, assess ROI etc. Showcasing this set of slides titled Effectiveness Of Social Media Data Insights For Marketers Ideas PDF. The topics addressed in these templates are Effectiveness, Social Media, Marketers. All the content presented in this PPT design is completely editable. Download it and make adjustments in color, background, font etc. as per your unique business setting.

Last 90 Days Results Ppt PowerPoint Presentation Graphics
This is a last 90 days results ppt powerpoint presentation graphics. This is a five stage process. The stages in this process are new customer ytd, average weekly sales revenue, above sales target i ytd, customer acquisition cost, global performance.
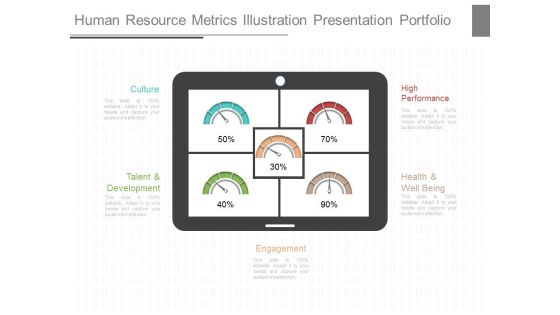
Human Resource Metrics Illustration Presentation Portfolio
This is a human resource metrics illustration presentation portfolio. This is a five stage process. The stages in this process are culture, high performance, talent and development, health and well being, engagement.
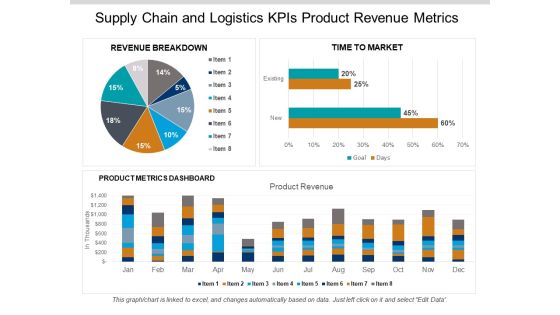
Supply Chain And Logistics Kpis Product Revenue Metrics Ppt PowerPoint Presentation Gallery Aids
This is a supply chain and logistics kpis product revenue metrics ppt powerpoint presentation gallery aids. This is a three stage process. The stages in this process are logistics performance, logistics dashboard, logistics kpis.
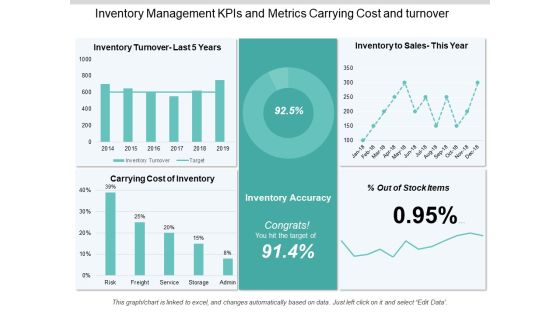
Inventory Management Kpis And Metrics Carrying Cost And Turnover Ppt PowerPoint Presentation Information
This is a inventory management kpis and metrics carrying cost and turnover ppt powerpoint presentation information. This is a five stage process. The stages in this process are logistics performance, logistics dashboard, logistics kpis.

Kpis In Shipping Perfect Order Rate And On Time Shipment Ppt PowerPoint Presentation Show Guide
This is a kpis in shipping perfect order rate and on time shipment ppt powerpoint presentation show guide. This is a six stage process. The stages in this process are logistics performance, logistics dashboard, logistics kpis.
Logistics Kpis And Metrics Percentage Of Orders Delivered Ppt PowerPoint Presentation Icon
This is a logistics kpis and metrics percentage of orders delivered ppt powerpoint presentation icon. This is a five stage process. The stages in this process are logistics performance, logistics dashboard, logistics kpis.

Two Weeks Schedule Showing Highlighting Business Tasks Ppt PowerPoint Presentation Pictures Background Designs PDF
Presenting this set of slides with name two weeks schedule showing highlighting business tasks ppt powerpoint presentation pictures background designs pdf. This is a two stage process. The stages in this process are announcement of financial statements, payment of dividends, financial performance review, monthly financial reporting, expense audit, ledger review, financial planning, budget optimization. This is a completely editable PowerPoint presentation and is available for immediate download. Download now and impress your audience.
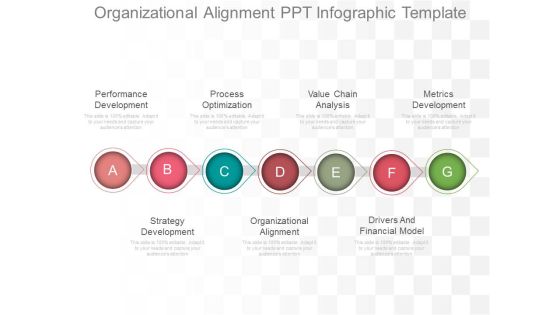
Organizational Alignment Ppt Infographic Template
This is a organizational alignment ppt infographic template. This is a seven stage process. The stages in this process are performance development, process optimization, value chain analysis, metrics development, strategy development, organizational alignment, drivers and financial model.

Advisors Investment Management Process Flow Diagram Ppt Example
This is a advisors investment management process flow diagram ppt example. This is a three stage process. The stages in this process are investment strategy, portfolio management, performance reporting, holistic financial plan.
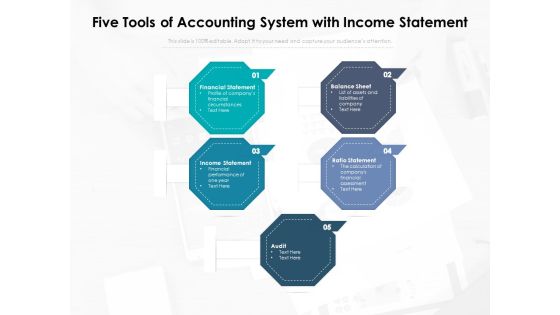
Five Tools Of Accounting System With Income Statement Ppt PowerPoint Presentation Infographic Template Rules PDF
Presenting this set of slides with name five tools of accounting system with income statement ppt powerpoint presentation infographic template rules pdf. This is a five stage process. The stages in this process are financial statement, profile of companys financial, circumstances, balance sheet, list of assets and liabilities of company, income statement, financial performance of one year, ratio statement, the calculation of companys financial assessment, audit. This is a completely editable PowerPoint presentation and is available for immediate download. Download now and impress your audience.
Energy Tracking Device Motivate Ppt PowerPoint Presentation Infographics Graphics Design PDF
Presenting energy tracking device motivate ppt powerpoint presentation infographics graphics design pdf to provide visual cues and insights. Share and navigate important information on six stages that need your due attention. This template can be used to pitch topics like internal competition, recognition, financial bonus and prizes, environmental responsibility, financial responsibility, performance standards. In addtion, this PPT design contains high-resolution images, graphics, etc, that are easily editable and available for immediate download.

Stakeholder Engagement Assessment For Project Management Services Graphics PDF
The following slide exhibits key metrics for evaluating service supply chain performance which can be used to track processes and fulfil company objectives.It covers assessment areas, criteria and performance metrics. Showcasing this set of slides titled Stakeholder Engagement Assessment For Project Management Services Graphics PDF. The topics addressed in these templates are Communications, Financial Administration, Employment. All the content presented in this PPT design is completely editable. Download it and make adjustments in color, background, font etc. as per your unique business setting.

Data Processing And Analysis Powerpoint Slides
This is a data processing and analysis powerpoint slides. This is a five stage process. The stages in this process are financial reporting and business excellence, competitive intelligence and strategy support, analysis and tool creation, planning and performance management support, data processing and analysis.
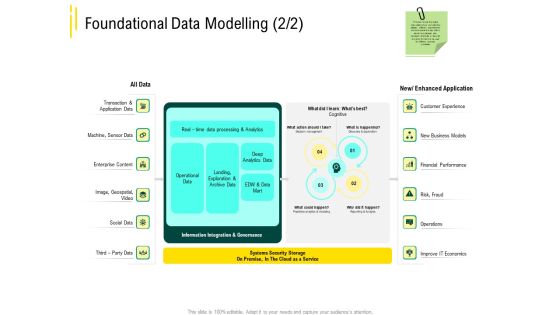
Expert Systems Foundational Data Modelling Analytics Diagrams PDF
Deliver an awe-inspiring pitch with this creative expert systems foundational data modelling analytics diagrams pdf bundle. Topics like socia, edw and data mart, operations, new business models, financial performance can be discussed with this completely editable template. It is available for immediate download depending on the needs and requirements of the user.
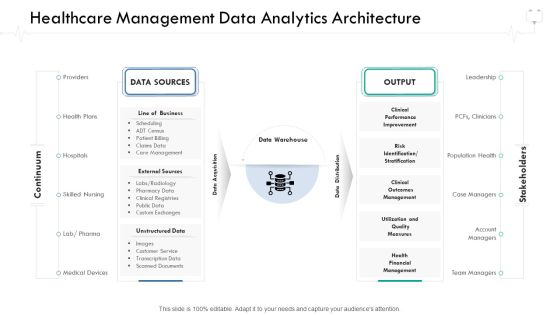
Wellness Management Healthcare Management Data Analytics Architecture Infographics PDF
Deliver an awe-inspiring pitch with this creative wellness management healthcare management data analytics architecture infographics pdf bundle. Topics like health financial management, risk identification or stratification, clinical performance improvement can be discussed with this completely editable template. It is available for immediate download depending on the needs and requirements of the user.
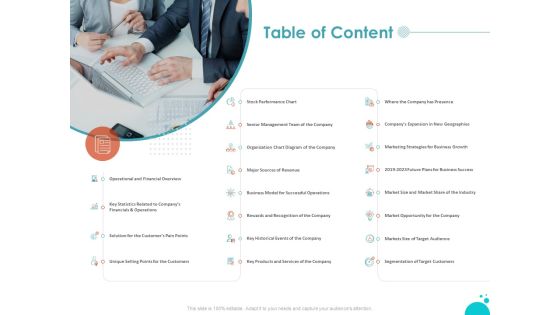
Investment Pitch For Aftermarket Table Of Content Ppt PowerPoint Presentation Infographics Graphic Tips PDF
Presenting this set of slides with name investment pitch for aftermarket table of content ppt powerpoint presentation infographics graphic tips pdf. This is a one stage process. The stages in this process are operational and financial overview, statistics related to companys financials and operations, solution customers pain points, key historical events company, stock performance chart, major sources revenue. This is a completely editable PowerPoint presentation and is available for immediate download. Download now and impress your audience.

Benefits Of Manpower Analytics For Enhancement In Employee Engagement Guidelines PDF
This slide covers various benefits of data analytics for engagement among workforce. It includes control over unconditional visibility, distributed rescheduling, optimal resource health and objective performance appraisals. Persuade your audience using this Benefits Of Manpower Analytics For Enhancement In Employee Engagement Guidelines PDF. This PPT design covers four stages, thus making it a great tool to use. It also caters to a variety of topics including Control Over, Unconditional Visibility, Distributed Rescheduling, Objective Performance Appraisals. Download this PPT design now to present a convincing pitch that not only emphasizes the topic but also showcases your presentation skills.
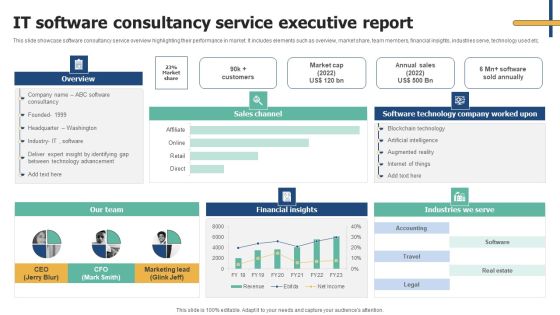
IT Software Consultancy Service Executive Report Structure PDF
This slide showcase software consultancy service overview highlighting their performance in market. It includes elements such as overview, market share, team members, financial insights, industries serve, technology used etc. Pitch your topic with ease and precision using this IT Software Consultancy Service Executive Report Structure PDF. This layout presents information on Financial Insights, Our Team, Industries We Serve. It is also available for immediate download and adjustment. So, changes can be made in the color, design, graphics or any other component to create a unique layout.
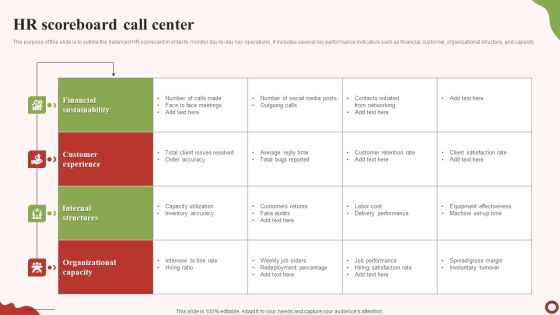
HR Scoreboard Call Center Template PDF
The purpose of this slide is to outline the balanced HR scorecard in order to monitor day-to-day key operations. It includes several key performance indicators such as financial, customer, organizational structure, and capacity. Showcasing this set of slides titled HR Scoreboard Call Center Template PDF. The topics addressed in these templates are Financial Sustainability, Customer Experience, Internal Structures. All the content presented in this PPT design is completely editable. Download it and make adjustments in color, background, font etc. as per your unique business setting.
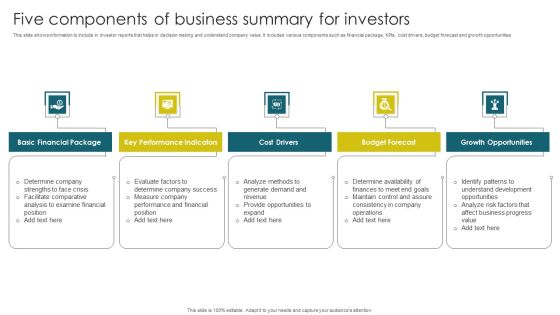
Five Components Of Business Summary For Investors Summary PDF
This slide shows information to include in investor reports that helps in decision making and understand company value. It includes various components such as financial package, KPIs, cost drivers, budget forecast and growth opportunities.Presenting Five Components Of Business Summary For Investors Summary PDF to dispense important information. This template comprises five stages. It also presents valuable insights into the topics including Financial Package, Performance Indicators, Budget Forecast. This is a completely customizable PowerPoint theme that can be put to use immediately. So, download it and address the topic impactfully.

Customer Satisfaction Template 1 Ppt PowerPoint Presentation Portfolio Graphics Example
This is a customer satisfaction template 1 ppt powerpoint presentation portfolio graphics example. This is a three stage process. The stages in this process are overall satisfaction with service, satisfaction with value for money, overall satisfaction with relationship, key performance indicators, business, percentage.

Big Data Analytics Procedure For Management Accounting Formats PDF
This slide illustrate big data analysis process for management accounting to generate financial reports for decision making. It includes elements such as cost accounting balance scorecards, performance measurement etc. Showcasing this set of slides titled Big Data Analytics Procedure For Management Accounting Formats PDF. The topics addressed in these templates are Accounting, Internal Data, Social Media. All the content presented in this PPT design is completely editable. Download it and make adjustments in color, background, font etc. as per your unique business setting.
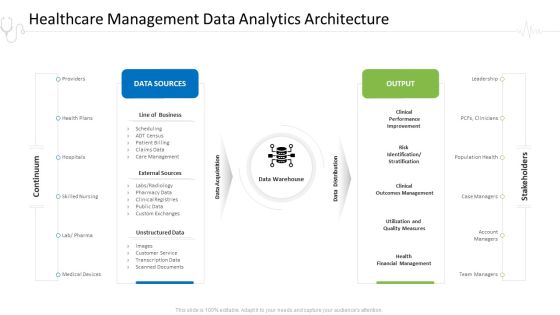
Hospital Administration Healthcare Management Data Analytics Architecture Ppt Infographics Information PDF
This is a hospital administration healthcare management data analytics architecture ppt infographics information pdf template with various stages. Focus and dispense information on two stages using this creative set, that comes with editable features. It contains large content boxes to add your information on topics like line of business, external sources, management, performance improvement, financial management. You can also showcase facts, figures, and other relevant content using this PPT layout. Grab it now.

Hospital Management Healthcare Management Data Analytics Architecture Ppt Model Tips PDF
This is a hospital management healthcare management data analytics architecture ppt model tips pdf template with various stages. Focus and dispense information on two stages using this creative set, that comes with editable features. It contains large content boxes to add your information on topics like line of business, external sources, management, performance improvement, financial management. You can also showcase facts, figures, and other relevant content using this PPT layout. Grab it now.

Health Centre Management Business Plan Healthcare Management Data Analytics Architecture Clipart PDF
This is a health centre management business plan healthcare management data analytics architecture clipart pdf template with various stages. Focus and dispense information on two stages using this creative set, that comes with editable features. It contains large content boxes to add your information on topics like line of business, external sources, management, performance improvement, financial management. You can also showcase facts, figures, and other relevant content using this PPT layout. Grab it now.
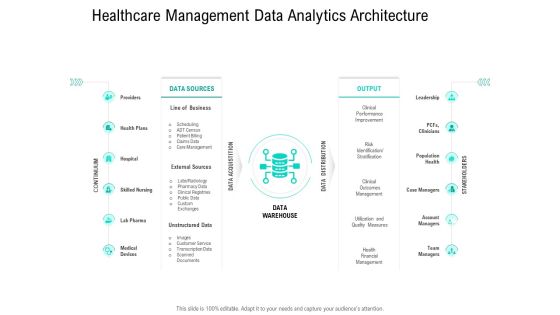
Nursing Administration Healthcare Management Data Analytics Architecture Ppt Visual Aids Pictures PDF
This is a nursing administration healthcare management data analytics architecture ppt visual aids pictures pdf template with various stages. Focus and dispense information on two stages using this creative set, that comes with editable features. It contains large content boxes to add your information on topics like line of business, external sources, management, performance improvement, financial management. You can also showcase facts, figures, and other relevant content using this PPT layout. Grab it now.
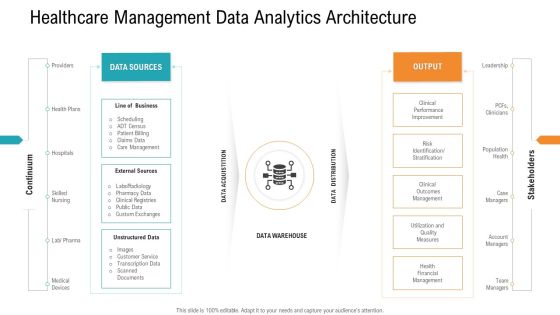
E Healthcare Management System Healthcare Management Data Analytics Architecture Portrait PDF
This is a e healthcare management system healthcare management data analytics architecture portrait pdf template with various stages. Focus and dispense information on two stages using this creative set, that comes with editable features. It contains large content boxes to add your information on topics like line of business, external sources, management, performance improvement, financial management. You can also showcase facts, figures, and other relevant content using this PPT layout. Grab it now.
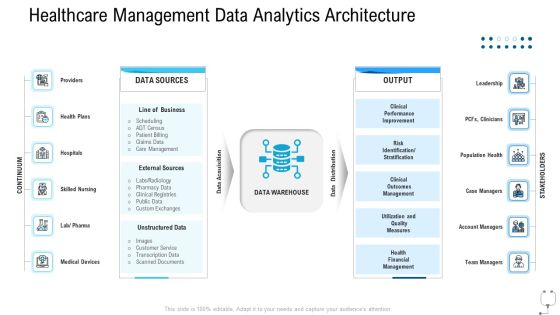
Healthcare Management Healthcare Management Data Analytics Architecture Ppt File Visuals PDF
This is a healthcare management healthcare management data analytics architecture ppt file visuals pdf template with various stages. Focus and dispense information on two stages using this creative set, that comes with editable features. It contains large content boxes to add your information on topics like line of business, external sources, management, performance improvement, financial management. You can also showcase facts, figures, and other relevant content using this PPT layout. Grab it now.
Pharmaceutical Management Healthcare Management Data Analytics Architecture Ppt Icon Picture PDF
This is a pharmaceutical management healthcare management data analytics architecture ppt icon picture pdf template with various stages. Focus and dispense information on two stages using this creative set, that comes with editable features. It contains large content boxes to add your information on topics like line of business, external sources, management, performance improvement, financial management. You can also showcase facts, figures, and other relevant content using this PPT layout. Grab it now.

Managers Scorecard Indicators For Finance Executives Topics PDF
This slide mentions financial key performance indicators used to formulate a balanced scorecard. It includes reducing operating costs, minimizing debts and efficient billing systems. Presenting Managers Scorecard Indicators For Finance Executives Topics PDF to dispense important information. This template comprises three stages. It also presents valuable insights into the topics including Executives, Managers, Finance. This is a completely customizable PowerPoint theme that can be put to use immediately. So, download it and address the topic impactfully.

Advantages And Disadvantages Of Balanced Scorecard Strategy Mapping Ppt PowerPoint Presentation Infographics Slideshow PDF
Presenting this set of slides with name advantages and disadvantages of balanced scorecard strategy mapping ppt powerpoint presentation infographics slideshow pdf. This is a two stage process. The stages in this process are benefits, better management information, improved performance reporting, increase customer focus, lack of well defined strategy, no focus on external factors and competitors, high financial cost investment, drawbacks. This is a completely editable PowerPoint presentation and is available for immediate download. Download now and impress your audience.

Table Of Contents For Debt Collection Improvement Plan Download PDF
This is a table of contents for debt collection improvement plan download pdf template with various stages. Focus and dispense information on one stages using this creative set, that comes with editable features. It contains large content boxes to add your information on topics like detailed financial analysis, balance sheet overview organization, our key performance indicators balance sheet, understanding our cash flow statements. You can also showcase facts, figures, and other relevant content using this PPT layout. Grab it now.

Advantages And Disadvantages Of Balanced Scorecard Ppt PowerPoint Presentation Styles Deck PDF
Presenting this set of slides with name advantages and disadvantages of balanced scorecard ppt powerpoint presentation styles deck pdf. This is a two stage process. The stages in this process are benefit, drawback, requires skillful planning, lack of risk analysis, lack of external factors and competitors, improved financial performance reporting. This is a completely editable PowerPoint presentation and is available for immediate download. Download now and impress your audience.

Company Overview Contd Operating Manual Ppt Infographic Template Layouts PDF
The purpose of this slide is to provide glimpse about the key promoters and the financial highlights of the firm as an financial overview of firms performance. Deliver and pitch your topic in the best possible manner with this company overview contd operating manual ppt infographic template layouts pdf. Use them to share invaluable insights on revenue, net income, financial and impress your audience. This template can be altered and modified as per your expectations. So, grab it now

Positive Impact Of Effective Marketing Kpis To Track Success Of Event Demonstration PDF
From laying roadmaps to briefing everything in detail, our templates are perfect for you. You can set the stage with your presentation slides. All you have to do is download these easy-to-edit and customizable templates. Positive Impact Of Effective Marketing Kpis To Track Success Of Event Demonstration PDF will help you deliver an outstanding performance that everyone would remember and praise you for. Do download this presentation today.

Tactical Planning And Analyzing Organizational Goals Icon Infographics PDF
This slide defines the dashboard for analyzing the sales key performance indicators KPIs. It includes information related to the number of sales, revenue, profit, and cost. Showcasing this set of slides titled Tactical Planning And Analyzing Organizational Goals Icon Infographics PDF. The topics addressed in these templates are Cost Breakdown, Sales Revenue, Accumulated Revenue. All the content presented in this PPT design is completely editable. Download it and make adjustments in color, background, font etc. as per your unique business setting.
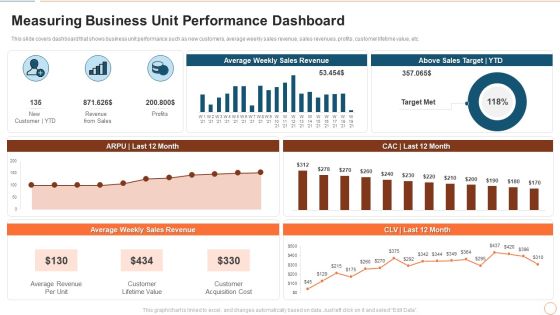
Illustrating Product Leadership Plan Incorporating Innovative Techniques Measuring Business Unit Professional PDF
This slide covers dashboard that shows business unit performance such as new customers, average weekly sales revenue, sales revenues, profits, customer lifetime value, etc. Deliver an awe inspiring pitch with this creative illustrating product leadership plan incorporating innovative techniques measuring business unit professional pdf bundle. Topics like average revenue per unit, customer lifetime value, customer acquisition cost can be discussed with this completely editable template. It is available for immediate download depending on the needs and requirements of the user.

Formulating Competitive Plan Of Action For Effective Product Leadership Measuring Business Unit Slides PDF
This slide covers dashboard that shows business unit performance such as new customers, average weekly sales revenue, sales revenues, profits, customer lifetime value, etc. Deliver an awe inspiring pitch with this creative formulating competitive plan of action for effective product leadership measuring business unit slides pdf bundle. Topics like average revenue per unit, customer lifetime value, customer acquisition cost can be discussed with this completely editable template. It is available for immediate download depending on the needs and requirements of the user.

Commodity Adoption Metrics For Technique Development Microsoft PDF
This slide highlights various key performance indicators to identify product adoption rate for user acquisition strategy development. It includes key metrics such as net promoter score, client retention rate, active user percentage, customer lifetime value and churn rate. Presenting Commodity Adoption Metrics For Technique Development Microsoft PDF to dispense important information. This template comprises four stages. It also presents valuable insights into the topics including Build Customer, Onboarding Process, Analysis. This is a completely customizable PowerPoint theme that can be put to use immediately. So, download it and address the topic impactfully.
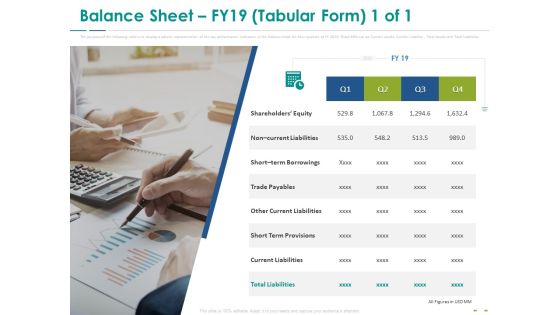
Stock Market Research Report Balance Sheet FY19 Tabular Form Equity Information PDF
The purpose of the following slide is to display the key performance indicators of the balance sheet for four quarters of FY 2019. These KPIs can be Current assets, Current Liability , Total Assets and Total Liabilities. Presenting stock market research report balance sheet fy19 tabular form equity information pdf to provide visual cues and insights. Share and navigate important information on one stages that need your due attention. This template can be used to pitch topics like non current liabilities, short term borrowings, trade payables, other current liabilities, short term provisions. In addition, this PPT design contains high-resolution images, graphics, etc, that are easily editable and available for immediate download.

Six Sigma Continuous Process Kpis To Measure The Growth Of Operational Strategy Rules PDF
Purpose of the following slide is to show the KPIs or key performance indicators for measuring the progress of operational strategy. These KPIs can be customer satisfaction rate, net promoter score, Downtime etc. This is a Six Sigma Continuous Process Kpis To Measure The Growth Of Operational Strategy Rules PDF template with various stages. Focus and dispense information on four stages using this creative set, that comes with editable features. It contains large content boxes to add your information on topics like Customer KPIs, Employee KPIs, Production KPIs. You can also showcase facts, figures, and other relevant content using this PPT layout. Grab it now.
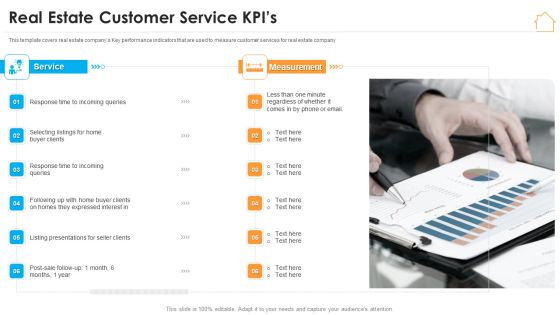
Real Estate Marketing Strategy Vendors Real Estate Customer Service Kpis Topics PDF
This template covers real estate companys Key performance indicators that are used to measure customer services for real estate company. Presenting real estate marketing strategy vendors real estate customer service kpis topics pdf to provide visual cues and insights. Share and navigate important information on six stages that need your due attention. This template can be used to pitch topics like measurement, buyer clients, service. In addtion, this PPT design contains high resolution images, graphics, etc, that are easily editable and available for immediate download.

Identifying Key Metrics To Measure Success Of Our Marketing Efforts Download PDF
Purpose of the following slide is to identify the key metrics that the organization can use to track performance of their marketing efforts, these metrics are cost of acquisition, click through rate etc. Presenting Identifying Key Metrics To Measure Success Of Our Marketing Efforts Download PDF to provide visual cues and insights. Share and navigate important information on one stages that need your due attention. This template can be used to pitch topics like Social Media, Cost Per Acquisition, Key Marketing Metrics. In addtion, this PPT design contains high resolution images, graphics, etc, that are easily editable and available for immediate download.

Data Monetization And Management Data Collection Preparation And Preprocessing Mockup PDF
Once the insights are identified, data collection sources are selected for further predictive modeling. After that, dataset is prepared with a set of attributes representing behavior patterns related to customer engagement level for specific product or service. From laying roadmaps to briefing everything in detail, our templates are perfect for you. You can set the stage with your presentation slides. All you have to do is download these easy-to-edit and customizable templates. Data Monetization And Management Data Collection Preparation And Preprocessing Mockup PDF will help you deliver an outstanding performance that everyone would remember and praise you for. Do download this presentation today.

Major Metrics To Manage Cash Flow Ppt Infographics Portfolio PDF
This slide showcases main performance metric for cashflow management and improvement. The KPIs covered are account receivable turnover, sustainable growth rate, cash conversion cycle and quick ratio. Presenting Major Metrics To Manage Cash Flow Ppt Infographics Portfolio PDF to dispense important information. This template comprises four stages. It also presents valuable insights into the topics including Account Receivable Turnover, Sustainable Growth Rate, Cash Conversion Cycle. This is a completely customizable PowerPoint theme that can be put to use immediately. So, download it and address the topic impactfully.

Information Security Track Record Of Our Company Themes PDF
This slide highlights our past track record as a data privacy provider company and outlines that we promise 100 percent client satisfaction. From laying roadmaps to briefing everything in detail, our templates are perfect for you. You can set the stage with your presentation slides. All you have to do is download these easy to edit and customizable templates. Information Security Track Record Of Our Company Themes PDF will help you deliver an outstanding performance that everyone would remember and praise you for. Do download this presentation today.

Price Architecture Cost Sheet Ratio Cont Ppt PowerPoint Presentation Portfolio Guidelines PDF
These four key performance indicator calculates a gross profit margin. Presenting price architecture cost sheet ratio cont ppt powerpoint presentation portfolio guidelines pdf to provide visual cues and insights. Share and navigate important information on four stages that need your due attention. This template can be used to pitch topics like gross profit margin, direct material cost per unit, direct labor cost per unit, fixed overhead cost per unit, sales volume, sales revenue. In addition, this PPT design contains high-resolution images, graphics, etc, that are easily editable and available for immediate download.

Earned Value Management Analysis Of Different Activities Ppt Infographic Template Slides PDF
This slide represents earned value management analysis of different activities illustrating activities, budget at completion, planned value, actual cost etc use for valuing each activity performance in a project. Presenting Earned Value Management Analysis Of Different Activities Ppt Infographic Template Slides PDF to dispense important information. This template comprises one stages. It also presents valuable insights into the topics including Develop Scope, Develop Task Schedule, Create Risk Plan. This is a completely customizable PowerPoint theme that can be put to use immediately. So, download it and address the topic impactfully.

Factory Costs Components Cost Sheet Ratio Cont Ppt Gallery Images PDF
These four key performance indicator calculates a gross profit margin .This is a factory costs components cost sheet ratio cont ppt gallery images pdf. template with various stages. Focus and dispense information on four stages using this creative set, that comes with editable features. It contains large content boxes to add your information on topics like direct material cost per unit, gross profit margin, direct labor cost per unit, sales volume. You can also showcase facts, figures, and other relevant content using this PPT layout. Grab it now.

Multiple Challenges In Internal Cloud Computing Assessment Ppt Visual Aids Model PDF
The slide highlights the barriers faced in cloud auditing to analyse the performance of the vendor. Various challenges included are scope definition, third party dependence, expertise required and data access. Presenting Multiple Challenges In Internal Cloud Computing Assessment Ppt Visual Aids Model PDF to dispense important information. This template comprises one stages. It also presents valuable insights into the topics including Scope Definition, Third Party Dependence, Expertise Required, Data Access. This is a completely customizable PowerPoint theme that can be put to use immediately. So, download it and address the topic impactfully.

Embed Diversity And Inclusion Impact Of Diversity And Inclusion In Company Designs PDF
This infographic provides impact of D And I in business performance which leads to enhanced innovation, creativity, reputation, engagement, and results. This is a Embed Diversity And Inclusion Impact Of Diversity And Inclusion In Company Designs PDF template with various stages. Focus and dispense information on six stages using this creative set, that comes with editable features. It contains large content boxes to add your information on topics like Increased Creativity, Better Outcomes, Workplace Happiness, Stakeholder Support. You can also showcase facts, figures, and other relevant content using this PPT layout. Grab it now.
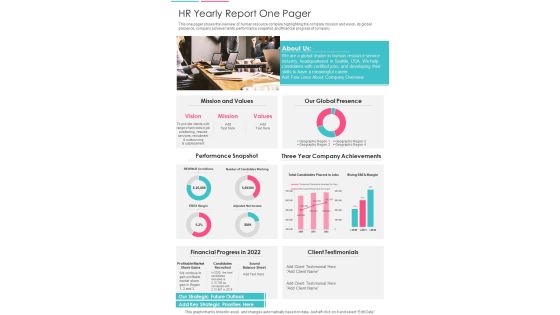
HR Yearly Report One Pager One Pager Documents
This one pager shows the overview of human resource company highlighting the company mission and vision, its global presence, company achievements, performance snapshot, and financial progress of company. Presenting you an exemplary HR Yearly Report One Pager One Pager Documents. Our one-pager comprises all the must-have essentials of an inclusive document. You can edit it with ease, as its layout is completely editable. With such freedom, you can tweak its design and other elements to your requirements. Download this HR Yearly Report One Pager One Pager Documents brilliant piece now.
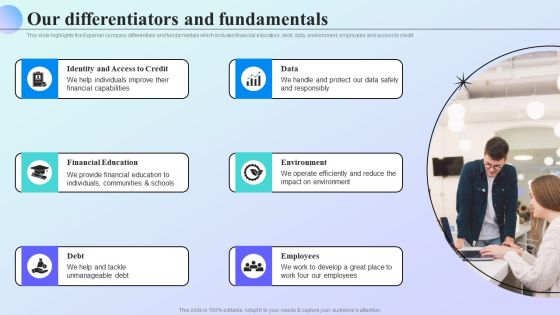
Information Analytics Company Outline Our Differentiators And Fundamentals Professional PDF
This slide highlights the Experian company differentials and fundamentals which includes financial education, debt, data, environment, employees and access to credit. From laying roadmaps to briefing everything in detail, our templates are perfect for you. You can set the stage with your presentation slides. All you have to do is download these easy to edit and customizable templates. Information Analytics Company Outline Our Differentiators And Fundamentals Professional PDF will help you deliver an outstanding performance that everyone would remember and praise you for. Do download this presentation today.
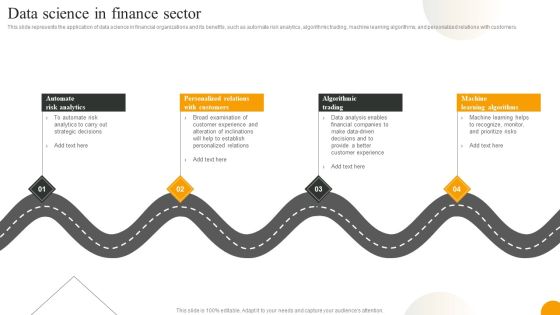
Using Data Science Technologies For Business Transformation Data Science In Finance Sector Slides PDF
This slide represents the application of data science in financial organizations and its benefits, such as automate risk analytics, algorithmic trading, machine learning algorithms, and personalized relations with customers. From laying roadmaps to briefing everything in detail, our templates are perfect for you. You can set the stage with your presentation slides. All you have to do is download these easy to edit and customizable templates. Using Data Science Technologies For Business Transformation Data Science In Finance Sector Slides PDF will help you deliver an outstanding performance that everyone would remember and praise you for. Do download this presentation today.

Allocated Budget Analysis For Influencer Marketing Strategy Plan Infographics PDF
This slide showcases graphs that can help organization to identify the variance in spent vs allocated budget and estimate future financial forecasts. Its can also help to keep track of further expenses for influencer marketing strategy.Showcasing this set of slides titled Allocated Budget Analysis For Influencer Marketing Strategy Plan Infographics PDF. The topics addressed in these templates are Allocated Budget, Date Organization, Performance Media Budget. All the content presented in this PPT design is completely editable. Download it and make adjustments in color, background, font etc. as per your unique business setting.
 Home
Home