Financial Model

Example Of Optimum Facilities Management Ppt Example File
This is a example of optimum facilities management ppt example file. This is a five stage process. The stages in this process are personal database, financial database, marketing database, application, simulation processor.

Management And Control Of Quality Diagram Presentation Examples
This is a management and control of quality diagram presentation examples. This is a five stage process. The stages in this process are implement, financial services, smartphone applications, mortage services, health care.

Tree For Dollar Growth Concept Powerpoint Template
This business diagram has been designed with dollar growth tree. You may use this slide to display financial success and growth concepts. Make your mark with this unique slide and create an impression that will endure.
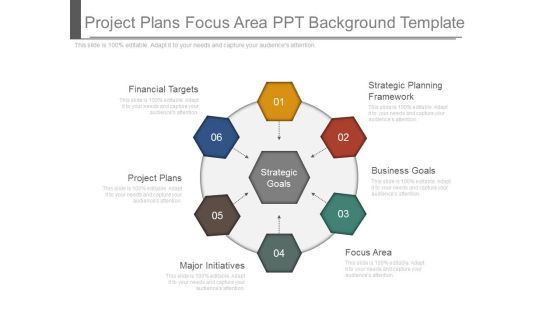
Project Plans Focus Area Ppt Background Template
This is a project plans focus area ppt background template. This is a six stage process. The stages in this process are financial targets, strategic planning framework, project plans, business goals, major initiatives, focus area.
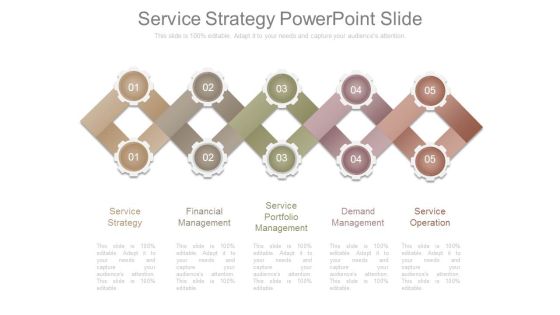
Service Strategy Powerpoint Slide
This is a service strategy powerpoint slide. This is a five stage process. The stages in this process are service strategy, financial management, service portfolio management, demand management, service operation.

Advisors Investment Management Process Flow Diagram Ppt Example
This is a advisors investment management process flow diagram ppt example. This is a three stage process. The stages in this process are investment strategy, portfolio management, performance reporting, holistic financial plan.
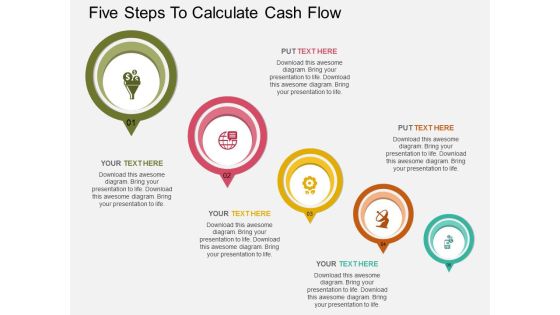
Five Steps To Calculate Cash Flow Powerpoint Template
This PPT slide has been designed with circles and financial icons. This template is designed to display finance and investment related topics. This professional slide helps in making an instant impact on viewers.

Business Diagram Line Graph For Dollar Growth Presentation Template
Graphic of dollar symbol and growth arrow has been used to design this power point template. This diagram contains the concept of financial result analysis. Use this business diagram for finance related presentations

Business Person With Big Dollar Sign Powerpoint Templates
Adjust the above diagram into your presentations to visually support your content. This slide has been professionally designed with graphics of business man with big dollar sign. This template offers an excellent background to display corporate financial management.

Internal And External Business Environment Analysis SPACE Matrix For Business Environmental Analysis Infographics PDF
This slide shows SPACE matrix to analyze market position of organization based on financial, industry, competitive and stability position Deliver an awe inspiring pitch with this creative internal and external business environment analysis space matrix for business environmental analysis infographics pdf bundle. Topics like competitive position, financial position, external strategic position can be discussed with this completely editable template. It is available for immediate download depending on the needs and requirements of the user.
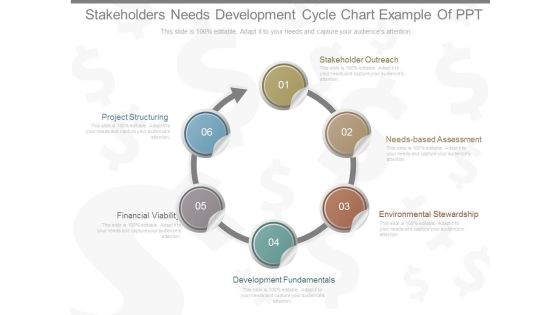
Stakeholders Needs Development Cycle Chart Example Of Ppt
This is a stakeholders needs development cycle chart example of ppt. This is a six stage process. The stages in this process are stakeholder outreach, needs based assessment, environmental stewardship,, development fundamentals, financial viability, project structuring.

Retention Marketing Strategies Ppt Presentation Images
This is a retention marketing strategies ppt presentation images. This is a four stage process. The stages in this process are financial bonds, social bonds, continuous quality service to customer, structural bonds, customization bonds.

Global Cyber Terrorism Incidents On The Rise IT Assessment Matrix Of Cyber Terrorism Ideas PDF
This slide demonstrates the cyber terrorism in terms of cybercriminal actors, as well as the financial impact of successful cyber terrorists attacks. Deliver an awe inspiring pitch with this creative global cyber terrorism incidents on the rise it assessment matrix of cyber terrorism ideas pdf bundle. Topics like financial theft or froud, reputation damage, regulatory, competitors, destruction of critical infrastructure can be discussed with this completely editable template. It is available for immediate download depending on the needs and requirements of the user.

Stock Photo Graphics Of Padlock With Us Dollar Pwerpoint Slide
This business image has been designed with graphic of padlock with US dollar. This image contains the concept of finance and security. Make a quality presentation for financial security.
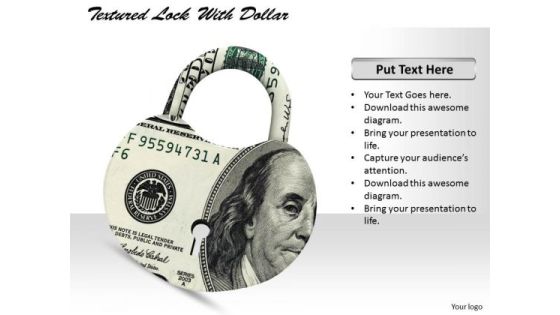
Stock Photo Textured Lock With Us Dollar Pwerpoint Slide
This business image has been designed with graphic of textured lock with US dollar. This image contains the concept of finance and security. Make a quality presentation for financial security.

Stock Photo 3d Dollar Symbol With Chain And Text Boxes PowerPoint Slide
This image slide has been designed with graphic of dollar notes locked with chain. This slide depicts concept of financial security and investment. Use this editable slide for your wealth and finance related topics.

Laptop Globe Bar Graph Dollar Coins Ppt Slides Graphics
Icons of laptop, globe and bar graph with dollar coins have been used to design this icon PPT slide. Download these icons to display concepts of technology and financial growth. Use this slide to build an exclusive presentation.

Dollar Over Umbrella Currency Growth Filteration Ppt Slides Graphics
This PPT slide displays graphics of dollar with umbrella, dollar target and growth graph. This PPT helps to depict concepts of financial saving and security. This icon slide is innovatively designed to highlight your worthy views
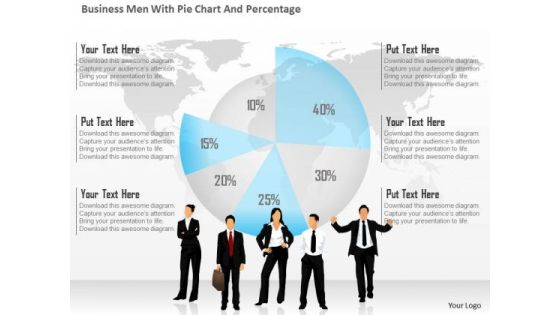
Business Diagram Business Men With Pie Chart And Percentage Presentation Template
This business diagram has been designed with graphic of business people and pie chart with percentage. This diagram is designed to depict team meeting on financial matter. This diagram offers a way for your audience to visually conceptualize the process.
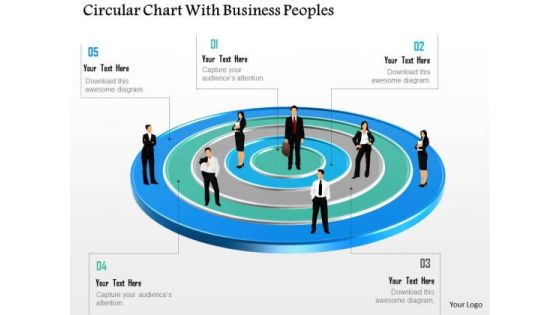
Business Diagram Circular Chart With Business Peoples Presentation Template
This business diagram has been designed with graphic of business people on circular chart. This diagram is designed to depict team meeting on financial matter. This diagram offers a way for your audience to visually conceptualize the process.
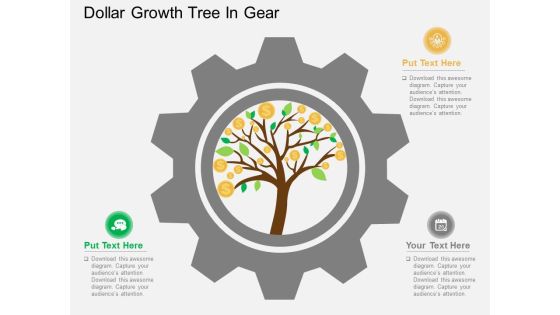
Dollar Growth Tree In Gear Powerpoint Templates
This PowerPoint slide has been designed with dollar growth tree. This diagram is designed to display financial growth planning. This professional slide helps in making an instant impact on viewers.

Dollar Trophy For Goal Success Powerpoint Templates
This PowerPoint slide has been designed with diagram of dollar trophy. This diagram is designed to depict concepts of goal and financial success. This professional slide helps in making an instant impact on viewers.

Business Man With Binocular For Profit Vision Powerpoint Template
This PPT slide has been designed with graphics of business man looking into binoculars. Download this diagram to portray concepts like financial planning. This slide is innovatively designed to highlight your worthy view.
Pie Chart With Seven Business Icons Powerpoint Templates
Our compelling template consists with a design of pie chart with seven business icons. This slide has been professionally designed to exhibit financial ratio analysis. This template offers an excellent background to build impressive presentation.
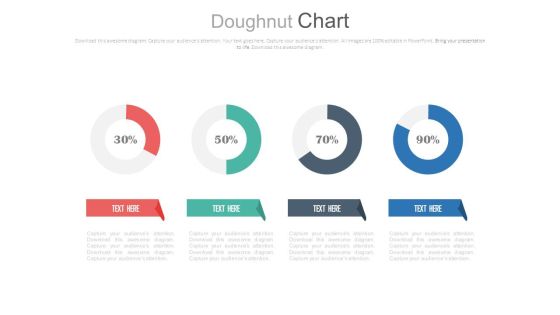
Four Circle Chart With Percentage Ratios Powerpoint Slides
This PowerPoint template has been designed with graphics of four circles and percentage ratios. You may use this dashboard slide design for topics like profit growth and financial planning. This PPT slide is powerful tool to describe your ideas.

Linear Circles Percentage Analysis Charts Powerpoint Slides
This PowerPoint template has been designed with graphics of three circles and percentage ratios. You may use this dashboard slide design for topics like profit growth and financial planning. This PPT slide is powerful tool to describe your ideas.

Departments And Team Hierarchy Chart Ppt PowerPoint Presentation Styles
This is a departments and team hierarchy chart ppt powerpoint presentation styles. This is a three stage process. The stages in this process are director, financial advisor, marketing head, manager, web designer, graphic designer.

Management Team Template 4 Ppt PowerPoint Presentation Layouts
This is a management team template 4 ppt powerpoint presentation layouts. This is a six stage process. The stages in this process are founder ceo, legal advisor, graphic designer, financial advisor, editor, web designer.

Our Team Ppt PowerPoint Presentation Show Sample
This is a our team ppt powerpoint presentation show sample. This is a seven stage process. The stages in this process are finance manager, web designer, financial advisor, sales marketing, product manager, graphic designer, editor, ceo.
Our Team Ppt PowerPoint Presentation Icon Topics
This is a our team ppt powerpoint presentation icon topics. This is a four stage process. The stages in this process are financial advisor, marketing head, graphic designer, web designer, team.

Our Team Ppt PowerPoint Presentation File Skills
This is a our team ppt powerpoint presentation file skills. This is a four stage process. The stages in this process are financial advisor, marketing head, graphic designer, web designer, team.

Our Team Ppt PowerPoint Presentation File Format
This is a our team ppt powerpoint presentation file format. This is a four stage process. The stages in this process are financial advisor, marketing head, graphic designer, web designer.
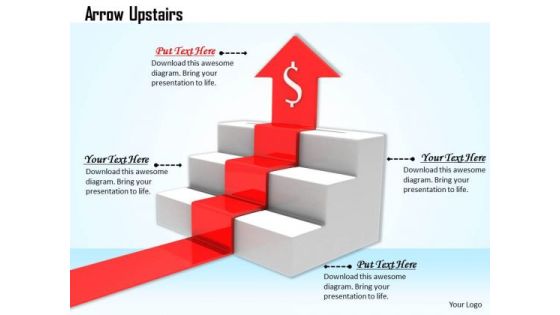
Stock Photo Red Arrow Moving Upwards In Stairs PowerPoint Slide
This image has been designed with red arrow moving upward on stairs with dollar symbol. This Image clearly relates to concept of financial growth. Use our image to drive the point to your audience and constantly attract their attention.

Stock Photo Red Growth Arrow With Percentage Symbol PowerPoint Slide
This image has been designed with red growth arrow with percentage symbol. This Image clearly relates to concept of financial growth. Use our image to drive the point to your audience and constantly attract their attention.

Stock Photo Smart Phone With Downturn Arrow At Display PowerPoint Slide
This image displays yellow downward arrow on tablet. This image has been designed to display progress in your presentations. Use this image, in your presentations to express views on financial degradation and losses. Create eye-catching presentations using this image.

Stock Photo Smartphone With Red Upward Arrow PowerPoint Slide
This image displays red growth arrow on tablet. This image has been designed to display progress in your presentations. Use this image, in your presentations to express views on financial growth, success and marketing. Create eye-catching presentations using this image.

Euro Currency In Puzzle Style For Finance Presentation Template
This Power Point template has been designed with graphic of euro and puzzle. This PPT contains the concept of financial problem resolving. Use this PPT for finance and business related presentation where you have to display euro currency related topics.
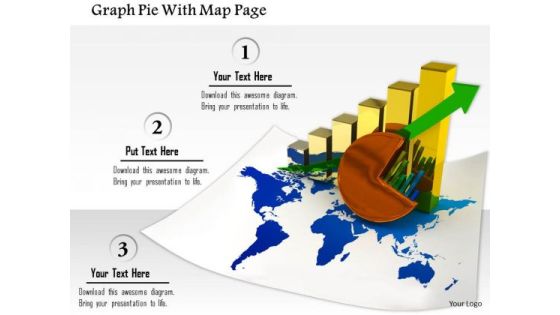
Stock Photo Graph Pie With Map Page PowerPoint Slide
This image slide contains business charts on world map. This image is designed with bar graph and pie chart on world map depicting global economy. Use this image slide to represent financial growth in any business presentation.

Stock Photo Hundred Percentage Inside Lock Safety PowerPoint Slide
Concept of financial safety has been displayed in this image slide with suitable graphics. This slide has been designed with graphic of hundred percentage value and lock. Use this professional slide to make build innovative presentation on safety related topics.
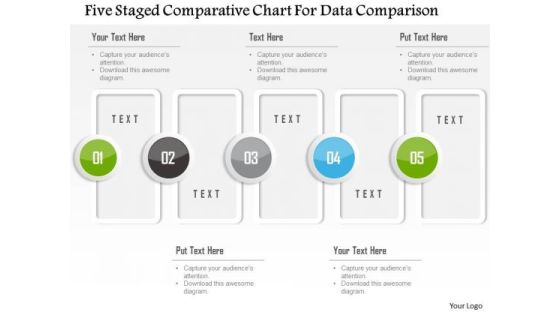
Business Diagram Five Staged Comparative Chart For Data Comparison Presentation Template
Five staged comparative chart has been used to design this power point template. This PPT contains the concept of data comparison. Use this PPT for your business and finance based data comparison in any financial presentation.

Stock Photo Dollars Covered With Lock And Chain PowerPoint Slide
This Power Point image template has been designed with graphic of dollar and chain. In this image dollar is covered with chain which shows the concept of safety. Use this image template financial security related presentations.
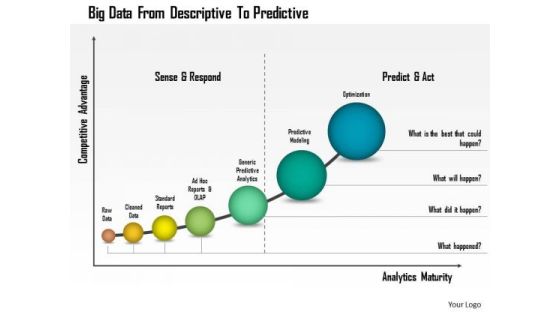
Business Diagram Big Data From Descriptive To Predictive Presentation Template
This business diagram has been designed with graphic of linear bar graph. This growing bar graph depicts the concept of big data analysis. Use this professional diagram for your financial and business analysis.

Business Diagram Diagram For Visual Data Display Presentation Template
Four colored cylindrical bars with percentage values are used to design this power point template. This diagram slide helps to display financial data analysis. Use this diagram for your business and finance related presentations.

3d Man On The Top Of Puzzle Bar Graph
This PPT has been designed with graphic of 3d man and puzzle are graph. This PPT displays the concept of result analysis and financial growth. Use this PPT for your business and finance related presentations.
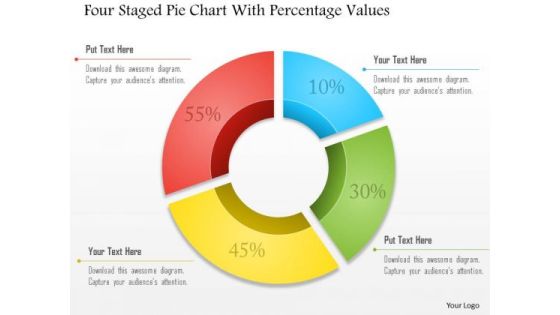
Business Diagram Four Staged Pie Chart With Percentage Values Presentation Template
Four staged pie chart and percentage values are used to design this business slide. Download this diagram to make business and financial reports. Use our above diagram to express information in a visual way.
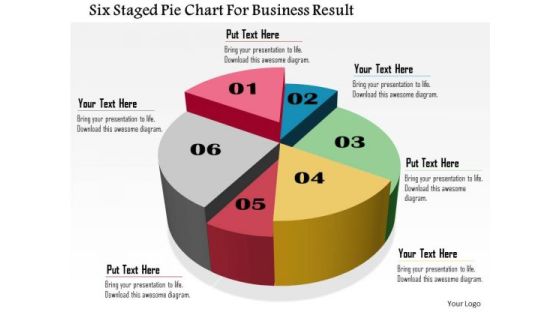
Business Daigram Six Staged Pie Chart For Business Result Presentation Templets
Six staged pie chart is used to design this business slide. Download this diagram to make business and financial reports. Use our above diagram to express information in a visual way.
Four Icons In Vertical Order PowerPoint Template
Concept of financial planning can be explained with this diagram. It contains graphics of four icons in vertical order. You can use this design to complement your business presentation.
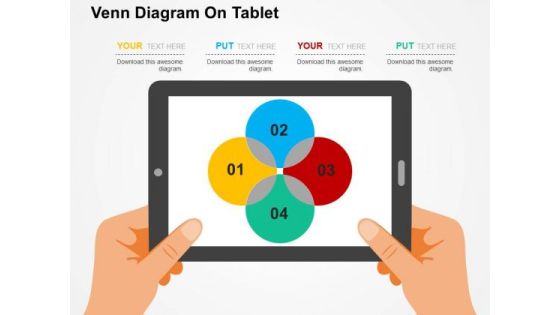
Venn Diagram On Tablet PowerPoint Template
Adjust the above image into your Presentations to visually support your content. This slide has been professionally designed with Venn diagram. This template offers an excellent background to display financial analysis.

People Thoughts For Business Planning PowerPoint Templates
This creative slide has been designed with graphics of team icons. Use this unique slide in presentations related to business and financial planning. This template adds value to your idea.

Dollar Infographic For Equity Accounting Powerpoint Template
Our professionally designed business diagram is as an effective tool for communicating concept of equity accounting. It contains dollar infographic diagram. Above slide is suitable to display financial planning and strategy.

Dollar Bulb With Idea Success Tags Powerpoint Template
Our above slide contains graphics of light bulb with dollars and idea success tags. It helps to display concepts of financial idea planning and success. Develop your strategy and communicate with your team with this professional slide design.
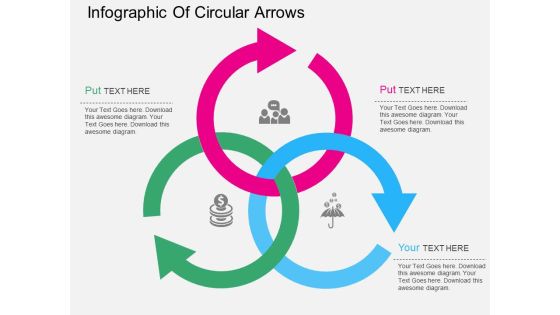
Infographic Of Circular Arrows Powerpoint Templates
This PPT slide has been designed with intersecting circular arrows. This PowerPoint template is suitable to present financial strategy for business. This professional slide helps in making an instant impact on viewers.
Four Twisted Arrows With Creative Icons Powerpoint Template
This PowerPoint template has been designed with four twisted arrows and creative icons. This business diagram helps to exhibit financial accounting systems. Use this diagram to build an exclusive presentation.

Colorful Cards With Icons For Technology Powerpoint Templates
This slide has been designed with graphics of colorful cards with icons of bulb, dollar, gear and magnifier. You may download this slide for financial analysis. Deliver amazing presentations to mesmerize your audience.
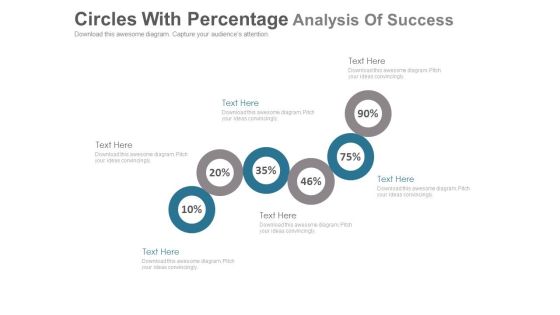
Six Circles For Percentage Value Analysis Powerpoint Slides
This PowerPoint template has been designed with six circles and percentage values. This PPT slide can be used to display financial ratio analysis. You can download finance PowerPoint template to prepare awesome presentations.

Three Human Faces In Question Mark Shape Powerpoint Templates
Adjust the above image into your Presentations to visually support your content. This slide has been professionally designed to financial targets. This template offers an excellent background to build impressive presentation.

Three Text Tags With Alphabets Powerpoint Templates
The above template displays a diagram of circular arrows with icons. This diagram has been professionally designed to display steps of financial planning. Capture the attention of your audience.
Four Banners With Finance Icons Powerpoint Template
This PowerPoint template has been designed with graphics of four banners with finance icons. Download this professional slide to depict steps of financial planning. Enlighten your audience with your breathtaking ideas.
Five Pointers With Science And Education Icons Powerpoint Template
Our professionally designed business diagram is as an effective tool for communicating concept of science and education. It contains five pointers infographic diagram. Above slide is also suitable to display financial planning and strategy.

Infographic Of Puzzle Bag Powerpoint Templates
Adjust the above image into your presentations to visually support your content. This slide has been professionally designed with puzzle bag infographic. This template offers an excellent background to build financial target related presentation.

 Home
Home