Financial Model

Startup Company Valuation Methodologies Valuation Factors Details For Startup Company Download PDF
This slide shows the valuation factors details for startup company which include market size, revenue potential, intellectual property, founders and team, etc.Presenting Startup Company Valuation Methodologies Valuation Factors Details For Startup Company Download PDF to provide visual cues and insights. Share and navigate important information on five stages that need your due attention. This template can be used to pitch topics like Revenue Potential, Intellectual Property, Founders And Team In addtion, this PPT design contains high resolution images, graphics, etc, that are easily editable and available for immediate download.

Annual Comparative Assessment Of New Client Acquire Dashboard Topics PDF
The below slide depicts the variance in actual and target KPIs in customer acquisition. It includes previous vs actual year revenue, new customers, average revenue per customer, customer acquisition cost etc. Showcasing this set of slides titled Annual Comparative Assessment Of New Client Acquire Dashboard Topics PDF The topics addressed in these templates are Annual Comparative Assessment OF New Client Acquire Dashboard All the content presented in this PPT design is completely editable. Download it and make adjustments in color, background, font etc. as per your unique business setting.

Statistics Indicating Impact Of Employee Appreciation Program On Business Graphics PDF
This slide shows facts and figures of employee recognition program impact on business. It provides information such as revenue per full time equivalent FTE, customer retention and employee retention. Showcasing this set of slides titled Statistics Indicating Impact Of Employee Appreciation Program On Business Graphics PDF. The topics addressed in these templates are Employee Recognition Program, Revenue Per FTE, Customer Retention. All the content presented in this PPT design is completely editable. Download it and make adjustments in color, background, font etc. as per your unique business setting.
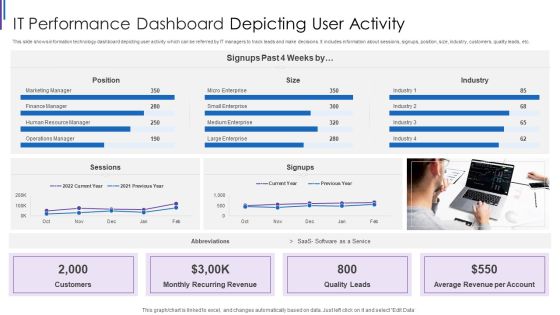
IT Performance Dashboard Depicting User Activity Inspiration PDF
This slide shows information technology dashboard depicting user activity which can be referred by IT managers to track leads and make decisions. It includes information about sessions, signups, position, size, industry, customers, quality leads, etc. Pitch your topic with ease and precision using this IT Performance Dashboard Depicting User Activity Inspiration PDF. This layout presents information on Monthly Recurring Revenue, Average Revenue Per, Account Quality Leads, Customers Position Sessions. It is also available for immediate download and adjustment. So, changes can be made in the color, design, graphics or any other component to create a unique layout.

Business Process Outsourcing Company Profile Competitive Analysis Of Companies Diagrams PDF
This slide highlights the competitive analysis of call center companies on the basis of total languages supported, total industries covered, call resolution rate, employee count, revenue and net profit. Presenting Business Process Outsourcing Company Profile Competitive Analysis Of Companies Diagrams PDF to provide visual cues and insights. Share and navigate important information on one stages that need your due attention. This template can be used to pitch topics like Call Resolution Rate, Revenue, Competitor. In addtion, this PPT design contains high resolution images, graphics, etc, that are easily editable and available for immediate download.
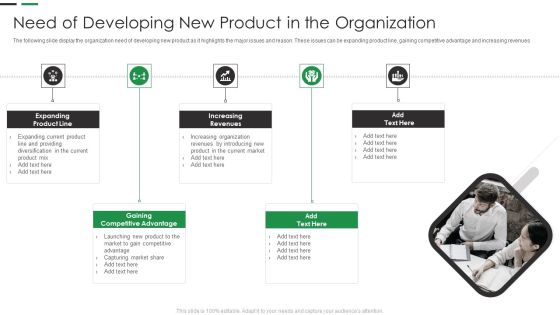
Evaluating New Commodity Impact On Market Need Of Developing New Product Graphics PDF
The following slide display the organization need of developing new product as it highlights the major issues and reason. These issues can be expanding product line, gaining competitive advantage and increasing revenues Presenting Evaluating New Commodity Impact On Market Need Of Developing New Product Graphics PDF to provide visual cues and insights. Share and navigate important information on five stages that need your due attention. This template can be used to pitch topics like Expanding Product, Increasing Revenues, Competitive Advantage In addtion, this PPT design contains high resolution images, graphics, etc, that are easily editable and available for immediate download.
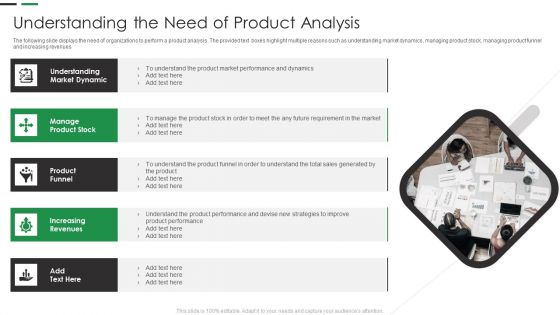
Evaluating New Commodity Impact On Market Understanding The Need Of Product Analysis Infographics PDF
The following slide displays the need of organizations to perform a product analysis. The provided text boxes highlight multiple reasons such as understanding market dynamics, managing product stock, managing product funnel and increasing revenues Presenting Evaluating New Commodity Impact On Market Understanding The Need Of Product Analysis Infographics PDF to provide visual cues and insights. Share and navigate important information on five stages that need your due attention. This template can be used to pitch topics like Understanding Market, Product Funnel, Increasing Revenues In addtion, this PPT design contains high resolution images, graphics, etc, that are easily editable and available for immediate download.

New Commodity Market Viability Review Understanding The Need Of Product Analysis Slides PDF
The following slide displays the need of organizations to perform a product analysis. The provided text boxes highlight multiple reasons such as understanding market dynamics, managing product stock, managing product funnel and increasing revenues Presenting New Commodity Market Viability Review Understanding The Need Of Product Analysis Slides PDF to provide visual cues and insights. Share and navigate important information on five stages that need your due attention. This template can be used to pitch topics like Understanding Market, Manage Product, Increasing Revenues In addtion, this PPT design contains high resolution images, graphics, etc, that are easily editable and available for immediate download.

New Commodity Market Viability Review Need Of Developing New Product Download PDF
The following slide display the organization need of developing new product as it highlights the major issues and reason. These issues can be expanding product line, gaining competitive advantage and increasing revenues Presenting New Commodity Market Viability Review Need Of Developing New Product Download PDF to provide visual cues and insights. Share and navigate important information on five stages that need your due attention. This template can be used to pitch topics like Expanding Product, Gaining Competitive, Increasing Revenues In addtion, this PPT design contains high resolution images, graphics, etc, that are easily editable and available for immediate download.

CIO Role In Digital Evolution Why Your Organization Needs Digital Skills Training Template PDF
This slide shows the reasons that why the organization requires digital skill training such as to motivate employees, to drive revenue, to generate significant cost savings etc. Presenting CIO Role In Digital Evolution Why Your Organization Needs Digital Skills Training Template PDF to provide visual cues and insights. Share and navigate important information on three stages that need your due attention. This template can be used to pitch topics like Motivate Employees, Generate More, Revenue. In addtion, this PPT design contains high resolution images, graphics, etc, that are easily editable and available for immediate download.

Product Pricing Strategies Analysis Effect Of Poor Product Pricing In Company Portrait PDF
This slide covers the effect of poor product pricing within the company such as revenues, customer churn, product cost, goodwill, productivity, profits, etc. Presenting Product Pricing Strategies Analysis Effect Of Poor Product Pricing In Company Portrait PDF to provide visual cues and insights. Share and navigate important information on six stages that need your due attention. This template can be used to pitch topics like Companys Revenues Lost, Increasing Customer Churn, Charging High Product. In addtion, this PPT design contains high resolution images, graphics, etc, that are easily editable and available for immediate download.

ERP Digital Transformation Journey Defining Our Digital Ambition Demonstration PDF
The following slide defines the ambitions and goals of the organization that they are willing to achieve by successfully implementing digital transformation. These ambitions can be increasing the speed to market, increasing overall revenues, increase employee productivity and digitalize the basic operational process of the organization. Presenting ERP Digital Transformation Journey Defining Our Digital Ambition Demonstration PDF to provide visual cues and insights. Share and navigate important information on five stages that need your due attention. This template can be used to pitch topics like Increase Revenues, Increase Employee Productivity, Digitalize Process. In addtion, this PPT design contains high resolution images, graphics, etc, that are easily editable and available for immediate download.

ERP Digital Transformation Journey Impact Of Digital Transformation On Organization Pictures PDF
Purpose of the following slide is to display and analyze the impact of digital transformation over the organization. These impacts can be increase in revenues, decrease in operational cost, increase in customer satisfaction etc. Presenting ERP Digital Transformation Journey Impact Of Digital Transformation On Organization Pictures PDF to provide visual cues and insights. Share and navigate important information on five stages that need your due attention. This template can be used to pitch topics like Increase Revenues, Automated Process, Increased Customer. In addtion, this PPT design contains high resolution images, graphics, etc, that are easily editable and available for immediate download.

Comparative Monthly Sales Report By Region Graphics PDF
The following slide highlights the comparative monthly sales by region illustrating key headings which includes monthly sales by region, monthly sales by quantity, product sales distribution and monthly sales revenue by product. Showcasing this set of slides titled Comparative Monthly Sales Report By Region Graphics PDF. The topics addressed in these templates are Sales Revenue, Monthly Sales Quantity, Product Sales Distribution. All the content presented in this PPT design is completely editable. Download it and make adjustments in color, background, font etc. as per your unique business setting.

Business Overview Of A Technology Firm Geographic Presence Of The Company Mockup PDF
This slide covers the companys geographical presence map along with the Top 10 Countries from which the company generated its highest revenue in 2022. Presenting Business Overview Of A Technology Firm Geographic Presence Of The Company Mockup PDF to provide visual cues and insights. Share and navigate important information on five stages that need your due attention. This template can be used to pitch topics like Revenue, Profit Margin, Geographic Presence. In addtion, this PPT design contains high resolution images, graphics, etc, that are easily editable and available for immediate download.
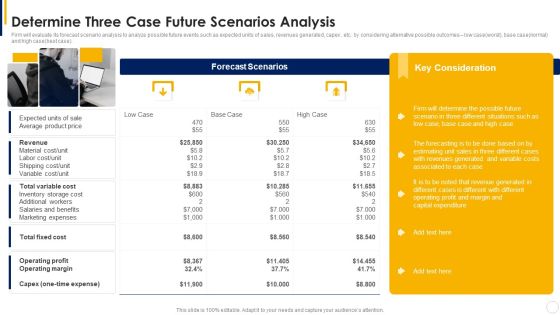
Manual To Develop Strawman Proposal Determine Three Case Future Scenarios Analysis Portrait PDF
Firm will evaluate its forecast scenario analysis to analyze possible future events such as expected units of sales, revenues generated, capex , etc. by considering alternative possible outcomes low case worst, base case normal and high case best case. Presenting Manual To Develop Strawman Proposal Determine Three Case Future Scenarios Analysis Portrait PDF to provide visual cues and insights. Share and navigate important information on three stages that need your due attention. This template can be used to pitch topics like Revenue, Total Fixed Cost, Operating Margin. In addtion, this PPT design contains high resolution images, graphics, etc, that are easily editable and available for immediate download.
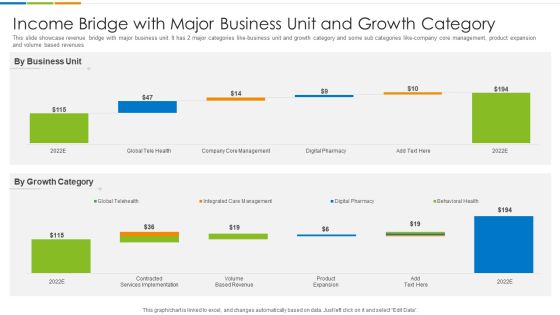
Income Bridge With Major Business Unit And Growth Category Ppt PowerPoint Presentation Gallery Format PDF
This slide showcase revenue bridge with major business unit. It has 2 major categories like-business unit and growth category and some sub categories like-company core management, product expansion and volume based revenues. Showcasing this set of slides titled Income Bridge With Major Business Unit And Growth Category Ppt PowerPoint Presentation Gallery Format PDF. The topics addressed in these templates are Business Unit, Growth Category, Product Expansion. All the content presented in this PPT design is completely editable. Download it and make adjustments in color, background, font etc. as per your unique business setting.
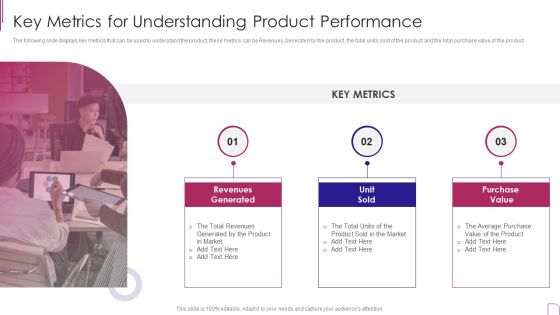
Yearly Product Performance Assessment Repor Key Metrics For Understanding Product Formats PDF
The following slide displays key metrics that can be used to understand the product, these metrics can be Revenues Generated by the product, the total units sold of the product and the total purchase value of the product.Presenting Yearly Product Performance Assessment Repor Key Metrics For Understanding Product Formats PDF to provide visual cues and insights. Share and navigate important information on three stages that need your due attention. This template can be used to pitch topics like Revenues Generated, Purchase Value, Generated Product In addtion, this PPT design contains high resolution images, graphics, etc, that are easily editable and available for immediate download.

Company Pitch Deck Our Company Traction Brochure PDF
This slide provides the glimpse about our business traction which measures how our startup business is growing in terms of customers, annual revenue, user growth, etc.Presenting Company Pitch Deck Our Company Traction Brochure PDF to provide visual cues and insights. Share and navigate important information on four stages that need your due attention. This template can be used to pitch topics like Annual Revenue, Updates Buffered, Paying Customers In addtion, this PPT design contains high resolution images, graphics, etc, that are easily editable and available for immediate download.
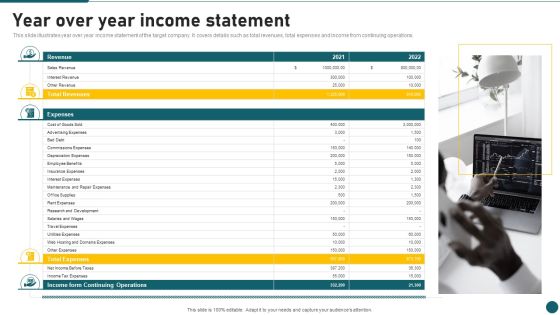
Due Diligence In Amalgamation And Acquisition Year Over Year Income Statement Information PDF
This slide illustrates year over year income statement of the target company. It covers details such as total revenues, total expenses and income from continuing operations. Presenting Due Diligence In Amalgamation And Acquisition Year Over Year Income Statement Information PDF to provide visual cues and insights. Share and navigate important information on one stages that need your due attention. This template can be used to pitch topics like Total Revenues, Expenses, Cost. In addtion, this PPT design contains high resolution images, graphics, etc, that are easily editable and available for immediate download.

New Service Launch And Development Strategy To Gain Market Share What Organization Can Expect Portrait PDF
This slide showcases purpose of new launch that can help organization to identify the goals before conducting promotion and launching new service. Its key components are increase revenue, increase market share and competitor edge.Presenting New Service Launch And Development Strategy To Gain Market Share What Organization Can Expect Portrait PDF to provide visual cues and insights. Share and navigate important information on three stages that need your due attention. This template can be used to pitch topics like Expected Benefits, Introducing Service, Increase In Revenue In addtion, this PPT design contains high resolution images, graphics, etc, that are easily editable and available for immediate download.
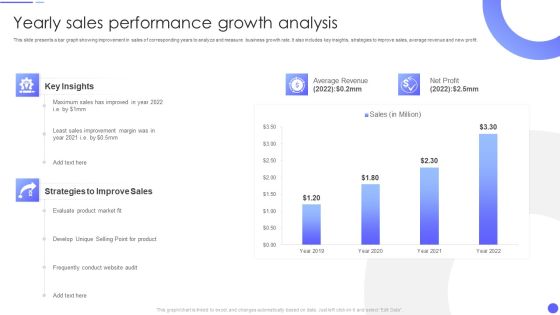
Yearly Sales Performance Growth Analysis Rules PDF
This slide presents a bar graph showing improvement in sales of corresponding years to analyze and measure business growth rate. It also includes key insights, strategies to improve sales, average revenue and new profit.Pitch your topic with ease and precision using this Yearly Sales Performance Growth Analysis Rules PDF This layout presents information on Average Revenue, Strategies To Improve, Sales Improvement It is also available for immediate download and adjustment. So, changes can be made in the color, design, graphics or any other component to create a unique layout.
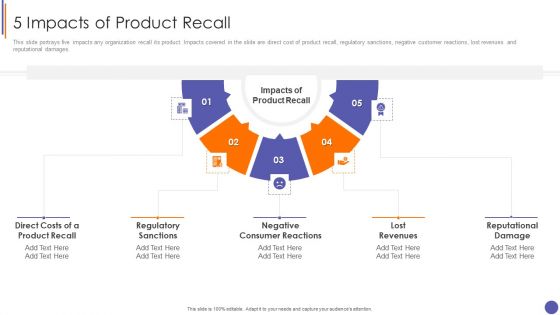
Contents For QA Plan And Process Set 3 5 Impacts Of Product Recall Themes PDF
This slide portrays five impacts any organization recall its product. Impacts covered in the slide are direct cost of product recall, regulatory sanctions, negative customer reactions, lost revenues and reputational damages.Presenting Contents For QA Plan And Process Set 3 5 Impacts Of Product Recall Themes PDF to provide visual cues and insights. Share and navigate important information on five stages that need your due attention. This template can be used to pitch topics like Consumer Reactions, Regulatory Sanctions, Lost Revenues In addtion, this PPT design contains high resolution images, graphics, etc, that are easily editable and available for immediate download.

Customer Retention Business Monthly Report Summary With Graphs Guidelines PDF
The Following Slide highlights the Customer Retention Monthly Report with graphs . It showcases data and graphs with headings, metrics, current month, last month , change , customer churn , revenue churn , net retention and MRR growth. Showcasing this set of slides titled Customer Retention Business Monthly Report Summary With Graphs Guidelines PDF The topics addressed in these templates are Recurring Revenue, Customer Churn, Promoter Score All the content presented in this PPT design is completely editable. Download it and make adjustments in color, background, font etc. as per your unique business setting.
Marketing And Operations Dashboard For Ecommerce Business Icons PDF
This slide covers sales and operations dashboard for ecommerce business. It involves details such as total sales generated, number of brands, total revenue generated, number of units sold and gender and age range breakdown. Showcasing this set of slides titled Marketing And Operations Dashboard For Ecommerce Business Icons PDF. The topics addressed in these templates are Total Sales Generated, Total Revenue Generated, Returning Consumers. All the content presented in this PPT design is completely editable. Download it and make adjustments in color, background, font etc. as per your unique business setting.

Packaged Food Firm Description Products And Brands Pictures PDF
The slide highlights the major products and brands of the company. It depicts three categories and sixteen brands which includes chips, popcorns, cholates, wafers, coconut water, juice, soft drink, zero sugar drink, milk, cheese, ice cream and yogurt.Presenting Packaged Food Firm Description Products And Brands Pictures PDF to provide visual cues and insights. Share and navigate important information on three stages that need your due attention. This template can be used to pitch topics like Share Revenue, Grown Business, Revenue. In addtion, this PPT design contains high resolution images, graphics, etc, that are easily editable and available for immediate download.

Dashboard For International Logistics KPI Via Third Party Carriers Rules PDF
The following slide highlights the dashboard for international transportation via third party carriers illustrating total shipment, payment method, revenue, shipment status and shipment details such as company, tracking id, Item, weight, address, payment, status to monitor the transportation. Showcasing this set of slides titled Dashboard For International Logistics KPI Via Third Party Carriers Rules PDF. The topics addressed in these templates are Total Shipment, Payment Method, Revenue, 20. All the content presented in this PPT design is completely editable. Download it and make adjustments in color, background, font etc. as per your unique business setting.

Various Kpis To Measure Time To Market Strategy Infographics PDF
This slide shows key performance indicators which can be used to track time to market of a product. It includes monthly recurring revenue, customer acquisition cost, net revenue retention, etc. Showcasing this set of slides titled Various Kpis To Measure Time To Market Strategy Infographics PDF. The topics addressed in these templates are Customer Acquisition, Customer Lifetime, Monthly Recurring. All the content presented in this PPT design is completely editable. Download it and make adjustments in color, background, font etc. as per your unique business setting.

Playbook For Sales Growth Strategies How To Measure Organic Growth Clipart PDF
Purpose of the following slide is to show multiple metrics that the organization can use to track performance of their organic growth strategies, these can be revenues generated, market penetration, increase in referral rate etc. Presenting Playbook For Sales Growth Strategies How To Measure Organic Growth Clipart PDF to provide visual cues and insights. Share and navigate important information on four stages that need your due attention. This template can be used to pitch topics like Metrics, Expected Increase, Revenues, Market Penetration. In addtion, this PPT design contains high resolution images, graphics, etc, that are easily editable and available for immediate download.

Marketing Strategy For Shipping Business Key Performance Indicator Dashboard Graphics PDF
The following slide depicts the key areas in Marketing Strategy for Shipping Business to monitor and optimize supply chain processes. It includes elements such as fleet and shipment status, country wise revenue, location wise delivery, average shipment time etc.Pitch your topic with ease and precision using this Marketing Strategy For Shipping Business Key Performance Indicator Dashboard Graphics PDF. This layout presents information on Shipment Status, Average Shipment, Wise Revenue. It is also available for immediate download and adjustment. So, changes can be made in the color, design, graphics or any other component to create a unique layout.

Information Studies Data Science In Airlines Department Rules PDF
This slide depicts the data science role in airlines and its benefits that cover revenue management and route planning, food supply in flights, facial recognition and plan preparation on time for the next flight. Presenting Information Studies Data Science In Airlines Department Rules PDF to provide visual cues and insights. Share and navigate important information on five stages that need your due attention. This template can be used to pitch topics like Revenue Management, Preparing Plane, Facial Recognition. In addtion, this PPT design contains high resolution images, graphics, etc, that are easily editable and available for immediate download.

Metrics And Objectives To Measure Employees Performance Clipart PDF
The purpose of this slide is to showcase different KPIs and objectives used to measure employee efficiency. The KPI could be Revenue per employee profit per employee average task completion rate and utilization rate. Showcasing this set of slides titled Metrics And Objectives To Measure Employees Performance Clipart PDF. The topics addressed in these templates are Utilization Rate, Profit Per Employee, Revenue Per Employee. All the content presented in this PPT design is completely editable. Download it and make adjustments in color, background, font etc. as per your unique business setting.
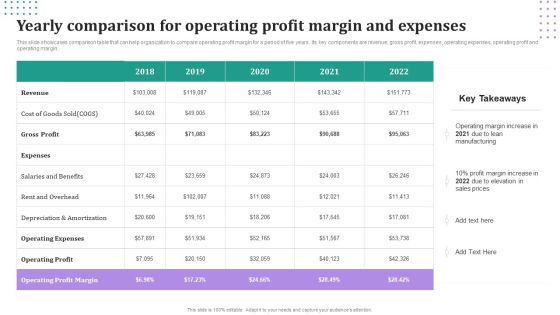
Yearly Comparison For Operating Profit Margin And Expenses Demonstration PDF
This slide showcases comparison table that can help organization to compare operating profit margin for a period of five years. Its key components are revenue, gross profit, expenses, operating expenses, operating profit and operating margin. Showcasing this set of slides titled Yearly Comparison For Operating Profit Margin And Expenses Demonstration PDF. The topics addressed in these templates are Gross Profit, Revenue, Operating Expenses. All the content presented in this PPT design is completely editable. Download it and make adjustments in color, background, font etc. as per your unique business setting.

Sales Procedure Automation To Enhance Sales Why Sales Pipeline Management Is Important Inspiration PDF
This slide focuses on importance of sales pipeline management such as accurate forecasting, targeted resource allocation, effective sales team management and improves sales volume and revenues.Presenting Sales Procedure Automation To Enhance Sales Why Sales Pipeline Management Is Important Inspiration PDF to provide visual cues and insights. Share and navigate important information on four stages that need your due attention. This template can be used to pitch topics like Accurate Forecasting, Targeted Resource, Volume Revenues. In addtion, this PPT design contains high resolution images, graphics, etc, that are easily editable and available for immediate download.
Digitalization Of Transportation Enterprise Defining Our Digital Ambition Icons PDF
The following slide defines the ambitions and goals of the organization that they are willing to achieve by successfully implementing digital transformation. These ambitions can be increasing the speed to market, increasing overall revenues, increase employee productivity and digitalize the basic operational process of the organization. Presenting Digitalization Of Transportation Enterprise Defining Our Digital Ambition Icons PDF to provide visual cues and insights. Share and navigate important information on five stages that need your due attention. This template can be used to pitch topics like Increase Revenues, Digitalize The Process, Increase Employee Productivity. In addtion, this PPT design contains high resolution images, graphics, etc, that are easily editable and available for immediate download.

Digitalization Of Transportation Enterprise Impact Of Digital Transformation On Organization Clipart PDF
Purpose of the following slide is to display and analyze the impact of digital transformation over the organization. These impacts can be increase in revenues, decrease in operational cost, increase in customer satisfaction etc. Presenting Digitalization Of Transportation Enterprise Impact Of Digital Transformation On Organization Clipart PDF to provide visual cues and insights. Share and navigate important information on five stages that need your due attention. This template can be used to pitch topics like Increase Revenues, Satisfaction Rate, Operational Cost. In addtion, this PPT design contains high resolution images, graphics, etc, that are easily editable and available for immediate download.

B2B Sales Techniques Playbook Metrices To Track Sales Team Performance Formats PDF
This slide provides information regarding various metrics catered to track sales team performance in terms of average revenue per account, win rate, NPS, along with sales representative performance tracking through number of opportunities created, lead response time, etc. Presenting B2B Sales Techniques Playbook Metrices To Track Sales Team Performance Formats PDF to provide visual cues and insights. Share and navigate important information on four stages that need your due attention. This template can be used to pitch topics like Conversations Representative, Opportunities Created, Sales Revenues. In addtion, this PPT design contains high resolution images, graphics, etc, that are easily editable and available for immediate download.

Quarterly Overall Business Performance Assessment With Kpi Dashboard Microsoft PDF
The given below slide showcases the overall business performance to evaluate the trends and KPAs. It includes quarterly insights of elements such as revenue, new customers, net profit, customer satisfaction, sales profitability, growth etc. Pitch your topic with ease and precision using this Quarterly Overall Business Performance Assessment With Kpi Dashboard Microsoft PDF. This layout presents information on Revenue, Customer Satisfaction, Net Profit. It is also available for immediate download and adjustment. So, changes can be made in the color, design, graphics or any other component to create a unique layout.

Quarterly Sales Team Performance Analysis Kpis Slides PDF
The following slide depicts the efforts made my sales team in increasing companys growth. It also includes KPAs such as new customers acquired, sales, profit, average revenue per unit, customer lifetime value, acquisition cost etc. Showcasing this set of slides titled Quarterly Sales Team Performance Analysis Kpis Slides PDF. The topics addressed in these templates are Above Sales Target, Average Sales Revenue, Average Customer. All the content presented in this PPT design is completely editable. Download it and make adjustments in color, background, font etc. as per your unique business setting.

Social Network Promotion Campaign Performance Report Demonstration PDF
The purpose of this slide is to highlight the digital marketing campaigning performance report to track information in real-time like new leads acquired, total leads, and revenue on monthly basis. The leads generated through various platforms are Twitter, Facebook, LinkedIn, etc. Pitch your topic with ease and precision using this Social Network Promotion Campaign Performance Report Demonstration PDF. This layout presents information on Sales Ready Leads, New Leads, New Revenue. It is also available for immediate download and adjustment. So, changes can be made in the color, design, graphics or any other component to create a unique layout.

Metrics To Measure Success Of Conversational Marketing Elements PDF
Purpose of the following slide is to display key metrics that can help organization in measuring the success of conversational marketing. These metrics can be segregated into 4 major categories such as artificial intelligence, chat, revenue growth and marketing metrics. Presenting Metrics To Measure Success Of Conversational Marketing Elements PDF to provide visual cues and insights. Share and navigate important information on four stages that need your due attention. This template can be used to pitch topics like Artificial Intelligence Metrics, Chat Metrics, Revenue Growth Metrics. In addtion, this PPT design contains high resolution images, graphics, etc, that are easily editable and available for immediate download.
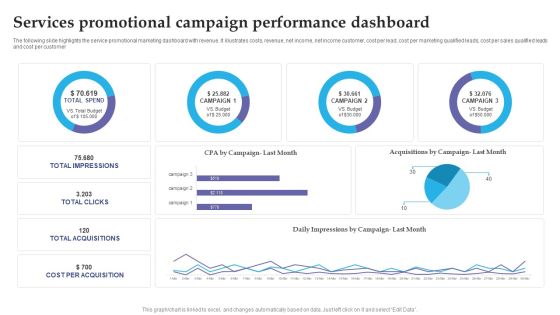
Services Promotional Campaign Performance Dashboard Slides PDF
The following slide highlights the service promotional marketing dashboard with revenue. It illustrates costs, revenue, net income, net income customer, cost per lead, cost per marketing qualified leads, cost per sales qualified leads and cost per customer. Pitch your topic with ease and precision using this Services Promotional Campaign Performance Dashboard Slides PDF. This layout presents information on Services Promotional, Campaign Performance Dashboard. It is also available for immediate download and adjustment. So, changes can be made in the color, design, graphics or any other component to create a unique layout.
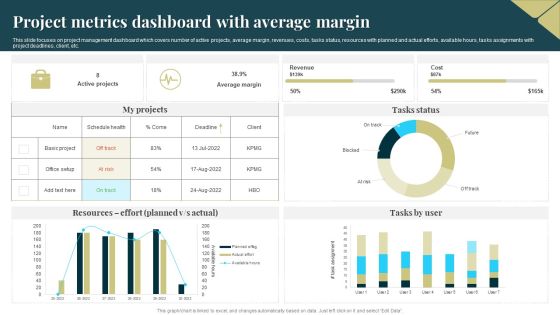
Project Metrics Dashboard With Average Margin Sample PDF
This slide focuses on project management dashboard which covers number of active projects, average margin, revenues, costs, tasks status, resources with planned and actual efforts, available hours, tasks assignments with project deadlines, client, etc. Pitch your topic with ease and precision using this Project Metrics Dashboard With Average Margin Sample PDF. This layout presents information on Average Margin, Revenue, Cost. It is also available for immediate download and adjustment. So, changes can be made in the color, design, graphics or any other component to create a unique layout.
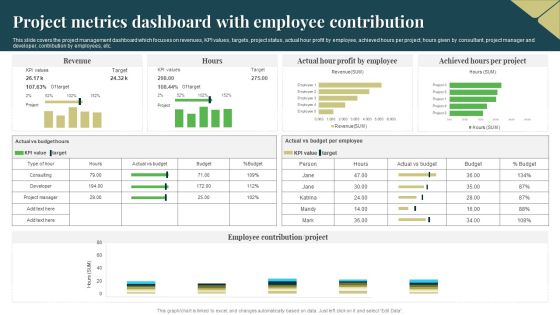
Project Metrics Dashboard With Employee Contribution Guidelines PDF
This slide covers the project management dashboard which focuses on revenues, KPI values, targets, project status, actual hour profit by employee, achieved hours per project, hours given by consultant, project manager and developer, contribution by employees, etc. Showcasing this set of slides titled Project Metrics Dashboard With Employee Contribution Guidelines PDF. The topics addressed in these templates are Target, Revenue, Profit By Employee. All the content presented in this PPT design is completely editable. Download it and make adjustments in color, background, font etc. as per your unique business setting.
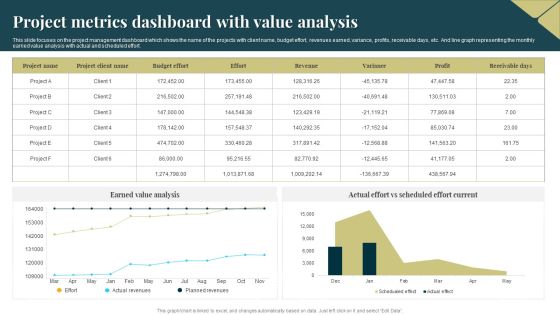
Project Metrics Dashboard With Value Analysis Introduction PDF
This slide focuses on the project management dashboard which shows the name of the projects with client name, budget effort, revenues earned, variance, profits, receivable days, etc. And line graph representing the monthly earned value analysis with actual and scheduled effort. Showcasing this set of slides titled Project Metrics Dashboard With Value Analysis Introduction PDF. The topics addressed in these templates are Budget Effort, Revenues, Earned Value Analysis. All the content presented in this PPT design is completely editable. Download it and make adjustments in color, background, font etc. as per your unique business setting.
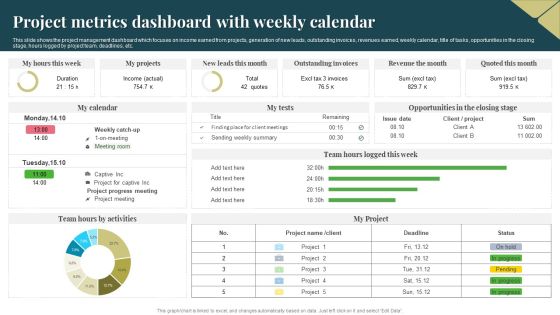
Project Metrics Dashboard With Weekly Calendar Download PDF
This slide shows the project management dashboard which focuses on income earned from projects, generation of new leads, outstanding invoices, revenues earned, weekly calendar, title of tasks, opportunities in the closing stage, hours logged by project team, deadlines, etc. Pitch your topic with ease and precision using this Project Metrics Dashboard With Weekly Calendar Download PDF. This layout presents information on Income, Revenue, Project. It is also available for immediate download and adjustment. So, changes can be made in the color, design, graphics or any other component to create a unique layout.

Infotech Solutions Research And Development Company Summary Our Journey Infographics PDF
The slide highlights the company journey with multiple milestones illustrating incorporation, geographic expansion, revenue milestone, global services, patents, and new service expansion. Presenting Infotech Solutions Research And Development Company Summary Our Journey Infographics PDF to provide visual cues and insights. Share and navigate important information on six stages that need your due attention. This template can be used to pitch topics like Revenue, Technology Innovation, Business. In addtion, this PPT design contains high resolution images, graphics, etc, that are easily editable and available for immediate download.

Determine Value Creation For 5G Operators 5G Network Architecture Instructions Portrait PDF
This slide provides details regarding value creation for 5G operators in terms of core business, use cases and ecosystem investment. Presenting Determine Value Creation For 5G Operators 5G Network Architecture Instructions Portrait PDF to provide visual cues and insights. Share and navigate important information on three stages that need your due attention. This template can be used to pitch topics like Operators Needs, Enhance Revenue, Revenue Streams. In addtion, this PPT design contains high resolution images, graphics, etc, that are easily editable and available for immediate download.

Business Key Performance Metrics Review Dashboard Portrait PDF
The following slide shows a dashboard of sales strategy review of firm that can be used by marketing, product, finance managers for reviewing the business. It further includes KPI that are revenue, new customer, gross profit purchaser satisfaction, income comparison, sales categories and profitability. Showcasing this set of slides titled Business Key Performance Metrics Review Dashboard Portrait PDF. The topics addressed in these templates are Sales, Revenue Comparison, Profitability. All the content presented in this PPT design is completely editable. Download it and make adjustments in color, background, font etc. as per your unique business setting.

Web Usage Analysis Summary Dashboard To Track Performance Background PDF
This slide covers website usage analytics report for tracking performs. It involves all details about number of visitors, leads, consumer, major landing pages and average revenue per consumer. Showcasing this set of slides titled Web Usage Analysis Summary Dashboard To Track Performance Background PDF. The topics addressed in these templates are Customer Churn Rate, Bounce Rate, Monthly Recurring Revenue. All the content presented in this PPT design is completely editable. Download it and make adjustments in color, background, font etc. as per your unique business setting.

Data Valuation And Monetization Key Barriers Associated To Monetizing Of Data Sample PDF
This slide covers information regarding key constraints associated to monetization of data such as data security and privacy concerns, revenue potential reduction, etc.Presenting Data Valuation And Monetization Key Barriers Associated To Monetizing Of Data Sample PDF to provide visual cues and insights. Share and navigate important information on three stages that need your due attention. This template can be used to pitch topics like Security Privacy, Reduce Revenue, Implementing Successful. In addtion, this PPT design contains high resolution images, graphics, etc, that are easily editable and available for immediate download.

Term Life And General Insurance Company Profile Company Overview Guidelines PDF
The slide highlights the information of insurance company along with specialty and awards and recognition. Company details showcases organization name, industry, headquarters, incorporation year, chief executive officer, employees count, revenue, profit, market value and products category. Presenting Term Life And General Insurance Company Profile Company Overview Guidelines PDF to provide visual cues and insights. Share and navigate important information on eight stages that need your due attention. This template can be used to pitch topics like Revenues, Profits, Market Value. In addtion, this PPT design contains high resolution images, graphics, etc, that are easily editable and available for immediate download.

Merger And Acquisition Buying Strategy For Business Growth International Footprint Expansion Brochure PDF
The slide displays information about the companys global footprint, including total revenue, headcount, total number of offices, and so on. Presenting Merger And Acquisition Buying Strategy For Business Growth International Footprint Expansion Brochure PDF to provide visual cues and insights. Share and navigate important information on three stages that need your due attention. This template can be used to pitch topics like Growth, Revenues, Headcount. In addtion, this PPT design contains high resolution images, graphics, etc, that are easily editable and available for immediate download.

Kpis To Measure International Growth Performance Ppt Infographics Graphic Tips PDF
This slide shows various KPIs which can be used to evaluate international growth performance. It includes revenue, e-commerce conversion rate, cost per acquisition, bounce rate, etc. Pitch your topic with ease and precision using this Kpis To Measure International Growth Performance Ppt Infographics Graphic Tips PDF. This layout presents information on Revenue, Cost Per Acquisition, Bounce Rate. It is also available for immediate download and adjustment. So, changes can be made in the color, design, graphics or any other component to create a unique layout.

Developing Significant Business Company Snapshot Highlighting Firm Updates Topics PDF
This slide provides information regarding firm overview highlighting details about geographical presence, annual revenues, website, major competitors, no. of employees, etc. Presenting Developing Significant Business Company Snapshot Highlighting Firm Updates Topics PD to provide visual cues and insights. Share and navigate important information on one stages that need your due attention. This template can be used to pitch topics like Geographical Presence, Annual Revenues, CEO. In addtion, this PPT design contains high resolution images, graphics, etc, that are easily editable and available for immediate download.
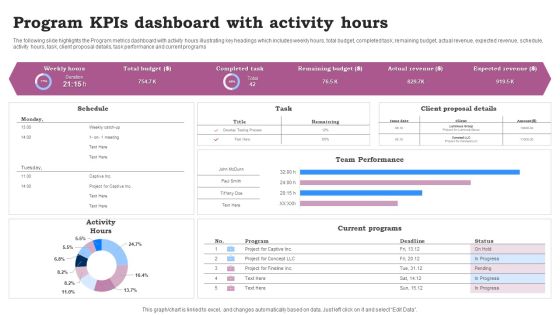
Program Kpis Dashboard With Activity Hours Ppt Infographics Clipart Images PDF
The following slide highlights the Program metrics dashboard with activity hours illustrating key headings which includes weekly hours, total budget, completed task, remaining budget, actual revenue, expected revenue, schedule, activity hours, task, client proposal details, task performance and current programs. Pitch your topic with ease and precision using this Program Kpis Dashboard With Activity Hours Ppt Infographics Clipart Images PDF. This layout presents information on Team Performance, Current Programs, Activity Hours. It is also available for immediate download and adjustment. So, changes can be made in the color, design, graphics or any other component to create a unique layout.
Product Sales Kpis With Website Traffic Ppt Icon Smartart
This slide showcase different strategies through which product is marketize to increase the product reach to the consumer and increase the market share. It includes total product revenue, sales comparison of online and in store sales, marketing campaigning and website traffic. Showcasing this set of slides titled Product Sales Kpis With Website Traffic Ppt Icon Smartart. The topics addressed in these templates are Website Traffic, Product Sales Increment, Total Product Revenue. All the content presented in this PPT design is completely editable. Download it and make adjustments in color, background, font etc. as per your unique business setting.

Sales Product Cycle Length Kpis Ppt Pictures Aids PDF
This slide shows the life cycle of a product and consumer acquisition in 2023. it comprises average revenue per unit, goal sales, consumer acquisition costs, and quarterly sales. Showcasing this set of slides titled Sales Product Cycle Length Kpis Ppt Pictures Aids PDF. The topics addressed in these templates are Product Value, Consumer Acquisition Cost, Average Revenue, Per Unit. All the content presented in this PPT design is completely editable. Download it and make adjustments in color, background, font etc. as per your unique business setting.

Sales Product Performance And Growth Kpis Ppt Layouts Mockup PDF
This slide displays a breakdown of sales results by particular product to monitor product demand and also to project product growth in the market. It includes units sold, annual income, and product revenue. Pitch your topic with ease and precision using this Sales Product Performance And Growth Kpis Ppt Layouts Mockup PDF. This layout presents information on Monthly Revenue, Product, Product Units. It is also available for immediate download and adjustment. So, changes can be made in the color, design, graphics or any other component to create a unique layout.

Consumer Journey Mapping Techniques Loyalty Program Performance Tracking Dashboard Portrait PDF
This slide covers the KPI dashboard for analyzing customer loyalty campaign results. It includes metrics such as revenue, liability, NQP accrued, transaction count, members, redemption ratio, etc. Pitch your topic with ease and precision using this Consumer Journey Mapping Techniques Loyalty Program Performance Tracking Dashboard Portrait PDF. This layout presents information on Transaction Count, Revenue, Redemption Ratio. It is also available for immediate download and adjustment. So, changes can be made in the color, design, graphics or any other component to create a unique layout.
 Home
Home