Financial Metrics

Key Ratios And Metrics To Measure Cash Flow Statement Ppt Gallery Graphics PDF
This slide showcases main KPIs to measure cash flow. The KPIs included are cash flow per share, cash flow yield, margin, invested capital and net debt to free cash flow. Persuade your audience using this Key Ratios And Metrics To Measure Cash Flow Statement Ppt Gallery Graphics PDF. This PPT design covers six stages, thus making it a great tool to use. It also caters to a variety of topics including Fundamental, Valuation, Efficiency, Profitability. Download this PPT design now to present a convincing pitch that not only emphasizes the topic but also showcases your presentation skills.
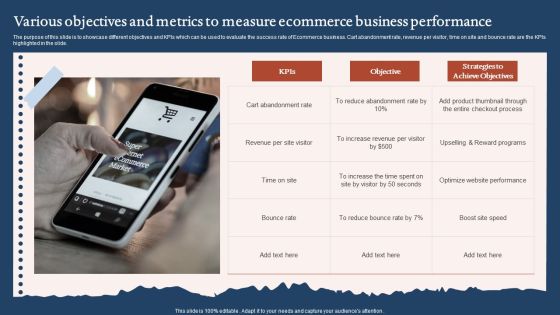
Various Objectives And Metrics To Measure Ecommerce Business Performance Summary PDF
The purpose of this slide is to showcase different objectives and KPIs which can be used to evaluate the success rate of Ecommerce business. Cart abandonment rate, revenue per visitor, time on site and bounce rate are the KPIs highlighted in the slide. Presenting Various Objectives And Metrics To Measure Ecommerce Business Performance Summary PDF to dispense important information. This template comprises three stages. It also presents valuable insights into the topics including Cart Abandonment Rate, Bounce Rate, Optimize Website Performance. This is a completely customizable PowerPoint theme that can be put to use immediately. So, download it and address the topic impactfully.

Metrics To Measure Business Performance Short Term Goals Ppt Portfolio Good PDF
This slide covers the short term goals set by the firm for FY20. Goals covered are to capture competitors market share, reduce churn rate, increase sales revenue and to invest in CSR activities. This is a Metrics To Measure Business Performance Short Term Goals Ppt Portfolio Good PDF template with various stages. Focus and dispense information on five stages using this creative set, that comes with editable features. It contains large content boxes to add your information on topics like Reduce Customer Churn, Growth, Invest, Sales Revenue. You can also showcase facts, figures, and other relevant content using this PPT layout. Grab it now.

KPI Metrics Dashboard To Measure Automation Performance In Customer Support Professional PDF
The following slide outlines a comprehensive KPI dashboard which can be used by the organization to measure the automation performance in customer support department. It covers kpis such as customer retention, costs per support, customer satisfaction, etc. Deliver and pitch your topic in the best possible manner with this KPI Metrics Dashboard To Measure Automation Performance In Customer Support Professional PDF. Use them to share invaluable insights on Customer Retention, Cost Per Support, Support Costs To Revenue and impress your audience. This template can be altered and modified as per your expectations. So, grab it now.

Account Payable Metrics To Quantify Performance Of Invoice Process Management Designs PDF
This slide showcases various KPIs to measure performance of invoice process in organization to increase its efficiency. It includes key components such as processing time, cost, exception rate, working capital, discount captured, etc. Presenting Account Payable Metrics To Quantify Performance Of Invoice Process Management Designs PDF to dispense important information. This template comprises six stages. It also presents valuable insights into the topics including Invoice Processing Time, Cost to Process, Exception Rate, Working Capital. This is a completely customizable PowerPoint theme that can be put to use immediately. So, download it and address the topic impactfully.

Cash Flow Metrics To Measure Firm Operations Effectiveness Ppt Outline Infographic Template PDF
This slide showcases yearly cash conversion cycle to determine companys working capital management. It includes DSO, DIO, DPO and CCC that measure the average number of days organization takes to collect payment and pay bills. Pitch your topic with ease and precision using this Cash Flow Metrics To Measure Firm Operations Effectiveness Ppt Outline Infographic Template PDF. This layout presents information on Cash Conversion Cycle, 2019 To 2022, Cash Flow. It is also available for immediate download and adjustment. So, changes can be made in the color, design, graphics or any other component to create a unique layout.
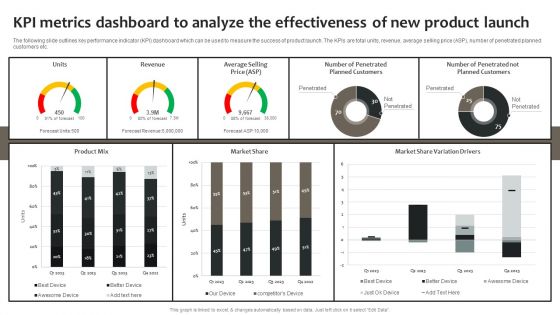
Effective Online And Offline Promotional Kpi Metrics Dashboard To Analyze The Effectiveness Of New Portrait PDF
The following slide outlines key performance indicator KPI dashboard which can be used to measure the success of product launch. The KPIs are total units, revenue, average selling price ASP, number of penetrated planned customers etc. From laying roadmaps to briefing everything in detail, our templates are perfect for you. You can set the stage with your presentation slides. All you have to do is download these easy-to-edit and customizable templates. Effective Online And Offline Promotional Kpi Metrics Dashboard To Analyze The Effectiveness Of New Portrait PDF will help you deliver an outstanding performance that everyone would remember and praise you for. Do download this presentation today.

Metrics That Communicate The Efficiency And Effectiveness Of Business Impacting Services Ppt Ideas Grid PDF
This template covers the set of KPIs that most effectively represent the efficiency and effectiveness business contribution of the documented business impacting services, apps, or projects. Presenting metrics that communicate the efficiency and effectiveness of business impacting services ppt ideas grid pdf to provide visual cues and insights. Share and navigate important information on four stages that need your due attention. This template can be used to pitch topics like service level, application, revenue, cost efficiency, risk. In addtion, this PPT design contains high resolution images, graphics, etc, that are easily editable and available for immediate download.

Performance Metrics To Analyze The Impact Of Event Marketing Structure PDF
This slide showcases the key indicators used to track the impact of event advertising. Major KPIs covered are cost per lead, post-event conversions, total registrations, gross revenue and audience engagement. The best PPT templates are a great way to save time, energy, and resources. Slidegeeks have 100 percent editable powerpoint slides making them incredibly versatile. With these quality presentation templates, you can create a captivating and memorable presentation by combining visually appealing slides and effectively communicating your message. Download Performance Metrics To Analyze The Impact Of Event Marketing Structure PDF from Slidegeeks and deliver a wonderful presentation.

Marketing Success Metrics Analyzing Average Time On Page To Improve Landing Page Sample PDF
This slide covers an overview of the average time on the page to identify the amount of time a visitor spends on the landing page. It also includes strategies to improve, such as decreasing load time, improving post readability, and using exit intent popups. Make sure to capture your audiences attention in your business displays with our gratis customizable Marketing Success Metrics Analyzing Average Time On Page To Improve Landing Page Sample PDF. These are great for business strategies, office conferences, capital raising or task suggestions. If you desire to acquire more customers for your tech business and ensure they stay satisfied, create your own sales presentation with these plain slides.
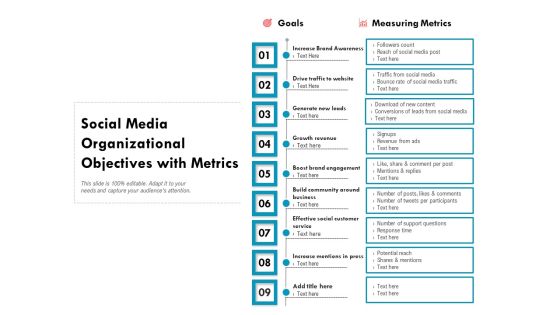
Social Media Organizational Objectives With Metrics Ppt PowerPoint Presentation Inspiration Example Introduction PDF
Persuade your audience using this social media organizational objectives with metrics ppt powerpoint presentation inspiration example introduction pdf. This PPT design covers nine stages, thus making it a great tool to use. It also caters to a variety of topics including increase brand awareness, drive traffic to website, generate new leads, growth revenue, boost brand engagement, build community around business, effective social customer service, increase mentions in press. Download this PPT design now to present a convincing pitch that not only emphasizes the topic but also showcases your presentation skills.
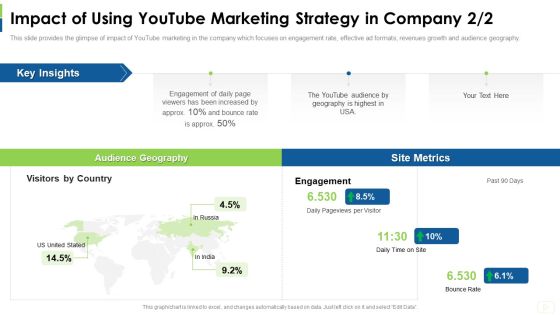
Social Platform As Profession Impact Of Using Youtube Marketing Strategy In Company Metrics Template PDF
This slide provides the glimpse of impact of YouTube marketing in the company which focuses on engagement rate, effective ad formats, revenues growth and audience geography. This is a social platform as profession impact of using youtube marketing strategy in company metrics template pdf template with various stages. Focus and dispense information on three stages using this creative set, that comes with editable features. It contains large content boxes to add your information on topics like impact of using youtube marketing strategy in company. You can also showcase facts, figures, and other relevant content using this PPT layout. Grab it now.

Social Media Goals And Business Goals With Key Metrics Structure PDF
This slide showcases companys media objectives to increase revenue and sales. It further includes goals such as awareness, engagement, conversions and consumers. Persuade your audience using this social media goals and business goals with key metrics structure pdf. This PPT design covers three stages, thus making it a great tool to use. It also caters to a variety of topics including brand growth, customers, sales. Download this PPT design now to present a convincing pitch that not only emphasizes the topic but also showcases your presentation skills.

Project Drivers Kpi Dashboard With Digital Marketing Metrics Ppt PowerPoint Presentation File Clipart PDF
This slide outlines the digital marketing project drivers dashboard which includes components such as growth, No. orders, revenue and EBITDA margin. It also provides information about the website traffic, conversion rate and new customers which can assist managers to track digital marketing performance. Showcasing this set of slides titled Project Drivers Kpi Dashboard With Digital Marketing Metrics Ppt PowerPoint Presentation File Clipart PDF. The topics addressed in these templates are Website Traffic, Conversion Rate, New Customers. All the content presented in this PPT design is completely editable. Download it and make adjustments in color, background, font etc. as per your unique business setting.
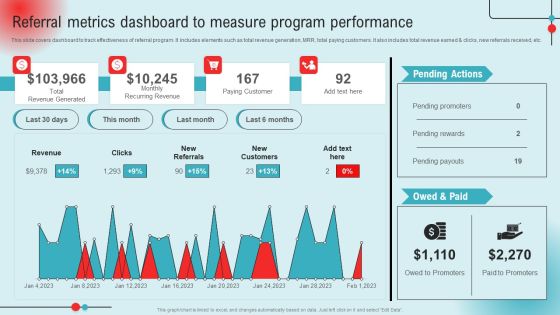
Referral Metrics Dashboard To Measure Program Performance Ppt PowerPoint Presentation Diagram Lists PDF
This slide covers dashboard to track effectiveness of referral program. It includes elements such as total revenue generation, MRR, total paying customers. It also includes total revenue earned and clicks, new referrals received, etc. This Referral Metrics Dashboard To Measure Program Performance Ppt PowerPoint Presentation Diagram Lists PDF from Slidegeeks makes it easy to present information on your topic with precision. It provides customization options, so you can make changes to the colors, design, graphics, or any other component to create a unique layout. It is also available for immediate download, so you can begin using it right away. Slidegeeks has done good research to ensure that you have everything you need to make your presentation stand out. Make a name out there for a brilliant performance.

Comprehensive Guide To Build Marketing Success Metrics To Measure Influencer Marketing Sample PDF
The following slide showcases different key performance indicators KPIs through which digital marketers can evaluate influencer marketing campaign performance. The key performance indicators outlined in slide are audience reach, impressions, followers growth, click-through rate CTR, revenue, and conversion rate. This modern and well-arranged Comprehensive Guide To Build Marketing Success Metrics To Measure Influencer Marketing Sample PDF provides lots of creative possibilities. It is very simple to customize and edit with the Powerpoint Software. Just drag and drop your pictures into the shapes. All facets of this template can be edited with Powerpoint, no extra software is necessary. Add your own material, put your images in the places assigned for them, adjust the colors, and then you can show your slides to the world, with an animated slide included.

Comprehensive Guide For Launch Performance Metrics To Analyze The Impact Of Event Diagrams PDF
This slide showcases the key indicators used to track the impact of event advertising. Major KPIs covered are cost per lead, post-event conversions, total registrations, gross revenue and audience engagement. Welcome to our selection of the Comprehensive Guide For Launch Performance Metrics To Analyze The Impact Of Event Diagrams PDF. These are designed to help you showcase your creativity and bring your sphere to life. Planning and Innovation are essential for any business that is just starting out. This collection contains the designs that you need for your everyday presentations. All of our PowerPoints are 100 percent editable, so you can customize them to suit your needs. This multi-purpose template can be used in various situations. Grab these presentation templates today.
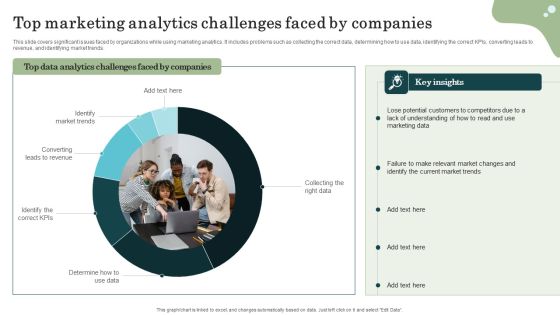
Marketing Success Metrics Top Marketing Analytics Challenges Faced By Inspiration PDF
This slide covers significant issues faced by organizations while using marketing analytics. It includes problems such as collecting the correct data, determining how to use data, identifying the correct KPIs, converting leads to revenue, and identifying market trends. Boost your pitch with our creative Marketing Success Metrics Top Marketing Analytics Challenges Faced By Inspiration PDF. Deliver an awe-inspiring pitch that will mesmerize everyone. Using these presentation templates you will surely catch everyones attention. You can browse the ppts collection on our website. We have researchers who are experts at creating the right content for the templates. So you dont have to invest time in any additional work. Just grab the template now and use them.
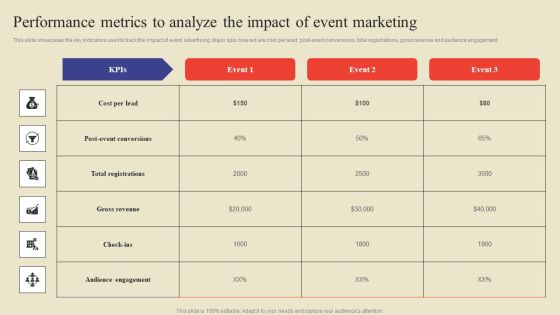
Performance Metrics To Analyze The Impact Of Event Marketing Ppt Professional Structure PDF
This slide showcases the key indicators used to track the impact of event advertising. Major kpis covered are cost per lead, post-event conversions, total registrations, gross revenue and audience engagement. This Performance Metrics To Analyze The Impact Of Event Marketing Ppt Professional Structure PDF from Slidegeeks makes it easy to present information on your topic with precision. It provides customization options, so you can make changes to the colors, design, graphics, or any other component to create a unique layout. It is also available for immediate download, so you can begin using it right away. Slidegeeks has done good research to ensure that you have everything you need to make your presentation stand out. Make a name out there for a brilliant performance.
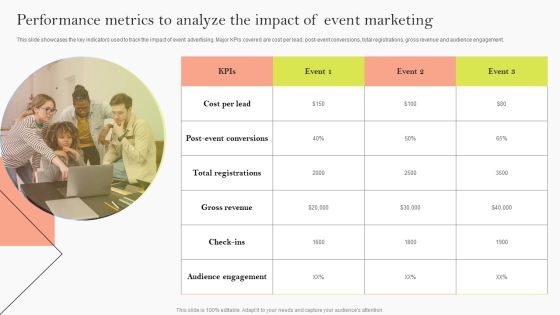
Performance Metrics To Analyze The Impact Of Event Marketing Ppt Model Good PDF
This slide showcases the key indicators used to track the impact of event advertising. Major KPIs covered are cost per lead, post-event conversions, total registrations, gross revenue and audience engagement. This modern and well arranged Performance Metrics To Analyze The Impact Of Event Marketing Ppt Model Good PDF provides lots of creative possibilities. It is very simple to customize and edit with the Powerpoint Software. Just drag and drop your pictures into the shapes. All facets of this template can be edited with Powerpoint no extra software is necessary. Add your own material, put your images in the places assigned for them, adjust the colors, and then you can show your slides to the world, with an animated slide included.
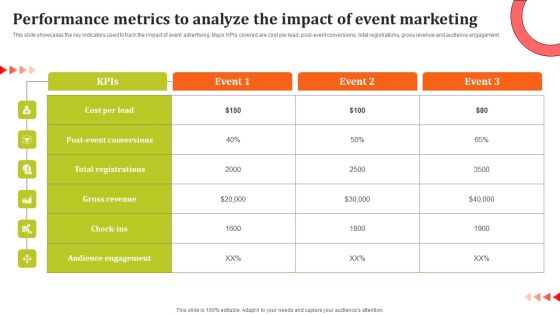
Performance Metrics To Analyze The Impact Of Event Marketing Ppt Model Layouts PDF
This slide showcases the key indicators used to track the impact of event advertising. Major KPIs covered are cost per lead, post-event conversions, total registrations, gross revenue and audience engagement. This modern and well arranged Performance Metrics To Analyze The Impact Of Event Marketing Ppt Model Layouts PDF provides lots of creative possibilities. It is very simple to customize and edit with the Powerpoint Software. Just drag and drop your pictures into the shapes. All facets of this template can be edited with Powerpoint no extra software is necessary. Add your own material, put your images in the places assigned for them, adjust the colors, and then you can show your slides to the world, with an animated slide included.
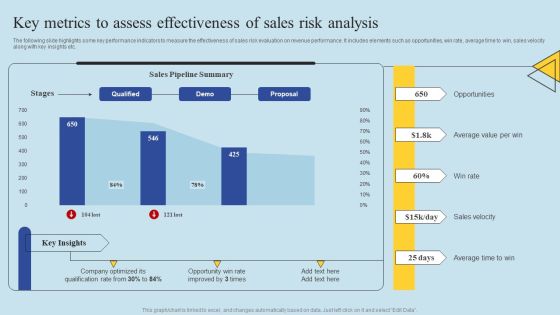
Determining Risks In Sales Administration Procedure Key Metrics To Assess Effectiveness Of Sales Pictures PDF
The following slide highlights some key performance indicators to measure the effectiveness of sales risk evaluation on revenue performance. It includes elements such as opportunities, win rate, average time to win, sales velocity along with key insights etc. This Determining Risks In Sales Administration Procedure Key Metrics To Assess Effectiveness Of Sales Pictures PDF from Slidegeeks makes it easy to present information on your topic with precision. It provides customization options, so you can make changes to the colors, design, graphics, or any other component to create a unique layout. It is also available for immediate download, so you can begin using it right away. Slidegeeks has done good research to ensure that you have everything you need to make your presentation stand out. Make a name out there for a brilliant performance.

Key Metrics To Assess Effectiveness Of Sales Risk Analysis Ppt Outline Design Ideas PDF
The following slide highlights some key performance indicators to measure the effectiveness of sales risk evaluation on revenue performance. It includes elements such as opportunities, win rate, average time to win, sales velocity along with key insights etc. Retrieve professionally designed Key Metrics To Assess Effectiveness Of Sales Risk Analysis Ppt Outline Design Ideas PDF to effectively convey your message and captivate your listeners. Save time by selecting pre made slideshows that are appropriate for various topics, from business to educational purposes. These themes come in many different styles, from creative to corporate, and all of them are easily adjustable and can be edited quickly. Access them as PowerPoint templates or as Google Slides themes. You do not have to go on a hunt for the perfect presentation because Slidegeeks got you covered from everywhere.
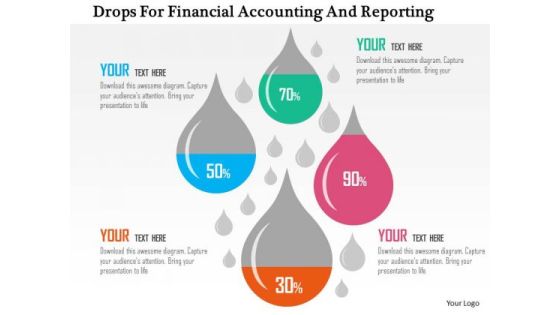
Business Diagram Drops For Financial Accounting And Reporting Presentation Template
This business diagram has been designed with drops displaying financial ratios. Download this diagram to depict financial and accounting ratios. Use this slide to build quality presentations for your viewers.
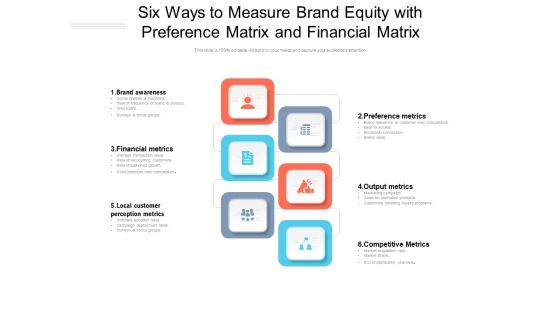
Six Ways To Measure Brand Equity With Preference Matrix And Financial Matrix Ppt PowerPoint Presentation Outline Mockup PDF
Presenting this set of slides with name six ways to measure brand equity with preference matrix and financial matrix ppt powerpoint presentation outline mockup pdf. This is a six stage process. The stages in this process are brand awareness, financial metrics, local customer perception metrics, preference metrics, output metrics, competitive metrics. This is a completely editable PowerPoint presentation and is available for immediate download. Download now and impress your audience.

Financial Initiatives Plan For Healthcare Organisations Summary PDF
This slide presents financial action plan for healthcare organisations, helpful in determining business requirements and sources of funds. It includes adopting modern budget process, defining goals, identifying requirements and selecting metrics. Presenting Financial Initiatives Plan For Healthcare Organisations Summary PDF to dispense important information. This template comprises five stages. It also presents valuable insights into the topics including Adopt Modern Budgeting Process, Define Organisational Goals, Identify Requirements. This is a completely customizable PowerPoint theme that can be put to use immediately. So, download it and address the topic impactfully.

Infographic For Financial Statement Analysis PowerPoint Templates
This PowerPoint template contains infographic slide. This diagram has been designed with circular infographic to exhibit financial statement analysis. Use this diagram to set targets and to measure performance in your presentations.

Financial Performance Executive Summary Report Template PDF
The following slide presents the overview of current financial performance with future goals for firm decision making. It includes KPIs such as revenue, cost, net profit, operating expenses, cash flows etc. Presenting Financial Performance Executive Summary Report Template PDF to dispense important information. This template comprises one stages. It also presents valuable insights into the topics including Operating Expenditure, Revenue, Key Metrics. This is a completely customizable PowerPoint theme that can be put to use immediately. So, download it and address the topic impactfully.

Product Social Sustainability Scorecard Financial Graphics PDF
Presenting product social sustainability scorecard financial graphics pdf to provide visual cues and insights. Share and navigate important information on four stages that need your due attention. This template can be used to pitch topics like minimum, medium, maximum. In addtion, this PPT design contains high resolution images, graphics, etc, that are easily editable and available for immediate download.

Comparative Matrix Of Actual And Projected Financial Performance Brochure PDF
This slide shows matrix which can be used to compare actual and expected financial performance of an organization. It covers metrics such as gross profit margin, net profit margin, working capital, etc. Pitch your topic with ease and precision using this Comparative Matrix Of Actual And Projected Financial Performance Brochure PDF. This layout presents information on Comparative Matrix Actual, Projected Financial Performance. It is also available for immediate download and adjustment. So, changes can be made in the color, design, graphics or any other component to create a unique layout.
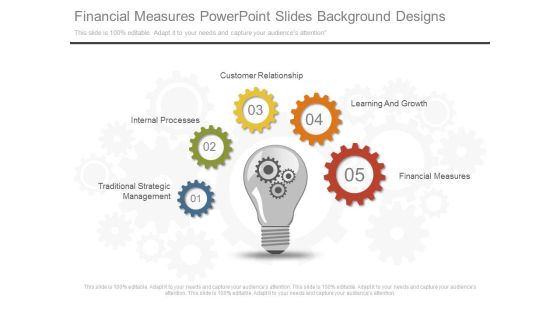
Financial Measures Powerpoint Slides Background Designs
This is a financial measures powerpoint slides background designs. This is a five stage process. The stages in this process are traditional strategic management, internal processes, customer relationship, learning and growth, financial measures.
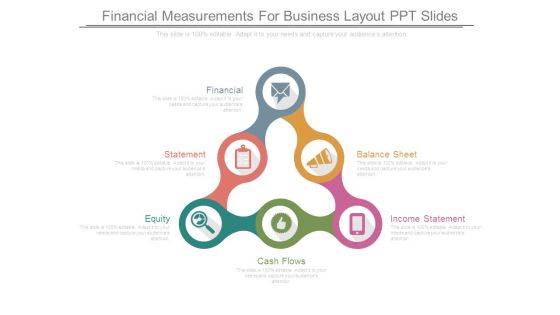
Financial Measurements For Business Layout Ppt Slides
This is a financial measurements for business layout ppt slides. This is a six stage process. The stages in this process are financial, statement, equity, cash flows, balance sheet, income statement.
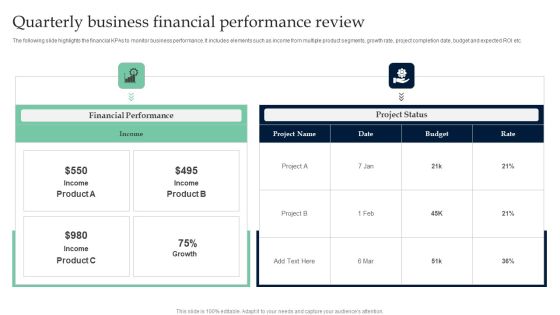
Quarterly Business Financial Performance Review Sample PDF
The following slide highlights the financial KPAs to monitor business performance. It includes elements such as income from multiple product segments, growth rate, project completion date, budget and expected ROI etc. Showcasing this set of slides titled Quarterly Business Financial Performance Review Sample PDF. The topics addressed in these templates are Quarterly Business, Financial Performance Review. All the content presented in this PPT design is completely editable. Download it and make adjustments in color, background, font etc. as per your unique business setting.
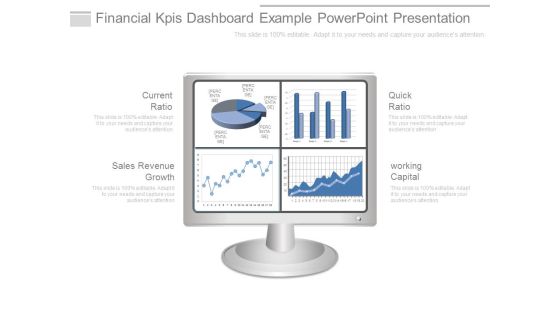
Financial Kpis Dashboard Example Powerpoint Presentation
This is a financial kpis dashboard example powerpoint presentation. This is a four stage process. The stages in this process are current ratio, sales revenue growth, quick ratio, working capital.
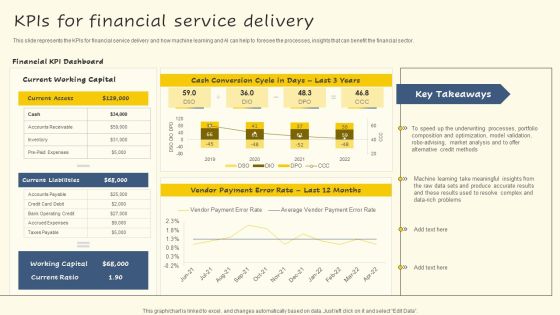
Kpis For Financial Service Delivery Background PDF
This slide represents the KPIs for financial service delivery and how machine learning and AI can help to foresee the processes, insights that can benefit the financial sector. If you are looking for a format to display your unique thoughts, then the professionally designed Kpis For Financial Service Delivery Background PDF is the one for you. You can use it as a Google Slides template or a PowerPoint template. Incorporate impressive visuals, symbols, images, and other charts. Modify or reorganize the text boxes as you desire. Experiment with shade schemes and font pairings. Alter, share or cooperate with other people on your work. Download Kpis For Financial Service Delivery Background PDF and find out how to give a successful presentation. Present a perfect display to your team and make your presentation unforgettable.

2020 Financial Snapshot One Pager Documents
This slide shows the business highlights illustrating key financial measures including revenues, EBITA margin etc. which are earned from ongoing business in a fiscal year. Presenting you a fantastic 2020 Financial Snapshot One Pager Documents. This piece is crafted on hours of research and professional design efforts to ensure you have the best resource. It is completely editable and its design allow you to rehash its elements to suit your needs. Get this 2020 Financial Snapshot One Pager Documents A4 One-pager now.

2022 Financial Snapshot One Pager Documents
This slide shows the business highlights illustrating key financial measures including revenues, EBITA margin etc. which are earned from ongoing business in a fiscal year.Presenting you a fantastic 2022 Financial Snapshot One Pager Documents. This piece is crafted on hours of research and professional design efforts to ensure you have the best resource. It is completely editable and its design allow you to rehash its elements to suit your needs. Get this 2022 Financial Snapshot One Pager Documents A4 One-pager now.

Financial And Business Growth Objectives Ppt Slides
This is a financial and business growth objectives ppt slides. This is a five stage process. The stages in this process are specific, measurable, achievable, realistic, time, smart.

Financial Measures Ppt PowerPoint Presentation Model Infographics
This is a financial measures ppt powerpoint presentation model infographics. This is a seven stage process. The stages in this process are cost of raw material, revenue from goods sold, inventory holding cost, transportation cost, cost of expired perishable goods.
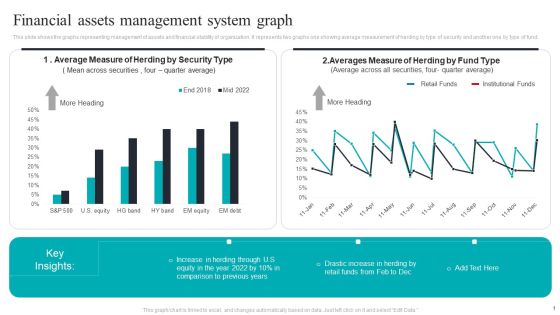
Financial Assets Management System Graph Structure PDF
This slide shows the graphs representing management of assets and financial stability of organization. It represents two graphs one showing average measurement of herding by type of security and another one by type of fund. Pitch your topic with ease and precision using this Financial Assets Management System Graph Structure PDF. This layout presents information on Financial Assets, Management System Graph. It is also available for immediate download and adjustment. So, changes can be made in the color, design, graphics or any other component to create a unique layout.

Quarterly Financial Performance Evaluation Report Template PDF
This slide showcase quarterly financial performance measurement and analysis summary charts. It highlights the revenue chart, gross profit chart, profit before tax chart, and net profit chart. Showcasing this set of slides titled Quarterly Financial Performance Evaluation Report Template PDF. The topics addressed in these templates are Revenue, Gross Profit, Profit Before Tax . All the content presented in this PPT design is completely editable. Download it and make adjustments in color, background, font etc. as per your unique business setting.
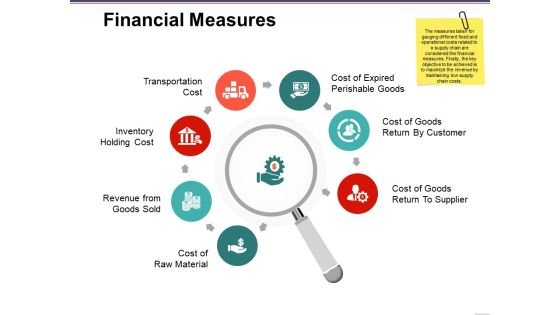
Financial Measures Ppt PowerPoint Presentation Show Ideas
This is a financial measures ppt powerpoint presentation show ideas. This is a seven stage process. The stages in this process are cost of raw material, revenue from goods sold, inventory holding cost, transportation cost, cost of goods return by customer.

Other Operational And Financial Kpis Inspiration PDF
The slide provides five years graphs of major KPIs key performance indicators, which might help the company to track its performance. Covered KPIs include revenue, total passengers, operating income, customer satisfaction rate etc.Deliver an awe-inspiring pitch with this creative other operational and financial KPIs inspiration pdf. bundle. Topics like total passengers, operating income, revenue, 2017 to 2021 can be discussed with this completely editable template. It is available for immediate download depending on the needs and requirements of the user.

Other Operational And Financial Kpis Information PDF
The slide provides five years graphs of major KPIs key performance indicators, which might help the company to track its performance. Covered KPIs include revenue, total passengers, operating income, customer satisfaction rate etc. Deliver an awe inspiring pitch with this creative other operational and financial kpis information pdf bundle. Topics like revenue, operating income, customer satisfaction can be discussed with this completely editable template. It is available for immediate download depending on the needs and requirements of the user.
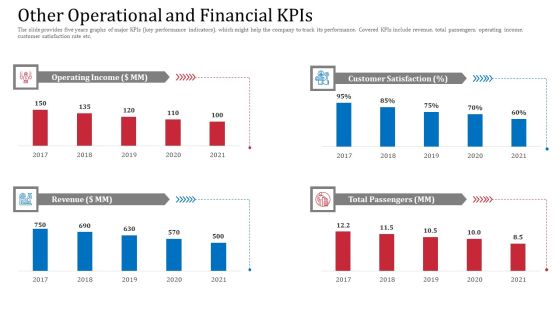
Other Operational And Financial Kpis Demonstration PDF
The slide provides five years graphs of major KPIs key performance indicators, which might help the company to track its performance. Covered KPIs include revenue, total passengers, operating income, customer satisfaction rate etc.Deliver and pitch your topic in the best possible manner with this other operational and financial kpis demonstration pdf. Use them to share invaluable insights on customer satisfaction, operating income, total passengers and impress your audience. This template can be altered and modified as per your expectations. So, grab it now.
Logistics Management Framework Financial Measures Icons PDF
Presenting logistics management framework financial measures icons pdf to provide visual cues and insights. Share and navigate important information on seven stages that need your due attention. This template can be used to pitch topics like cost of goods return to supplier, cost of raw material, revenue from goods sold, inventory holding cost. In addtion, this PPT design contains high resolution images, graphics, etc, that are easily editable and available for immediate download.
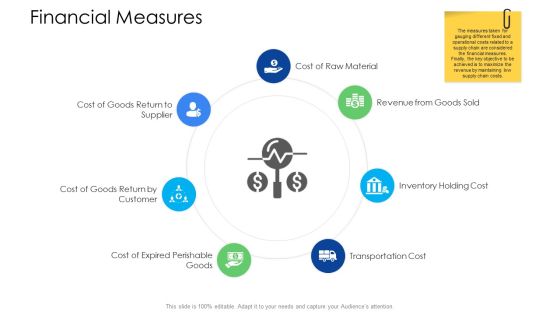
Logistics Management Services Financial Measures Infographics PDF
Presenting logistics management services financial measures infographics pdf to provide visual cues and insights. Share and navigate important information on seven stages that need your due attention. This template can be used to pitch topics like revenue from goods sold, inventory holding cost, transportation cost, cost of raw material. In addtion, this PPT design contains high resolution images, graphics, etc, that are easily editable and available for immediate download.
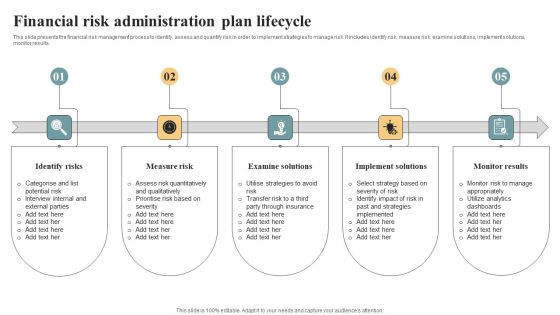
Financial Risk Administration Plan Lifecycle Background PDF
This slide presents the financial risk management process to identify, assess and quantify risk in order to implement strategies to manage risk. It includes identify risk, measure risk, examine solutions, implement solutions, monitor results. Presenting Financial Risk Administration Plan Lifecycle Background PDF to dispense important information. This template comprises five stages. It also presents valuable insights into the topics including Identify Risks, Measure Risk, Examine Solutions . This is a completely customizable PowerPoint theme that can be put to use immediately. So, download it and address the topic impactfully.
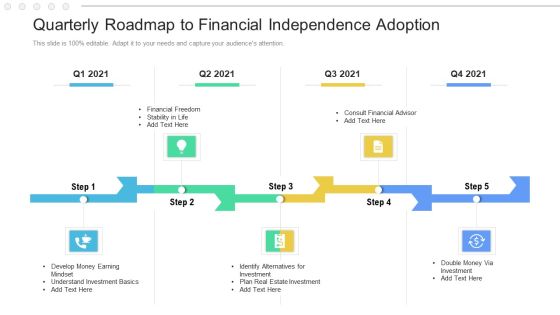
Quarterly Roadmap To Financial Independence Adoption Formats
Introducing our quarterly roadmap to financial independence adoption formats. This PPT presentation is Google Slides compatible, therefore, you can share it easily with the collaborators for measuring the progress. Also, the presentation is available in both standard screen and widescreen aspect ratios. So edit the template design by modifying the font size, font type, color, and shapes as per your requirements. As this PPT design is fully editable it can be presented in PDF, JPG and PNG formats.

Analyzing Impact Of New Financial Strategic Planning Effective Planning For Monetary Elements PDF
This slide showcases the impact assessment of new financial strategy plan on key financial metrics involved. It includes parameters such as revenues, total revenue, revenue growth, expenses, margin EBITDA, etc.Explore a selection of the finest Analyzing Impact Of New Financial Strategic Planning Effective Planning For Monetary Elements PDF here. With a plethora of professionally designed and pre-made slide templates, you can quickly and easily find the right one for your upcoming presentation. You can use our Analyzing Impact Of New Financial Strategic Planning Effective Planning For Monetary Elements PDF to effectively convey your message to a wider audience. Slidegeeks has done a lot of research before preparing these presentation templates. The content can be personalized and the slides are highly editable. Grab templates today from Slidegeeks.
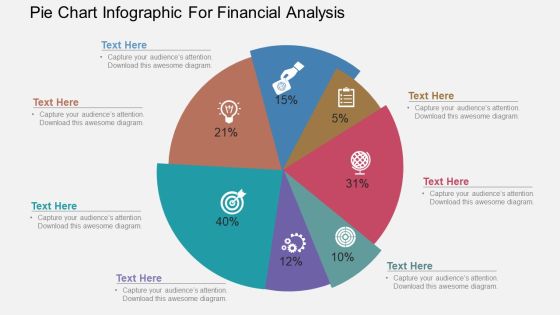
Pie Chart Infographic For Financial Analysis Powerpoint Template
Our above PowerPoint template has been designed with pie chart infographic. This slide is suitable to present financial analysis. Use this business diagram to present your work in a more smart and precise manner.

Performance KPI Dashboard To Measure Financial Position Of Organization Pictures PDF
The following slide outlines a comprehensive key performance indicator KPI dashboard highlighting different financial metrics. The KPIs are quick and current ratio, cash balance, days sales outstanding etc. Slidegeeks is here to make your presentations a breeze with Performance KPI Dashboard To Measure Financial Position Of Organization Pictures PDF With our easy to use and customizable templates, you can focus on delivering your ideas rather than worrying about formatting. With a variety of designs to choose from, you are sure to find one that suits your needs. And with animations and unique photos, illustrations, and fonts, you can make your presentation pop. So whether you are giving a sales pitch or presenting to the board, make sure to check out Slidegeeks first.
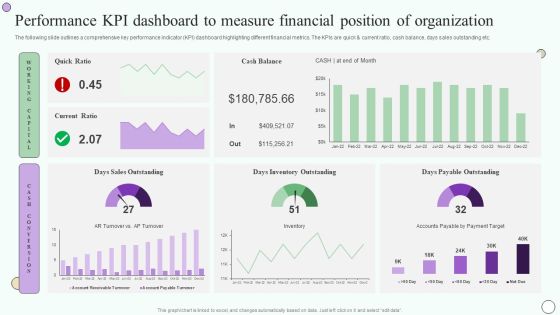
Estimating Business Overall Performance Kpi Dashboard To Measure Financial Position Inspiration PDF
The following slide outlines a comprehensive key performance indicator KPI dashboard highlighting different financial metrics. The KPIs are quick and current ratio, cash balance, days sales outstanding etc. Welcome to our selection of the Estimating Business Overall Performance Kpi Dashboard To Measure Financial Position Inspiration PDF. These are designed to help you showcase your creativity and bring your sphere to life. Planning and Innovation are essential for any business that is just starting out. This collection contains the designs that you need for your everyday presentations. All of our PowerPoints are 100 percent editable, so you can customize them to suit your needs. This multi-purpose template can be used in various situations. Grab these presentation templates today.

Overview Of Organizational Performance Kpi Dashboard To Measure Financial Position Sample PDF
The following slide outlines a comprehensive key performance indicator KPI dashboard highlighting different financial metrics. The KPIs are quick and current ratio, cash balance, days sales outstanding etc. Welcome to our selection of the Overview Of Organizational Performance Kpi Dashboard To Measure Financial Position Sample PDF. These are designed to help you showcase your creativity and bring your sphere to life. Planning and Innovation are essential for any business that is just starting out. This collection contains the designs that you need for your everyday presentations. All of our PowerPoints are 100 percent editable, so you can customize them to suit your needs. This multi-purpose template can be used in various situations. Grab these presentation templates today.

Financial Highlights Of SW Care Company Professional PDF
This slide shows the Financial Highlights of SW Care Company such as net trade sales, gross profit, net income, sales and marketing investment, share metrics, value creation metrics, market growth etc. along with decision point summary details. Deliver an awe inspiring pitch with this creative financial highlights of sw care company professional pdf bundle. Topics like shares metrics, value creation metrics, decision point summary, market assumptions, financials can be discussed with this completely editable template. It is available for immediate download depending on the needs and requirements of the user.

Monetary Planning And Evaluation Guide Performance KPI Dashboard To Measure Financial Position Of Organization Ppt File Slides PDF
The following slide outlines a comprehensive key performance indicator KPI dashboard highlighting different financial metrics. The KPIs are quick and current ratio, cash balance, days sales outstanding etc. The best PPT templates are a great way to save time, energy, and resources. Slidegeeks have 100 percent editable powerpoint slides making them incredibly versatile. With these quality presentation templates, you can create a captivating and memorable presentation by combining visually appealing slides and effectively communicating your message. Download Monetary Planning And Evaluation Guide Performance KPI Dashboard To Measure Financial Position Of Organization Ppt File Slides PDF from Slidegeeks and deliver a wonderful presentation.

Company Financials Report Icon Illustrating Product Financial Performance Infographics PDF
Persuade your audience using this Company Financials Report Icon Illustrating Product Financial Performance Infographics PDF. This PPT design covers one stage, thus making it a great tool to use. It also caters to a variety of topics including Company Financials, Report Icon, Illustrating Product. Download this PPT design now to present a convincing pitch that not only emphasizes the topic but also showcases your presentation skills.

Capital Fundraising And Financial Forecast Pitch Deck Key Financial Projections For Upcoming Years Portrait PDF
This slide illustrates key performance indicators highlighting the financial projections for upcoming years. KPIs covered here are revenue breakdown, profitability and cash flow. Deliver an awe inspiring pitch with this creative capital fundraising and financial forecast pitch deck key financial projections for upcoming years portrait pdf bundle. Topics like key financial projections for upcoming years can be discussed with this completely editable template. It is available for immediate download depending on the needs and requirements of the user.
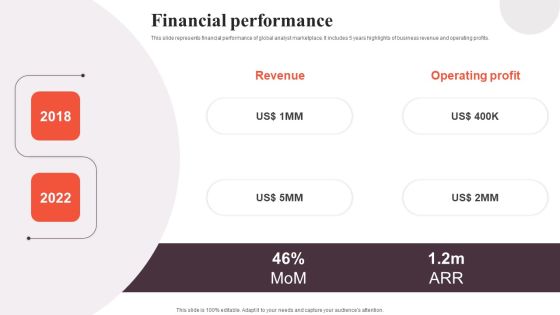
Financial Analytics Solution Investor Funding Elevator Pitch Deck Financial Performance Formats PDF
This slide represents financial performance of global analyst marketplace. It includes 5 years highlights of business revenue and operating profits. This Financial Analytics Solution Investor Funding Elevator Pitch Deck Financial Performance Formats PDF is perfect for any presentation, be it in front of clients or colleagues. It is a versatile and stylish solution for organizing your meetings. The Financial Analytics Solution Investor Funding Elevator Pitch Deck Financial Performance Formats PDF features a modern design for your presentation meetings. The adjustable and customizable slides provide unlimited possibilities for acing up your presentation. Slidegeeks has done all the homework before launching the product for you. So, do not wait, grab the presentation templates today

Adjusting Financial Strategies And Planning KPI Dashboard To Analyze Financial Improvements Inspiration PDF
This slide showcases the KPIs that would help our business organization to evaluate improvements with the new financial strategy implementation. It includes total income, total expenses, accounts receivable, etc. The best PPT templates are a great way to save time, energy, and resources. Slidegeeks have 100 percent editable powerpoint slides making them incredibly versatile. With these quality presentation templates, you can create a captivating and memorable presentation by combining visually appealing slides and effectively communicating your message. Download Adjusting Financial Strategies And Planning KPI Dashboard To Analyze Financial Improvements Inspiration PDF from Slidegeeks and deliver a wonderful presentation.
 Home
Home