Financial Metrics
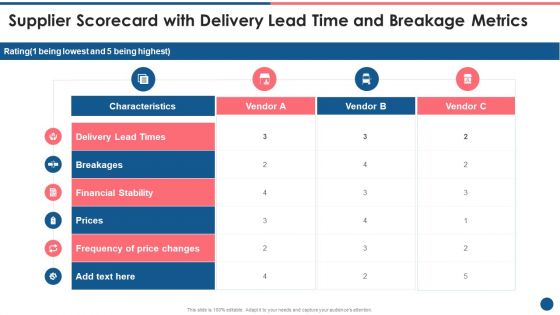
Supplier Scorecard Supplier Scorecard With Delivery Lead Time And Breakage Metrics Background PDF
Deliver an awe inspiring pitch with this creative supplier scorecard supplier scorecard with delivery lead time and breakage metrics background pdf bundle. Topics like delivery lead times, financial stability, prices, frequency price changes can be discussed with this completely editable template. It is available for immediate download depending on the needs and requirements of the user.
KPIs And Metrics To Measure Pharmaceutical Drug Of Pharmaceutical Company Icons PDF
Mentioned slide showcases various key performance indicators KPIs which can be used to measure the development of pharmaceutical companies in different years. The key metrics are productivity, competency, quality of care and financial. Showcasing this set of slides titled KPIs And Metrics To Measure Pharmaceutical Drug Of Pharmaceutical Company Icons PDF. The topics addressed in these templates are Productivity, Competency, Quality Of Care. All the content presented in this PPT design is completely editable. Download it and make adjustments in color, background, font etc. as per your unique business setting.
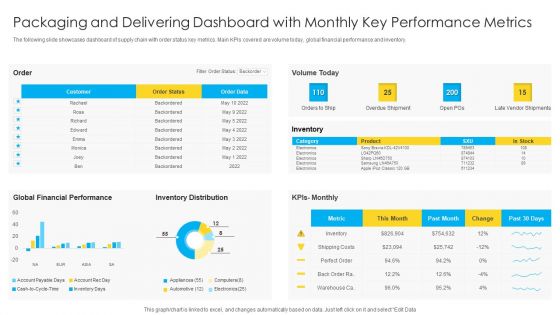
Packaging And Delivering Dashboard With Monthly Key Performance Metrics Microsoft PDF
The following slide showcases dashboard of supply chain with order status key metrics. Main KPIs covered are volume today, global financial performance and inventory. Pitch your topic with ease and precision using this Packaging And Delivering Dashboard With Monthly Key Performance Metrics Microsoft PDF. This layout presents information on Customer, Global Financial Performance, Inventory Distribution. It is also available for immediate download and adjustment. So, changes can be made in the color, design, graphics or any other component to create a unique layout.

Examine Positive Impact On Warehouse Financial Performance Pictures PDF
This slide analyzes the performance of warehouse financial metrics after the successful optimization of multiple dimensions of warehouse. It includes information about labor costs, inventory carrying costs, and order fulfillment rates. Slidegeeks is one of the best resources for PowerPoint templates. You can download easily and regulate Examine Positive Impact On Warehouse Financial Performance Pictures PDF for your personal presentations from our wonderful collection. A few clicks is all it takes to discover and get the most relevant and appropriate templates. Use our Templates to add a unique zing and appeal to your presentation and meetings. All the slides are easy to edit and you can use them even for advertisement purposes.
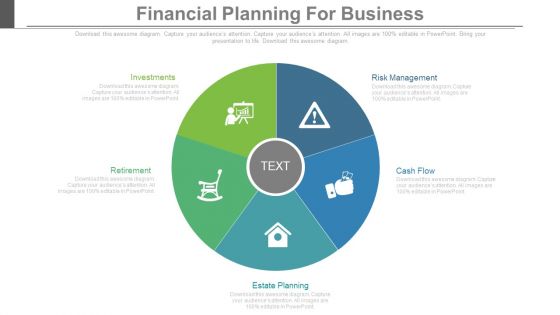
Financial Planning For Business Ppt Slides
This is a financial planning for business ppt slides. This is a five stage process. The stages in this process are business, success, marketing.
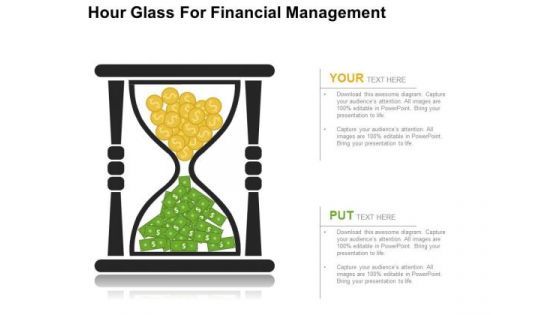
Hour Glass For Financial Management PowerPoint Templates
Create dynamic presentations with this professional slide containing a graphic of hour glass with dollar currency notes and coins. This template is designed to portray the concepts of financial management. Add this slide in your presentations to visually support your content
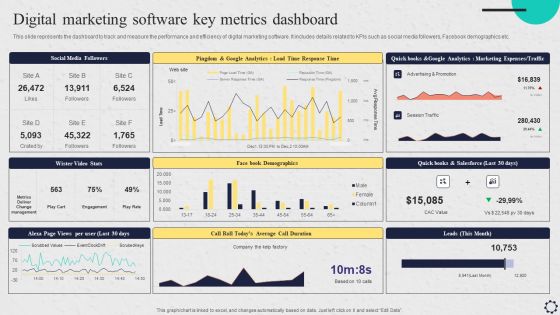
Software Implementation Strategy Digital Marketing Software Key Metrics Dashboard Template PDF
This slide represents the dashboard to track and measure the performance and efficiency of digital marketing software. It includes details related to KPIs such as social media followers, Facebook demographics etc. Crafting an eye catching presentation has never been more straightforward. Let your presentation shine with this tasteful yet straightforward Software Implementation Strategy Digital Marketing Software Key Metrics Dashboard Template PDF template. It offers a minimalistic and classy look that is great for making a statement. The colors have been employed intelligently to add a bit of playfulness while still remaining professional. Construct the idealSoftware Implementation Strategy Digital Marketing Software Key Metrics Dashboard Template PDF that effortlessly grabs the attention of your audience Begin now and be certain to wow your customers.

Call Center Metrics Dashboard To Measure Customer Satisfaction Level Slides PDF
Mentioned slide outlines call center KPI dashboard which will assist various call centers to evaluate the customer satisfaction level. The critical KPIs mentioned in the template are total revenue earned, cost per support, average time taken to solve an issue etc. Showcasing this set of slides titled Call Center Metrics Dashboard To Measure Customer Satisfaction Level Slides PDF. The topics addressed in these templates are Total Revenue, Support Costs, Customer Satisfaction. All the content presented in this PPT design is completely editable. Download it and make adjustments in color, background, font etc. as per your unique business setting.
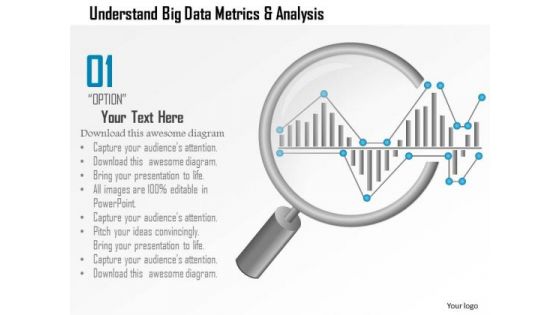
Business Diagram Understand Big Data Metrics And Analysis Showing By Magnifying Glass Ppt Slide
This PPT slide has been designed with big data metrics and magnifying glass. This diagram helps to portray concept of data analysis and data search. Download this diagram to make professional presentations.

Coverage Financial Ratios Chart For 5 Financial Years Themes PDF
This slide illustrates graph for coverage ratios that are interest coverage ratio, debt service coverage ratio and asset coverage ratio. It showcases comparison for a period of 5 years that can help company to measure ability to service its debt and meet its financial obligations Showcasing this set of slides titled coverage financial ratios chart for 5 financial years themes pdf. The topics addressed in these templates are coverage financial ratios chart for 5 financial years. All the content presented in this PPT design is completely editable. Download it and make adjustments in color, background, font etc. as per your unique business setting.
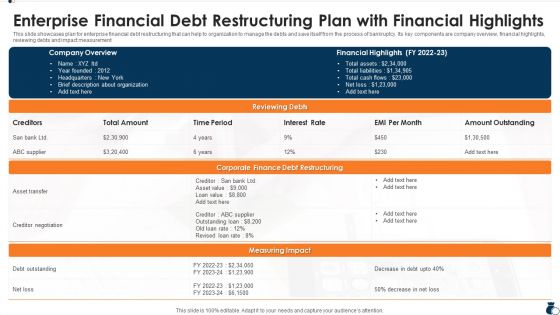
Enterprise Financial Debt Restructuring Plan With Financial Highlights Rules PDF
This slide showcases plan for enterprise financial debt restructuring that can help to organization to manage the debts and save itself from the process of bankruptcy. Its key components are company overview, financial highlights, reviewing debts and impact measurement. Deliver and pitch your topic in the best possible manner with this Enterprise Financial Debt Restructuring Plan With Financial Highlights Rules PDF. Use them to share invaluable insights on Rate, Supplier, Financial Highlights and impress your audience. This template can be altered and modified as per your expectations. So, grab it now.
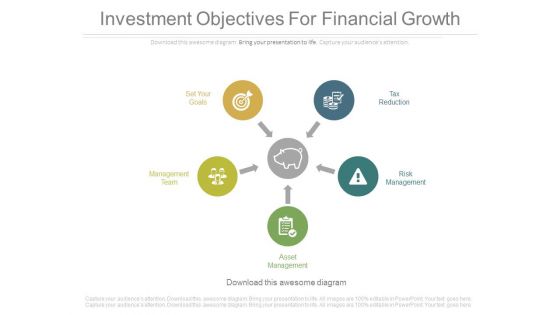
Investment Objectives For Financial Growth Ppt Slides
This is an investment objectives for financial growth ppt slides. This is a five stage process. The stages in this process are marketing, business, success, arrows.
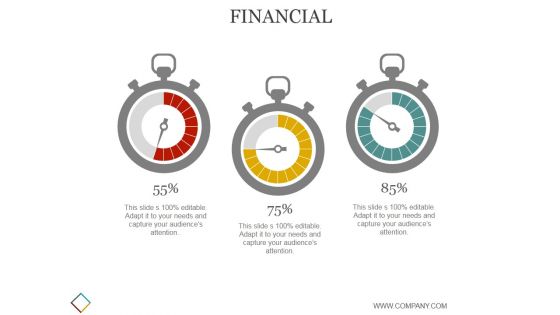
Financial Ppt PowerPoint Presentation Guide
This is a financial ppt powerpoint presentation guide. This is a three stage process. The stages in this process are business, strategy, marketing, analysis, dashboard, measuring.
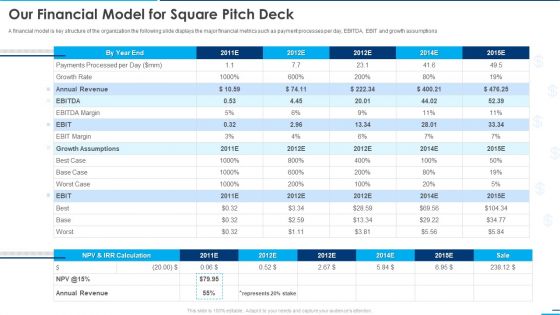
Our Financial Model For Square Pitch Deck Ppt Outline Master Slide PDF
A financial model is key structure of the organization the following slide displays the major financial metrics such as payment processes per day, EBITDA, EBIT and growth assumptions Deliver an awe inspiring pitch with this creative our financial model for square pitch deck ppt outline master slide pdf bundle. Topics like margin, growth rate, payments, annual revenue can be discussed with this completely editable template. It is available for immediate download depending on the needs and requirements of the user.
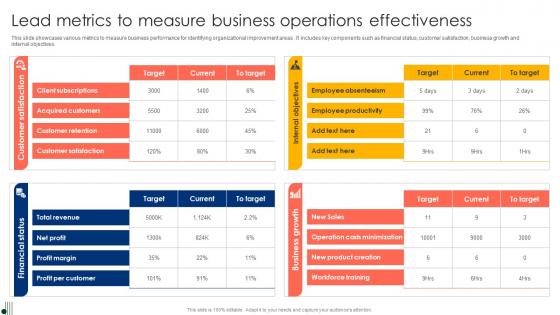
Lead Metrics To Measure Business Operations Effectiveness Ppt Styles Graphics Pdf
This slide showcases various metrics to measure business performance for identifying organizational improvement areas. It includes key components such as financial status, customer satisfaction, business growth and internal objectives. Pitch your topic with ease and precision using this Lead Metrics To Measure Business Operations Effectiveness Ppt Styles Graphics Pdf. This layout presents information on Financial Status, Customer Satisfaction, Business Growth. It is also available for immediate download and adjustment. So, changes can be made in the color, design, graphics or any other component to create a unique layout.
Social Media And Word Of Mouth Metrics Ppt PowerPoint Presentation Model Icon
This is a social media and word of mouth metrics ppt powerpoint presentation model icon. This is a two stage process. The stages in this process are finance, management, strategy, analysis, marketing.

Social Media And Word Of Mouth Metrics Ppt PowerPoint Presentation Layouts Graphics
This is a social media and word of mouth metrics ppt powerpoint presentation layouts graphics. This is a three stage process. The stages in this process are finance, marketing, management, investment, analysis.

Information Technology Functions Management Infrastructure KPI Metrics Showing Square Meter Area Summary PDF
Presenting information technology functions management infrastructure kpi metrics showing square meter area summary pdf to provide visual cues and insights. Share and navigate important information on three stages that need your due attention. This template can be used to pitch topics like square meter price, actual construction time, no activities starting time. In addition, this PPT design contains high-resolution images, graphics, etc, that are easily editable and available for immediate download.

Retail KPI Metrics Showing Average Purchase Value And Online Sales Template PDF
This is a retail kpi metrics showing average purchase value and online sales template pdf. template with various stages. Focus and dispense information on four stages using this creative set, that comes with editable features. It contains large content boxes to add your information on topics like sales per square foot, average purchase, value customers satisfied, online sales. You can also showcase facts, figures, and other relevant content using this PPT layout. Grab it now.

HRM System Integration Framework With Key Metrics Ppt PowerPoint Presentation File Model PDF
Showcasing this set of slides titled hrm system integration framework with key metrics ppt powerpoint presentation file model pdf. The topics addressed in these templates are financial kpis, strategic focus, process kpis. All the content presented in this PPT design is completely editable. Download it and make adjustments in color, background, font etc. as per your unique business setting.

Supply Chain Management Metrics With Order Status Ppt PowerPoint Presentation Layouts Graphics Design PDF
Presenting this set of slides with name supply chain management metrics with order status ppt powerpoint presentation layouts graphics design pdf. The topics discussed in these slides are global financial performance, inventory, orders, volume today, kpis monthly. This is a completely editable PowerPoint presentation and is available for immediate download. Download now and impress your audience.
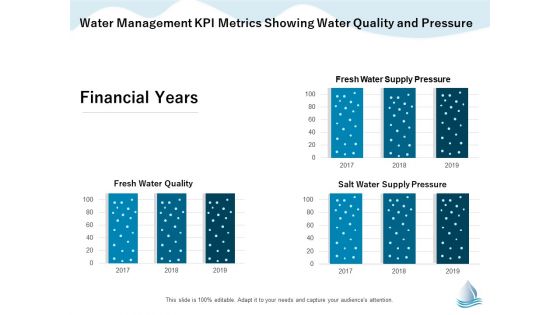
Underground Aquifer Supervision Water Management Kpi Metrics Showing Water Quality Introduction PDF
Presenting this set of slides with name underground aquifer supervision water management kpi metrics showing water quality introduction pdf. The topics discussed in these slides are supply, quality, financial years. This is a completely editable PowerPoint presentation and is available for immediate download. Download now and impress your audience.
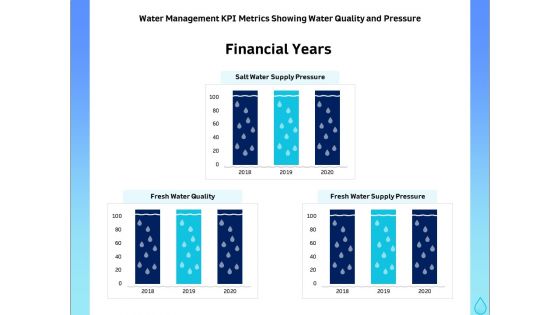
Integrated Water Resource Management Water Management KPI Metrics Showing Water Quality And Pressure Portrait PDF
Presenting this set of slides with name integrated water resource management water management kpi metrics showing water quality and pressure portrait pdf. The topics discussed in these slides are financial years, fresh water quality, fresh water supply pressure, salt water supply pressure, 2018 to 2020. This is a completely editable PowerPoint presentation and is available for immediate download. Download now and impress your audience.
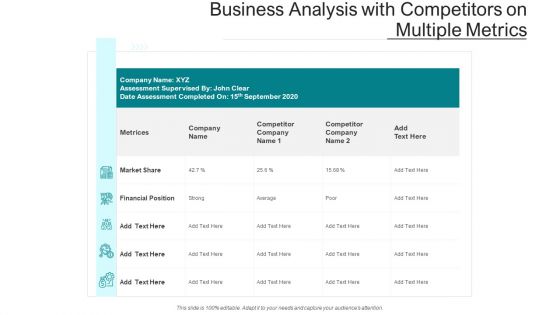
Business Analysis With Competitors On Multiple Metrics Ppt PowerPoint Presentation Summary Information PDF
Pitch your topic with ease and precision using this business analysis with competitors on multiple metrics ppt powerpoint presentation summary information pdf. This layout presents information on market share, financial position, competitor. It is also available for immediate download and adjustment. So, changes can be made in the color, design, graphics or any other component to create a unique layout.
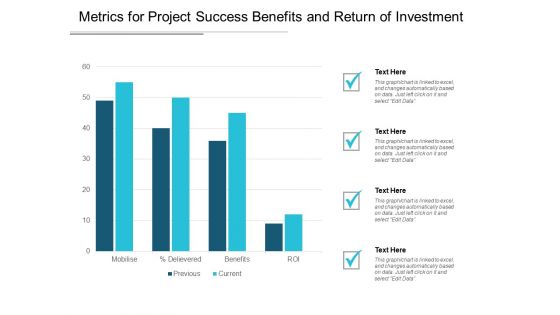
Metrics For Project Success Benefits And Return Of Investment Ppt PowerPoint Presentation Pictures Structure
This is a metrics for project success benefits and return of investment ppt powerpoint presentation pictures structure. This is a four stage process. The stages in this process are project dashboard, project kpis, project metrics.
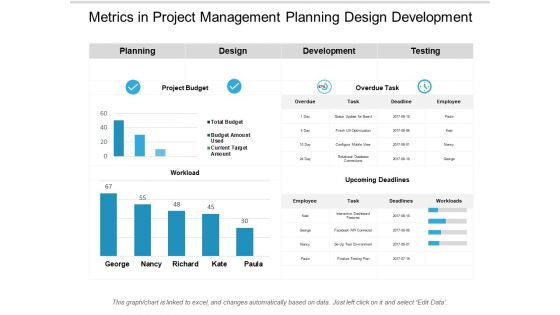
Metrics In Project Management Planning Design Development Ppt PowerPoint Presentation Outline Show
This is a metrics in project management planning design development ppt powerpoint presentation outline show. This is a two stage process. The stages in this process are project dashboard, project kpis, project metrics.
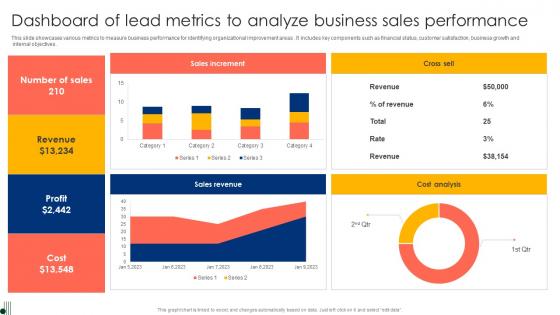
Dashboard Of Lead Metrics To Analyze Business Sales Performance Ppt Summary Graphics Pdf
This slide showcases various metrics to measure business performance for identifying organizational improvement areas. It includes key components such as financial status, customer satisfaction, business growth and internal objectives. Showcasing this set of slides titled Dashboard Of Lead Metrics To Analyze Business Sales Performance Ppt Summary Graphics Pdf. The topics addressed in these templates are Sales Increment, Cross Sell, Cost Analysis. All the content presented in this PPT design is completely editable. Download it and make adjustments in color, background, font etc. as per your unique business setting.
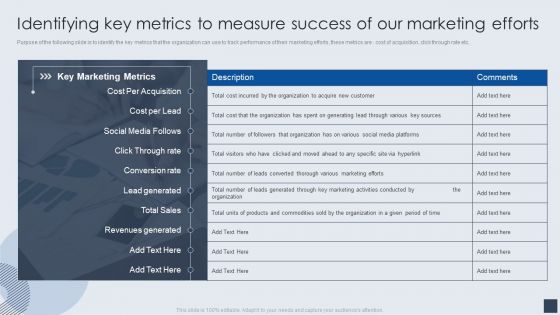
Identifying Key Metrics To Measure Success Of Our Marketing Efforts Download PDF
Purpose of the following slide is to identify the key metrics that the organization can use to track performance of their marketing efforts, these metrics are cost of acquisition, click through rate etc. Presenting Identifying Key Metrics To Measure Success Of Our Marketing Efforts Download PDF to provide visual cues and insights. Share and navigate important information on one stages that need your due attention. This template can be used to pitch topics like Social Media, Cost Per Acquisition, Key Marketing Metrics. In addtion, this PPT design contains high resolution images, graphics, etc, that are easily editable and available for immediate download.
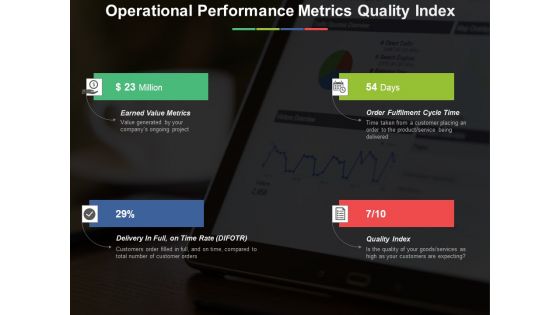
Operational Performance Metrics Quality Index Ppt PowerPoint Presentation Summary Layout Ideas
This is a operational performance metrics quality index ppt powerpoint presentation summary layout ideas. This is a four stage process. The stages in this process are earned value metrics, order fulfilment cycle time, quality index, delivery in full on time rate.

Sales And Business Development Action Plan Marketing Future Action Metrics Ppt Infographics Designs Download PDF
Presenting this set of slides with name sales and business development action plan marketing future action metrics ppt infographics designs download pdf. This is a one stage process. The stages in this process are metrics, current, goal, timeline, brand awareness, conversion rate optimization. This is a completely editable PowerPoint presentation and is available for immediate download. Download now and impress your audience.
Social Media And Word Of Mouth Metrics Ppt Powerpoint Presentation Icon Portfolio
This is a social media and word of mouth metrics ppt powerpoint presentation icon portfolio. This is a ten stage process. The stages in this process are financial, marketing, analysis, investment, business.
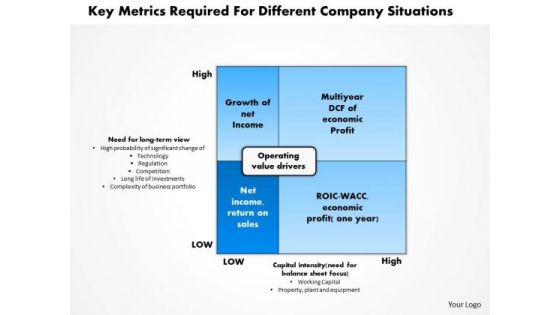
Business Framework Key Metrics Required For Different Company Situations PowerPoint Presentation
This diagram has been designed with framework of key metrics required for different company situations. This diagram contains rectangle of operating value drivers with four sections inside it representing terms like growth of net Income, multiyear DCF of economic profit, net income, return on sales, ROIC-WACC, and economic profit. Use this as a major element in streamlining any business process.

Redis Cache Data Structure IT Performance Memory And Activity Metrics Introduction PDF
This slide depicts performance memory and activity metrics dashboard for Redis cache, including cache hit ratio, slow log, latency, used memory, etc. This is a redis cache data structure it performance memory and activity metrics introduction pdf template with various stages. Focus and dispense information on one stages using this creative set, that comes with editable features. It contains large content boxes to add your information on topics like performance memory and activity metrics dashboard for redis cache. You can also showcase facts, figures, and other relevant content using this PPT layout. Grab it now.
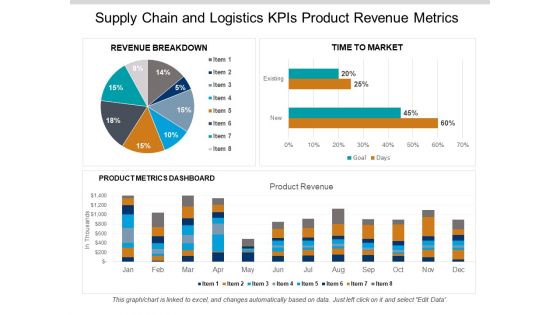
Supply Chain And Logistics Kpis Product Revenue Metrics Ppt PowerPoint Presentation Gallery Aids
This is a supply chain and logistics kpis product revenue metrics ppt powerpoint presentation gallery aids. This is a three stage process. The stages in this process are logistics performance, logistics dashboard, logistics kpis.

Inventory Management Kpis And Metrics Carrying Cost And Turnover Ppt PowerPoint Presentation Information
This is a inventory management kpis and metrics carrying cost and turnover ppt powerpoint presentation information. This is a five stage process. The stages in this process are logistics performance, logistics dashboard, logistics kpis.
Logistics Kpis And Metrics Percentage Of Orders Delivered Ppt PowerPoint Presentation Icon
This is a logistics kpis and metrics percentage of orders delivered ppt powerpoint presentation icon. This is a five stage process. The stages in this process are logistics performance, logistics dashboard, logistics kpis.

Operational Performance Metrics Customer Support Tickets Ppt PowerPoint Presentation Outline Graphics Design
This is a operational performance metrics customer support tickets ppt powerpoint presentation outline graphics design. This is a four stage process. The stages in this process are customer support tickets, percentage of product defects, lob efficiency measure, process downtime level.
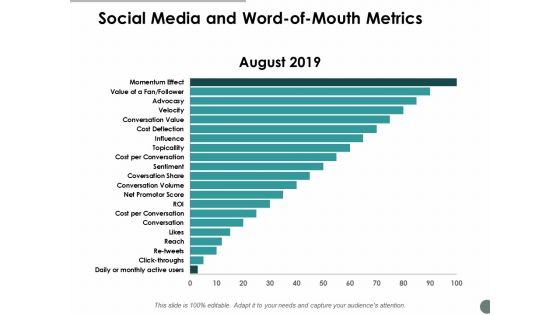
Social Media And Word Of Mouth Metrics Ppt Powerpoint Presentation Show Example Introduction
This is a social media and word of mouth metrics ppt powerpoint presentation show example introduction. This is a two stage process. The stages in this process are finance, marketing, management, investment, analysis.

Digitalization Corporate Initiative Ecommerce Management KPI Metrics Average Ppt Styles Slide Portrait Pdf
digitalization corporate initiative ecommerce management kpi metrics average ppt styles slide portrait pdf template with various stages. Focus and dispense information on five stages using this creative set, that comes with editable features. It contains large content boxes to add your information on topics like ecommerce management kpi metrics. You can also showcase facts, figures, and other relevant content using this PPT layout. Grab it now.
Talent Management Systems KPI Metrics And Dashboard Ppt File Vector PDF
This is a talent management systems kpi metrics and dashboard ppt file vector pdf template with various stages. Focus and dispense information on one stage using this creative set, that comes with editable features. It contains large content boxes to add your information on topics like kpi metrics and dashboard. You can also showcase facts, figures, and other relevant content using this PPT layout. Grab it now.
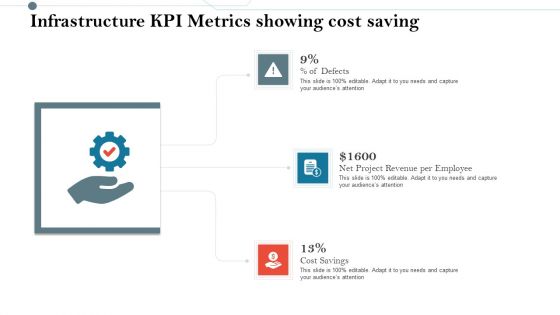
Construction Management Services And Action Plan Infrastructure KPI Metrics Showing Cost Saving Pictures PDF
Presenting construction management services and action plan infrastructure kpi metrics showing cost saving pictures pdf to provide visual cues and insights. Share and navigate important information on three stages that need your due attention. This template can be used to pitch topics like infrastructure kpi metrics showing cost saving. In addtion, this PPT design contains high resolution images, graphics, etc, that are easily editable and available for immediate download.
Metrics To Improve Cash Flow Tracking Icon Ppt Inspiration Outfit PDF
Persuade your audience using this Metrics To Improve Cash Flow Tracking Icon Ppt Inspiration Outfit PDF. This PPT design covers three stages, thus making it a great tool to use. It also caters to a variety of topics including Metrics To Improve, Cash Flow, Tracking Icon. Download this PPT design now to present a convincing pitch that not only emphasizes the topic but also showcases your presentation skills.
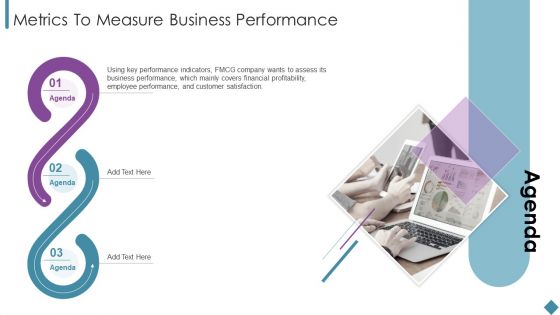
Metrics To Measure Business Performance Agenda Ppt Layouts Graphic Images PDF
This is a Metrics To Measure Business Performance Agenda Ppt Layouts Graphic Images PDF template with various stages. Focus and dispense information on three stages using this creative set, that comes with editable features. It contains large content boxes to add your information on topics like Key Performance Indicators, Financial Profitability, Customer Satisfaction. You can also showcase facts, figures, and other relevant content using this PPT layout. Grab it now.
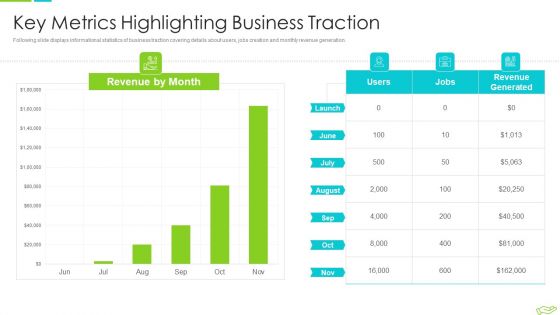
Elevator Pitch Deck To Raise Funds Key Metrics Highlighting Business Traction Clipart PDF
Following slide displays informational statistics of business traction covering details about users, jobs creation and monthly revenue generation. Deliver and pitch your topic in the best possible manner with this elevator pitch deck to raise funds key financial projections for upcoming years pictures pdf. Use them to share invaluable insights on key metrics highlighting business traction and impress your audience. This template can be altered and modified as per your expectations. So, grab it now.

Managing Agriculture Land And Water Water Management KPI Metrics Showing Water Quality And Pressure Themes PDF
Presenting this set of slides with name managing agriculture land and water water management kpi metrics showing water quality and pressure themes pdf. The topics discussed in these slides are financial years, fresh water quality, fresh water supply pressure, salt water supply pressure, 2018 to 2020. This is a completely editable PowerPoint presentation and is available for immediate download. Download now and impress your audience.

Cloud Content Delivery Network Key CDN Metrics To Watch Background PDF
This slide represents the key CDN metrics to watch while looking for a CDN provider, such as the time it takes DNS to reply. Explore a selection of the finest Cloud Content Delivery Network Key CDN Metrics To Watch Background PDF here. With a plethora of professionally designed and pre made slide templates, you can quickly and easily find the right one for your upcoming presentation. You can use our Cloud Content Delivery Network Key CDN Metrics To Watch Background PDF to effectively convey your message to a wider audience. Slidegeeks has done a lot of research before preparing these presentation templates. The content can be personalized and the slides are highly editable. Grab templates today from Slidegeeks.

Collection Of Quality Assurance PPT Data Quality Management Metrics Information PDF
Mentioned slide displays customer data quality management dashboard with metrics namely consistency, accuracy, completeness, auditability, orderliness, uniqueness and timeliness. This is a collection of quality assurance ppt data quality management metrics information pdf template with various stages. Focus and dispense information on eight stages using this creative set, that comes with editable features. It contains large content boxes to add your information on topics like accuracy, auditability, consistency, completeness, uniqueness. You can also showcase facts, figures, and other relevant content using this PPT layout. Grab it now.

Quality Assurance Templates Set 2 Data Quality Management Metrics Pictures PDF
Mentioned slide displays customer data quality management dashboard with metrics namely consistency, accuracy, completeness, auditability, orderliness, uniqueness and timeliness. Presenting quality assurance templates set 2 data quality management metrics pictures pdf to provide visual cues and insights. Share and navigate important information on eight stages that need your due attention. This template can be used to pitch topics like consistency, completeness, orderliness, timelines, accuracy. In addtion, this PPT design contains high resolution images, graphics, etc, that are easily editable and available for immediate download.
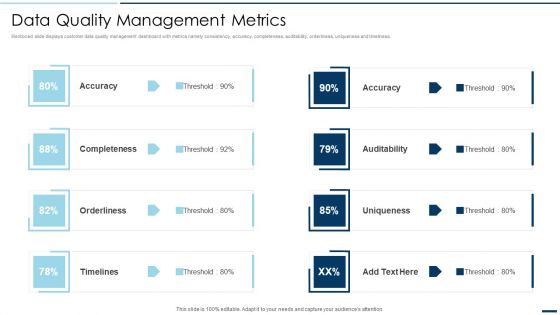
QA Plan Set 2 Data Quality Management Metrics Ppt PowerPoint Presentation Gallery Background Image PDF
Mentioned slide displays customer data quality management dashboard with metrics namely consistency, accuracy, completeness, auditability, orderliness, uniqueness and timeliness. Presenting QA Plan Set 2 Data Quality Management Metrics Ppt PowerPoint Presentation Gallery Background Image PDF to provide visual cues and insights. Share and navigate important information on eight stages that need your due attention. This template can be used to pitch topics like Accuracy Completeness, Orderliness Timelines. In addtion, this PPT design contains high resolution images, graphics, etc, that are easily editable and available for immediate download.

Construction Production Facilities Infrastructure KPI Metrics Showing Cost Saving Background PDF
Presenting this set of slides with name construction production facilities infrastructure kpi metrics showing cost saving background pdf. This is a three stage process. The stages in this process are net project revenue per employee, cost savings, defects. This is a completely editable PowerPoint presentation and is available for immediate download. Download now and impress your audience.

Firm Productivity Administration Business Intelligence KPI Metrics SEO Ppt PowerPoint Presentation File Visual Aids PDF
Presenting this set of slides with name firm productivity administration business intelligence kpi metrics seo ppt powerpoint presentation file visual aids pdf. This is a four stage process. The stages in this process are seo traffic weekly, trip distance, usa clients, ytd revenue millions. This is a completely editable PowerPoint presentation and is available for immediate download. Download now and impress your audience.
Healthcare Management KPI Metrics Showing Incidents Length Of Stay Ppt PowerPoint Presentation Icon Background
Presenting this set of slides with name healthcare management kpi metrics showing incidents length of stay ppt powerpoint presentation icon background. This is a four stage process. The stages in this process are incidents, average waiting time, overall patient satisfaction, management, marketing. This is a completely editable PowerPoint presentation and is available for immediate download. Download now and impress your audience.

Healthcare Management KPI Metrics Showing Treatment Cost And Waiting Time Ppt PowerPoint Presentation Ideas Files
Presenting this set of slides with name healthcare management kpi metrics showing treatment cost and waiting time ppt powerpoint presentation ideas files. This is a three stage process. The stages in this process are business, management, planning, strategy, marketing. This is a completely editable PowerPoint presentation and is available for immediate download. Download now and impress your audience.
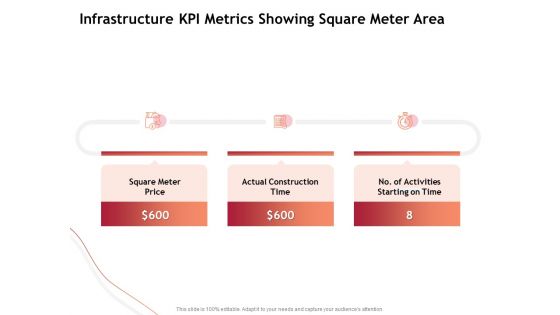
Performance Measuement Of Infrastructure Project Infrastructure KPI Metrics Showing Square Meter Area Download PDF
Presenting this set of slides with name performance measuement of infrastructure project infrastructure kpi metrics showing square meter area download pdf. This is a three stage process. The stages in this process are square meter price, actual construction time, number of activities starting on time. This is a completely editable PowerPoint presentation and is available for immediate download. Download now and impress your audience.

Introducing CRM Framework Within Organization Customer Relationship Management KPI Metrics Orders Background PDF
Presenting this set of slides with name introducing crm framework within organization customer relationship management kpi metrics orders background pdf. This is a four stage process. The stages in this process are customer, feedback form, total orders, mails 30 days. This is a completely editable PowerPoint presentation and is available for immediate download. Download now and impress your audience.

Executive Leadership Programs Leadership Management KPI Metrics Ppt PowerPoint Presentation Infographics Format Ideas PDF
Presenting this set of slides with name executive leadership programs leadership management kpi metrics ppt powerpoint presentation infographics format ideas pdf. This is a three stage process. The stages in this process are managerial quality index, current initiatives driven it, staff team excess sick leave. This is a completely editable PowerPoint presentation and is available for immediate download. Download now and impress your audience.
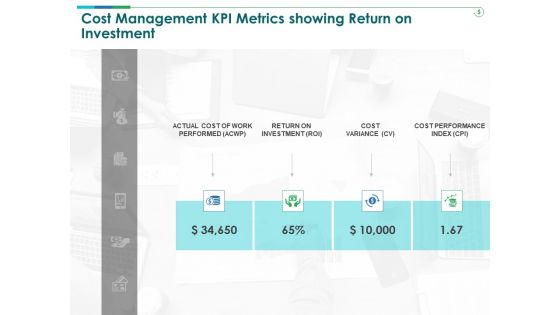
TCM Cost Management KPI Metrics Showing Return On Investment Ppt Professional Graphics PDF
Presenting this set of slides with name tcm cost management kpi metrics showing return on investment ppt professional graphics pdf. This is a four stage process. The stages in this process are performed, cost, investment, variance, return. This is a completely editable PowerPoint presentation and is available for immediate download. Download now and impress your audience.

Firm Productivity Administration Business Intelligence KPI Metrics Average Ppt PowerPoint Presentation Infographics Guidelines PDF
Presenting this set of slides with name firm productivity administration business intelligence kpi metrics average ppt powerpoint presentation infographics guidelines pdf. This is a four stage process. The stages in this process are average purchase value, average lifetime value, average unit price, category id max. This is a completely editable PowerPoint presentation and is available for immediate download. Download now and impress your audience.
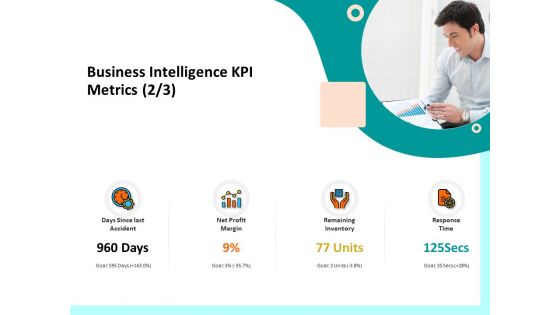
Firm Productivity Administration Business Intelligence KPI Metrics Inventory Ppt PowerPoint Presentation Inspiration Guide PDF
Presenting this set of slides with name firm productivity administration business intelligence kpi metrics inventory ppt powerpoint presentation inspiration guide pdf. This is a four stage process. The stages in this process are days since last accident, net profit margin, remaining inventory, response time. This is a completely editable PowerPoint presentation and is available for immediate download. Download now and impress your audience.

Job Rotation Plan For Staff Metrics To Measure Success Of Job Rotation Programme Diagrams PDF
This slide showcases KPIs that can help organization to measure the success and effectiveness of job rotation programme. It also highlights measurement methods to calculate job rotation programme metrics. Slidegeeks is one of the best resources for PowerPoint templates. You can download easily and regulate Job Rotation Plan For Staff Metrics To Measure Success Of Job Rotation Programme Diagrams PDF for your personal presentations from our wonderful collection. A few clicks is all it takes to discover and get the most relevant and appropriate templates. Use our Templates to add a unique zing and appeal to your presentation and meetings. All the slides are easy to edit and you can use them even for advertisement purposes.

 Home
Home