Financial Metrics

B2B Trade Management Ecommerce Management KPI Metrics Order Elements PDF
Presenting b2b trade management ecommerce management kpi metrics order elements pdf to provide visual cues and insights. Share and navigate important information on five stages that need your due attention. This template can be used to pitch topics like shopping cart conversion rate, shopping cart sessions, shopping cart abandoned, revenue per visitor, order value. In addtion, this PPT design contains high-resolution images, graphics, etc, that are easily editable and available for immediate download.

Data Assimilation Business Intelligence KPI Metrics Miles Ppt Ideas PDF
Presenting data assimilation business intelligence kpi metrics miles ppt ideas pdf to provide visual cues and insights. Share and navigate important information on four stages that need your due attention. This template can be used to pitch topics like seo traffic weekly, trip distance, usa clients, ytd revenue . In addtion, this PPT design contains high resolution images, graphics, etc, that are easily editable and available for immediate download.

Ecommerce Management KPI Metrics Cart Ppt Professional Ideas PDF
This is a ecommerce management kpi metrics cart ppt professional ideas pdf template with various stages. Focus and dispense information on five stages using this creative set, that comes with editable features. It contains large content boxes to add your information on topics like revenue per visitor, average order value, conversion rate. You can also showcase facts, figures, and other relevant content using this PPT layout. Grab it now.

Ecommerce Management KPI Metrics Days Ppt Slides Templates PDF
This is a ecommerce management kpi metrics days ppt slides templates pdf template with various stages. Focus and dispense information on five stages using this creative set, that comes with editable features. It contains large content boxes to add your information on topics like revenue per visitor, average order value, target. You can also showcase facts, figures, and other relevant content using this PPT layout. Grab it now.
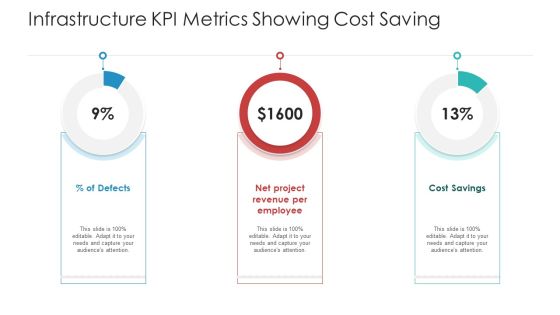
Infrastructure KPI Metrics Showing Cost Saving Diagrams PDF
This is a infrastructure kpi metrics showing cost saving diagrams pdf template with various stages. Focus and dispense information on three stages using this creative set, that comes with editable features. It contains large content boxes to add your information on topics like net project revenue per employee, defects, cost savings . You can also showcase facts, figures, and other relevant content using this PPT layout. Grab it now.
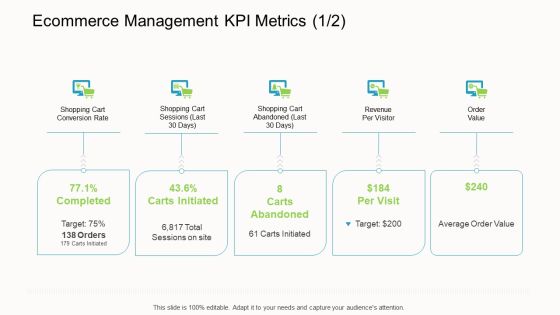
Online Corporate Approach Ecommerce Management KPI Metrics Last Sample PDF
This is a online corporate approach ecommerce management kpi metrics last sample pdf template with various stages. Focus and dispense information on five stages using this creative set, that comes with editable features. It contains large content boxes to add your information on topics like revenue, conversion rate, average order value. You can also showcase facts, figures, and other relevant content using this PPT layout. Grab it now.

Customer Metrics Dashboard For Retention Management Rate Information PDF
This slide represents dashboard exhibiting customer retention management key performance indicators. It covers NPS, loyal customer rate, customer churn, revenue churn etc. Showcasing this set of slides titled customer metrics dashboard for retention management rate information pdf. The topics addressed in these templates are customer, premium users. All the content presented in this PPT design is completely editable. Download it and make adjustments in color, background, font etc. as per your unique business setting.
Market Penetration Dashboard With Sales Metrics Ppt Icon Examples PDF
This slide shows market penetration dashboard for sales team. It provides information about regions, emerging markets, planned sales, actual sales, revenue, gender wise sales, etc. Pitch your topic with ease and precision using this Market Penetration Dashboard With Sales Metrics Ppt Icon Examples PDF. This layout presents information on Emerging Markets, Sales Gender, Actual Sales. It is also available for immediate download and adjustment. So, changes can be made in the color, design, graphics or any other component to create a unique layout.
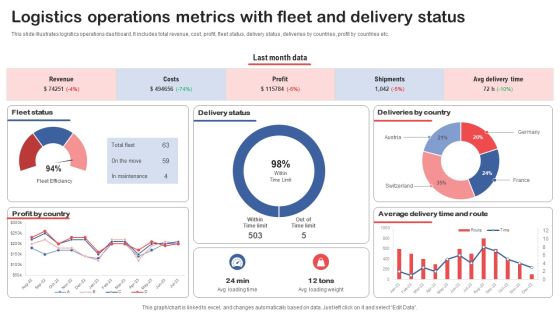
Logistics Operations Metrics With Fleet And Delivery Status Slides PDF
This slide illustrates logistics operations dashboard. It includes total revenue, cost, profit, fleet status, delivery status, deliveries by countries, profit by countries etc. Pitch your topic with ease and precision using this Logistics Operations Metrics With Fleet And Delivery Status Slides PDF. This layout presents information on Fleet Status, Delivery Status, Deliveries By Country. It is also available for immediate download and adjustment. So, changes can be made in the color, design, graphics or any other component to create a unique layout.
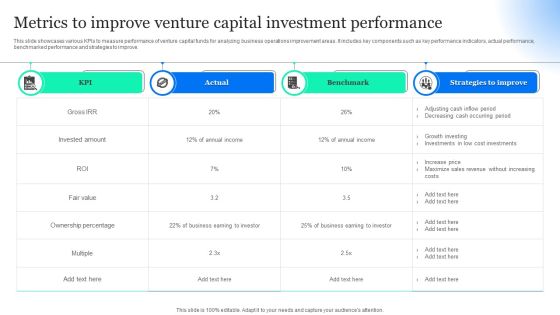
Metrics To Improve Venture Capital Investment Performance Information PDF
This slide showcases various KPIs to measure performance of venture capital funds for analyzing business operations improvement areas. It includes key components such as key performance indicators, actual performance, benchmarked performance and strategies to improve. Pitch your topic with ease and precision using this Metrics To Improve Venture Capital Investment Performance Information PDF. This layout presents information on Actual, Strategies Improve, Benchmark. It is also available for immediate download and adjustment. So, changes can be made in the color, design, graphics or any other component to create a unique layout.

Revenue Performance And Risk Metrics Dashboard Demonstration PDF
This slide illustrates graphical representation of risk key performance indicators. It includes revenue performance of business units with their risk expenditure and people KRIs like employee job satisfaction, customer satisfaction etc. Showcasing this set of slides titled Revenue Performance And Risk Metrics Dashboard Demonstration PDF. The topics addressed in these templates are Total Risk Expenditure, Risk Management, Revenue Performance . All the content presented in this PPT design is completely editable. Download it and make adjustments in color, background, font etc. as per your unique business setting.
Project Metrics Dashboard With Revenues And Expenses Icons PDF
This slide shows the project management dashboard which covers the name, priorities, indicators and status which includes strategic priorities, research and development, administration, performance management, etc. With purchases in last 30 days and tasks. Showcasing this set of slides titled Project Metrics Dashboard With Revenues And Expenses Icons PDF. The topics addressed in these templates are Performance Management, Research And Development, Strategic Priorities. All the content presented in this PPT design is completely editable. Download it and make adjustments in color, background, font etc. as per your unique business setting.

Human Resource Metrics For Organizational Performance Diagrams PDF
This slide showcases KPIs of human resource that can ensure employee retention and workplace productivity in organization. Its key factors are human capital output, human capital capability and health, culture and attitudes and employee lifecycle. Showcasing this set of slides titled Human Resource Metrics For Organizational Performance Diagrams PDF. The topics addressed in these templates are Human Capital Output, Human Capital Capability Health, Culture Attitudes. All the content presented in this PPT design is completely editable. Download it and make adjustments in color, background, font etc. as per your unique business setting.

Metrics And Objectives To Measure Employees Performance Clipart PDF
The purpose of this slide is to showcase different KPIs and objectives used to measure employee efficiency. The KPI could be Revenue per employee profit per employee average task completion rate and utilization rate. Showcasing this set of slides titled Metrics And Objectives To Measure Employees Performance Clipart PDF. The topics addressed in these templates are Utilization Rate, Profit Per Employee, Revenue Per Employee. All the content presented in this PPT design is completely editable. Download it and make adjustments in color, background, font etc. as per your unique business setting.
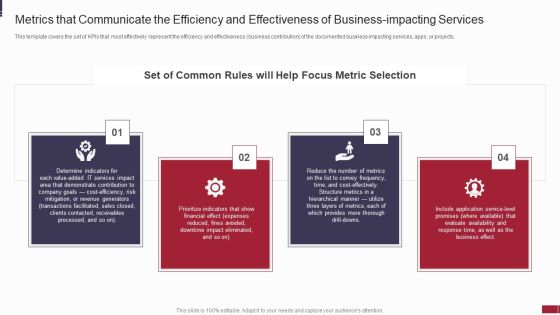
IT Value Story Significant To Corporate Leadership Metrics That Communicate The Efficiency Background PDF
This template covers the set of KPIs that most effectively represent the efficiency and effectiveness business contribution of the documented business-impacting services, apps, or projects. Presenting it value story significant to corporate leadership metrics that communicate the efficiency background pdf to provide visual cues and insights. Share and navigate important information on four stages that need your due attention. This template can be used to pitch topics like determine, financial, expenses, metrics. In addtion, this PPT design contains high resolution images, graphics, etc, that are easily editable and available for immediate download.
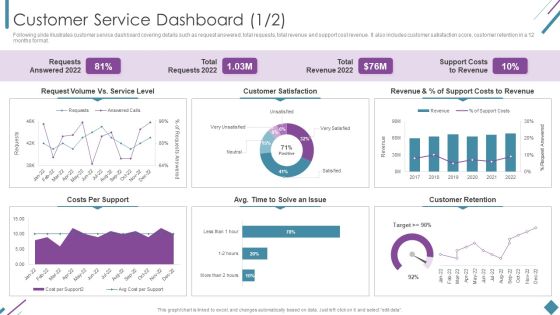
Metrics To Measure Business Performance Customer Service Dashboard Sample PDF
Following slide illustrates customer service dashboard covering details such as request answered, total requests, total revenue and support cost revenue. It also includes customer satisfaction score, customer retention in a 12 months format. Deliver and pitch your topic in the best possible manner with this Metrics To Measure Business Performance Customer Service Dashboard Sample PDF. Use them to share invaluable insights on Requests Answered 2022, Total Requests 2022, Total Revenue 2022 and impress your audience. This template can be altered and modified as per your expectations. So, grab it now.
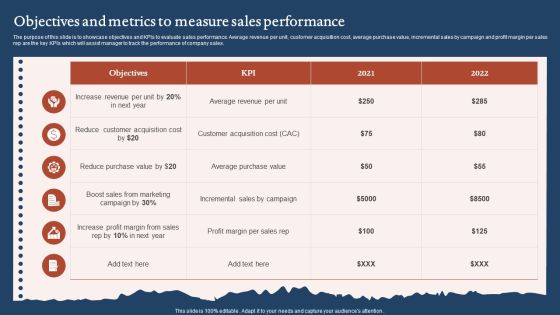
Objectives And Metrics To Measure Sales Performance Sample PDF
The purpose of this slide is to showcase objectives and KPIs to evaluate sales performance. Average revenue per unit, customer acquisition cost, average purchase value, incremental sales by campaign and profit margin per sales rep are the key KPIs which will assist manager to track the performance of company sales. Showcasing this set of slides titled Objectives And Metrics To Measure Sales Performance Sample PDF. The topics addressed in these templates are Reduce Purchase Value, Increase Profit Margin, Customer Acquisition Cost. All the content presented in this PPT design is completely editable. Download it and make adjustments in color, background, font etc. as per your unique business setting.
Tracking Channel Campaign Metrics To Measure Web Traffic Sample PDF
This slide covers measuring campaign key performance indicators through tracking channel web traffic which includes total visit, cost per click, engagement rate and total impressions. Pitch your topic with ease and precision using this Tracking Channel Campaign Metrics To Measure Web Traffic Sample PDF. This layout presents information on Revenue By Channel, Website Demographics, Product Sales Trend. It is also available for immediate download and adjustment. So, changes can be made in the color, design, graphics or any other component to create a unique layout.

Business Key Performance Metrics Review Dashboard Portrait PDF
The following slide shows a dashboard of sales strategy review of firm that can be used by marketing, product, finance managers for reviewing the business. It further includes KPI that are revenue, new customer, gross profit purchaser satisfaction, income comparison, sales categories and profitability. Showcasing this set of slides titled Business Key Performance Metrics Review Dashboard Portrait PDF. The topics addressed in these templates are Sales, Revenue Comparison, Profitability. All the content presented in this PPT design is completely editable. Download it and make adjustments in color, background, font etc. as per your unique business setting.

Effective Sales And Marketing Target Metrics Mockup PDF
This slide presents effective sales and marketing KPIs that should be tracked to reach, act, convert and engage with customers helpful in growing monthly revenue and ultimate target . It includes KPIs for brand, content performance and commercial performance measurement. Pitch your topic with ease and precision using this Effective Sales And Marketing Target Metrics Mockup PDF. This layout presents information on Brand Measures, Content Performance Measures, Commercial Measures. It is also available for immediate download and adjustment. So, changes can be made in the color, design, graphics or any other component to create a unique layout.
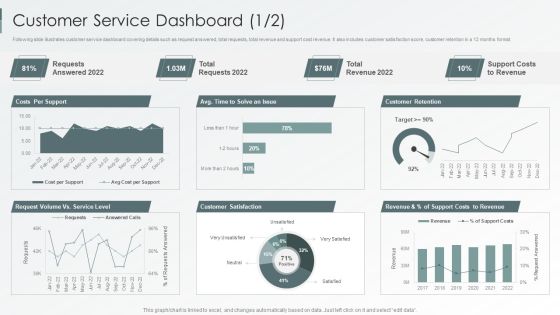
Enterprise Sustainability Performance Metrics Customer Service Dashboard Professional PDF
Following slide illustrates customer service dashboard covering details such as request answered, total requests, total revenue and support cost revenue. It also includes customer satisfaction score, customer retention in a 12 months format.Deliver and pitch your topic in the best possible manner with this Enterprise Sustainability Performance Metrics Customer Service Dashboard Professional PDF. Use them to share invaluable insights on Customer Satisfaction, Customer Retention, Support Revenue and impress your audience. This template can be altered and modified as per your expectations. So, grab it now.
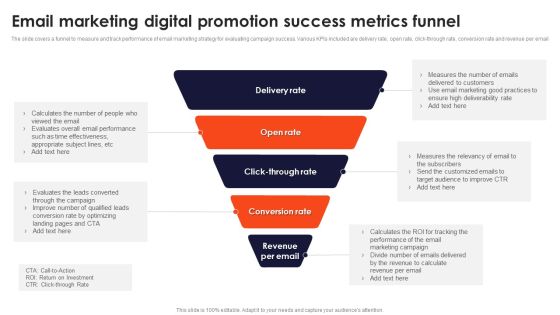
Email Marketing Digital Promotion Success Metrics Funnel Infographics PDF
The slide covers a funnel to measure and track performance of email marketing strategy for evaluating campaign success. Various KPIs included are delivery rate, open rate, click-through rate, conversion rate and revenue per email. Presenting Email Marketing Digital Promotion Success Metrics Funnel Infographics PDF to dispense important information. This template comprises Four stages. It also presents valuable insights into the topics including Delivery Rate, Open Rate, Conversion Rate. This is a completely customizable PowerPoint theme that can be put to use immediately. So, download it and address the topic impactfully.

Digital Marketing Toolkit Marketing Campaigns Transformation Success Metrics Rules PDF
This slide covers the campaign success KPIs such as user acquisition, new users and sessions, user behaviour such as bounce rate, page sessions, average session duration, conversion rate, completion and value for organic, social, direct and referral traffic. Make sure to capture your audiences attention in your business displays with our gratis customizable Digital Marketing Toolkit Marketing Campaigns Transformation Success Metrics Rules PDF. These are great for business strategies, office conferences, capital raising or task suggestions. If you desire to acquire more customers for your tech business and ensure they stay satisfied, create your own sales presentation with these plain slides.
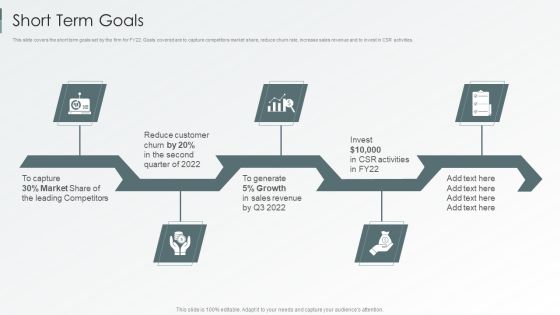
Enterprise Sustainability Performance Metrics Short Term Goals Summary PDF
This slide covers the short term goals set by the firm for FY22. Goals covered are to capture competitors market share, reduce churn rate, increase sales revenue and to invest in CSR activities.This is a Enterprise Sustainability Performance Metrics Short Term Goals Summary PDF template with various stages. Focus and dispense information on five stages using this creative set, that comes with editable features. It contains large content boxes to add your information on topics like Leading Competitors, Sales Revenue, Reduce Customer. You can also showcase facts, figures, and other relevant content using this PPT layout. Grab it now.
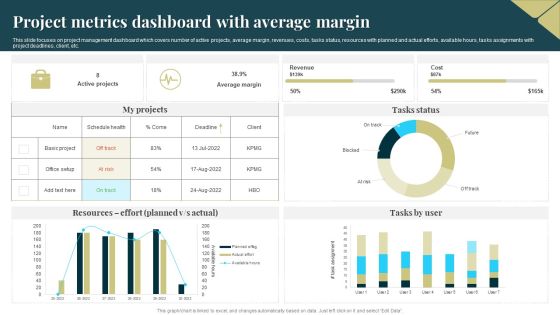
Project Metrics Dashboard With Average Margin Sample PDF
This slide focuses on project management dashboard which covers number of active projects, average margin, revenues, costs, tasks status, resources with planned and actual efforts, available hours, tasks assignments with project deadlines, client, etc. Pitch your topic with ease and precision using this Project Metrics Dashboard With Average Margin Sample PDF. This layout presents information on Average Margin, Revenue, Cost. It is also available for immediate download and adjustment. So, changes can be made in the color, design, graphics or any other component to create a unique layout.
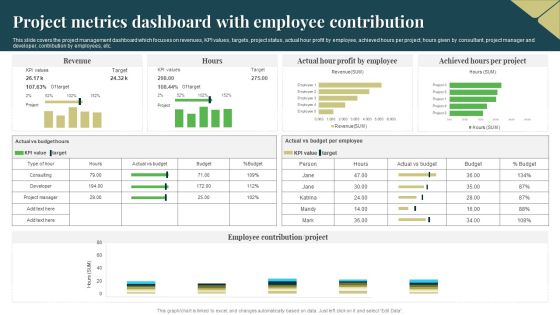
Project Metrics Dashboard With Employee Contribution Guidelines PDF
This slide covers the project management dashboard which focuses on revenues, KPI values, targets, project status, actual hour profit by employee, achieved hours per project, hours given by consultant, project manager and developer, contribution by employees, etc. Showcasing this set of slides titled Project Metrics Dashboard With Employee Contribution Guidelines PDF. The topics addressed in these templates are Target, Revenue, Profit By Employee. All the content presented in this PPT design is completely editable. Download it and make adjustments in color, background, font etc. as per your unique business setting.
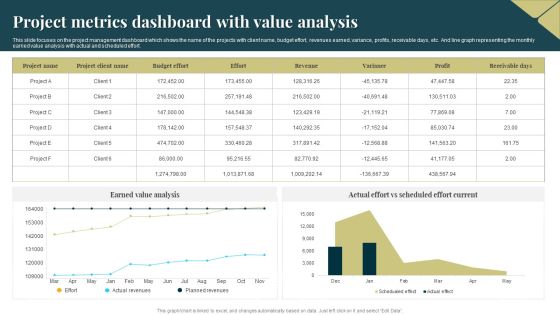
Project Metrics Dashboard With Value Analysis Introduction PDF
This slide focuses on the project management dashboard which shows the name of the projects with client name, budget effort, revenues earned, variance, profits, receivable days, etc. And line graph representing the monthly earned value analysis with actual and scheduled effort. Showcasing this set of slides titled Project Metrics Dashboard With Value Analysis Introduction PDF. The topics addressed in these templates are Budget Effort, Revenues, Earned Value Analysis. All the content presented in this PPT design is completely editable. Download it and make adjustments in color, background, font etc. as per your unique business setting.
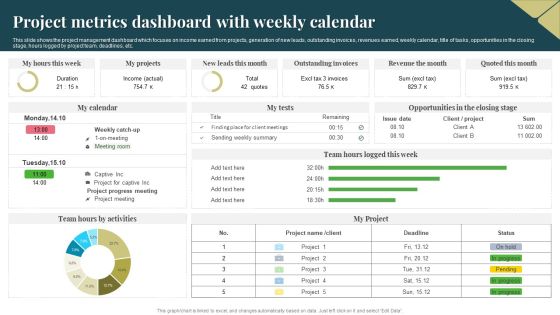
Project Metrics Dashboard With Weekly Calendar Download PDF
This slide shows the project management dashboard which focuses on income earned from projects, generation of new leads, outstanding invoices, revenues earned, weekly calendar, title of tasks, opportunities in the closing stage, hours logged by project team, deadlines, etc. Pitch your topic with ease and precision using this Project Metrics Dashboard With Weekly Calendar Download PDF. This layout presents information on Income, Revenue, Project. It is also available for immediate download and adjustment. So, changes can be made in the color, design, graphics or any other component to create a unique layout.

Cost Management Metrics For Software Development And Management Formats PDF
This slide displays post application lunch analytical report for organization to track total maintenance expenditure and revenues earned from project. It further includes detail about return on investment and breakdown percentage for planning design, testing and development.Showcasing this set of slides titled Cost Management Metrics For Software Development And Management Formats PDF. The topics addressed in these templates are Revenue, Department, Budget. All the content presented in this PPT design is completely editable. Download it and make adjustments in color, background, font etc. as per your unique business setting.

Efficient Analytics Metrics For Tracking Website Performance Professional PDF
This slide exhibits measures to maintain site position in market. The purpose of this slide is to improve ratio of revenue to marketing costs while promoting business successfully. It includes information related to number of visitors, bounce rates, etc. Showcasing this set of slides titled Efficient Analytics Metrics For Tracking Website Performance Professional PDF. The topics addressed in these templates are Number Of Visitors, Bounce Rates, Average Pageviews Per Session. All the content presented in this PPT design is completely editable. Download it and make adjustments in color, background, font etc. as per your unique business setting.

Performance Metrics Dashboard To Track Overall Rebranding Effectiveness Professional PDF
This slide provides information regarding essential characteristics of co-branding in terms of strategic partnership, build credibility, developing marketing strategy, develop innovation and value addition, etc. Make sure to capture your audiences attention in your business displays with our gratis customizable Performance Metrics Dashboard To Track Overall Rebranding Effectiveness Professional PDF. These are great for business strategies, office conferences, capital raising or task suggestions. If you desire to acquire more customers for your tech business and ensure they stay satisfied, create your own sales presentation with these plain slides.

IT Operations Dashboard For Project Metrics Portrait PDF
This slide focuses on dashboard that provides information about the information technology operations for managing IT project which covers the investments, billed amount, time taken to complete the project, customer satisfaction, monthly expenses, service level agreement status, etc. Pitch your topic with ease and precision using this IT Operations Dashboard For Project Metrics Portrait PDF. This layout presents information on Revenues, Investments, Monthly Expenses. It is also available for immediate download and adjustment. So, changes can be made in the color, design, graphics or any other component to create a unique layout.

Customer Service Metrics Dashboard With Net Retention Rate Sample PDF
This slide showcases KPI dashboard for customer service that can help to compare the customer churn rate, revenue churn rate, net retention rate and MRR growth rate as compared to previous month. Its key elements are net promoter score, loyal customer rate, percentage of premium users and customer lifetime value. Pitch your topic with ease and precision using this Customer Service Metrics Dashboard With Net Retention Rate Sample PDF. This layout presents information on Loyal Customer Rate, Premium Users, Customer Lifetime Value. It is also available for immediate download and adjustment. So, changes can be made in the color, design, graphics or any other component to create a unique layout.

Human Capital Metrics Ppt PowerPoint Presentation Complete Deck With Slides
Boost your confidence and team morale with this well-structured Human Capital Metrics Ppt PowerPoint Presentation Complete Deck With Slides. This prefabricated set gives a voice to your presentation because of its well-researched content and graphics. Our experts have added all the components very carefully, thus helping you deliver great presentations with a single click. Not only that, it contains a set of twelve slides that are designed using the right visuals, graphics, etc. Various topics can be discussed, and effective brainstorming sessions can be conducted using the wide variety of slides added in this complete deck. Apart from this, our PPT design contains clear instructions to help you restructure your presentations and create multiple variations. The color, format, design anything can be modified as deemed fit by the user. Not only this, it is available for immediate download. So, grab it now.
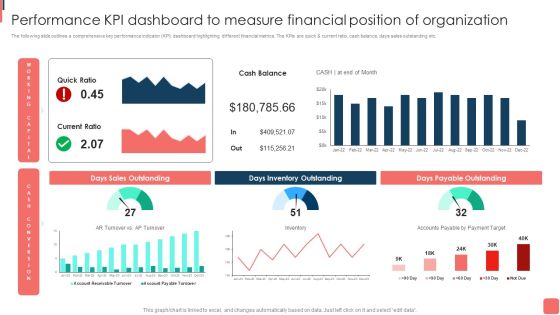
Effective Financial Planning Assessment Techniques Performance Kpi Dashboard To Measure Financial Graphics PDF
The following slide outlines a comprehensive key performance indicator KPI dashboard highlighting different financial metrics. The KPIs are quick and current ratio, cash balance, days sales outstanding etc. The best PPT templates are a great way to save time, energy, and resources. Slidegeeks have 100 precent editable powerpoint slides making them incredibly versatile. With these quality presentation templates, you can create a captivating and memorable presentation by combining visually appealing slides and effectively communicating your message. Download Effective Financial Planning Assessment Techniques Performance Kpi Dashboard To Measure Financial Graphics PDF from Slidegeeks and deliver a wonderful presentation.

Adjusting Financial Strategies And Planning Analyzing Impact Of New Financial Strategic Planning Graphics PDF
This slide showcases the impact assessment of new financial strategy plan on key financial metrics involved. It includes parameters such as revenues, total revenue, revenue growth, expenses, margin EBITDA, etc. Are you in need of a template that can accommodate all of your creative concepts This one is crafted professionally and can be altered to fit any style. Use it with Google Slides or PowerPoint. Include striking photographs, symbols, depictions, and other visuals. Fill, move around, or remove text boxes as desired. Test out color palettes and font mixtures. Edit and save your work, or work with colleagues. Download Adjusting Financial Strategies And Planning Analyzing Impact Of New Financial Strategic Planning Graphics PDF and observe how to make your presentation outstanding. Give an impeccable presentation to your group and make your presentation unforgettable.

Strategical And Tactical Planning Developing Appropriate Criteria Metrics For Strategic Execution Ideas PDF
This template covers balance scorecard for developing appropriate criteria for strategic execution. It includes metrices for financial, learning and growth, customer and internal objectives. Deliver and pitch your topic in the best possible manner with this Strategical And Tactical Planning Developing Appropriate Criteria Metrics For Strategic Execution Ideas PDF. Use them to share invaluable insights on Financial, Learning And Growth, Internal, Customer and impress your audience. This template can be altered and modified as per your expectations. So, grab it now.

Monetary Planning And Evaluation Guide KPI Metrics Dashboard Highlighting Organization Revenue Profitability And Liquidity Ppt Diagram Images PDF
The following slide outlines key performance indicator KPI dashboard showcasing various financial metrics of the organization. The key metrics are gross revenue, product revenue, service revenue, gross profit, net profit etc. Coming up with a presentation necessitates that the majority of the effort goes into the content and the message you intend to convey. The visuals of a PowerPoint presentation can only be effective if it supplements and supports the story that is being told. Keeping this in mind our experts created Monetary Planning And Evaluation Guide KPI Metrics Dashboard Highlighting Organization Revenue Profitability And Liquidity Ppt Diagram Images PDF to reduce the time that goes into designing the presentation. This way, you can concentrate on the message while our designers take care of providing you with the right template for the situation.
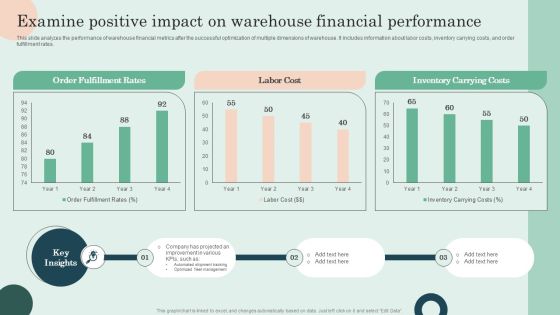
Examine Positive Impact On Warehouse Financial Performance Pictures PDF
This slide analyzes the performance of warehouse financial metrics after the successful optimization of multiple dimensions of warehouse. It includes information about labor costs, inventory carrying costs, and order fulfillment rates. Slidegeeks is one of the best resources for PowerPoint templates. You can download easily and regulate Examine Positive Impact On Warehouse Financial Performance Pictures PDF for your personal presentations from our wonderful collection. A few clicks is all it takes to discover and get the most relevant and appropriate templates. Use our Templates to add a unique zing and appeal to your presentation and meetings. All the slides are easy to edit and you can use them even for advertisement purposes.

Supplier Scorecard Supplier Scorecard With Delivery Lead Time And Breakage Metrics Background PDF
Deliver an awe inspiring pitch with this creative supplier scorecard supplier scorecard with delivery lead time and breakage metrics background pdf bundle. Topics like delivery lead times, financial stability, prices, frequency price changes can be discussed with this completely editable template. It is available for immediate download depending on the needs and requirements of the user.
KPIs And Metrics To Measure Pharmaceutical Drug Of Pharmaceutical Company Icons PDF
Mentioned slide showcases various key performance indicators KPIs which can be used to measure the development of pharmaceutical companies in different years. The key metrics are productivity, competency, quality of care and financial. Showcasing this set of slides titled KPIs And Metrics To Measure Pharmaceutical Drug Of Pharmaceutical Company Icons PDF. The topics addressed in these templates are Productivity, Competency, Quality Of Care. All the content presented in this PPT design is completely editable. Download it and make adjustments in color, background, font etc. as per your unique business setting.

Packaging And Delivering Dashboard With Monthly Key Performance Metrics Microsoft PDF
The following slide showcases dashboard of supply chain with order status key metrics. Main KPIs covered are volume today, global financial performance and inventory. Pitch your topic with ease and precision using this Packaging And Delivering Dashboard With Monthly Key Performance Metrics Microsoft PDF. This layout presents information on Customer, Global Financial Performance, Inventory Distribution. It is also available for immediate download and adjustment. So, changes can be made in the color, design, graphics or any other component to create a unique layout.
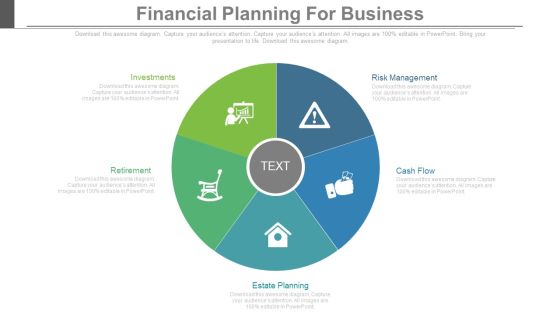
Financial Planning For Business Ppt Slides
This is a financial planning for business ppt slides. This is a five stage process. The stages in this process are business, success, marketing.
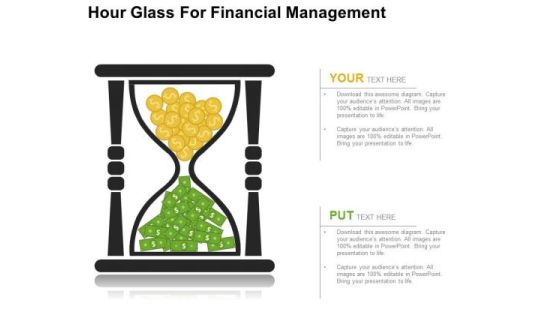
Hour Glass For Financial Management PowerPoint Templates
Create dynamic presentations with this professional slide containing a graphic of hour glass with dollar currency notes and coins. This template is designed to portray the concepts of financial management. Add this slide in your presentations to visually support your content
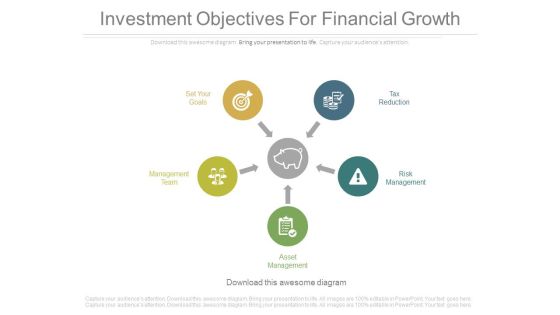
Investment Objectives For Financial Growth Ppt Slides
This is an investment objectives for financial growth ppt slides. This is a five stage process. The stages in this process are marketing, business, success, arrows.

Software Implementation Strategy Digital Marketing Software Key Metrics Dashboard Template PDF
This slide represents the dashboard to track and measure the performance and efficiency of digital marketing software. It includes details related to KPIs such as social media followers, Facebook demographics etc. Crafting an eye catching presentation has never been more straightforward. Let your presentation shine with this tasteful yet straightforward Software Implementation Strategy Digital Marketing Software Key Metrics Dashboard Template PDF template. It offers a minimalistic and classy look that is great for making a statement. The colors have been employed intelligently to add a bit of playfulness while still remaining professional. Construct the idealSoftware Implementation Strategy Digital Marketing Software Key Metrics Dashboard Template PDF that effortlessly grabs the attention of your audience Begin now and be certain to wow your customers.

Call Center Metrics Dashboard To Measure Customer Satisfaction Level Slides PDF
Mentioned slide outlines call center KPI dashboard which will assist various call centers to evaluate the customer satisfaction level. The critical KPIs mentioned in the template are total revenue earned, cost per support, average time taken to solve an issue etc. Showcasing this set of slides titled Call Center Metrics Dashboard To Measure Customer Satisfaction Level Slides PDF. The topics addressed in these templates are Total Revenue, Support Costs, Customer Satisfaction. All the content presented in this PPT design is completely editable. Download it and make adjustments in color, background, font etc. as per your unique business setting.
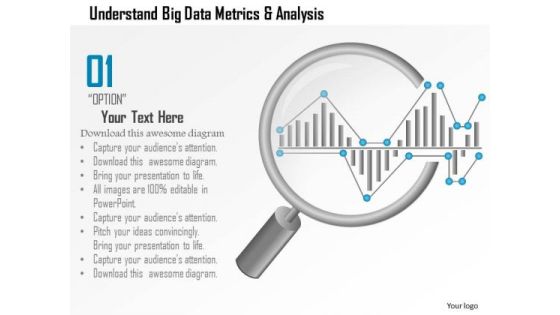
Business Diagram Understand Big Data Metrics And Analysis Showing By Magnifying Glass Ppt Slide
This PPT slide has been designed with big data metrics and magnifying glass. This diagram helps to portray concept of data analysis and data search. Download this diagram to make professional presentations.

Coverage Financial Ratios Chart For 5 Financial Years Themes PDF
This slide illustrates graph for coverage ratios that are interest coverage ratio, debt service coverage ratio and asset coverage ratio. It showcases comparison for a period of 5 years that can help company to measure ability to service its debt and meet its financial obligations Showcasing this set of slides titled coverage financial ratios chart for 5 financial years themes pdf. The topics addressed in these templates are coverage financial ratios chart for 5 financial years. All the content presented in this PPT design is completely editable. Download it and make adjustments in color, background, font etc. as per your unique business setting.

Enterprise Financial Debt Restructuring Plan With Financial Highlights Rules PDF
This slide showcases plan for enterprise financial debt restructuring that can help to organization to manage the debts and save itself from the process of bankruptcy. Its key components are company overview, financial highlights, reviewing debts and impact measurement. Deliver and pitch your topic in the best possible manner with this Enterprise Financial Debt Restructuring Plan With Financial Highlights Rules PDF. Use them to share invaluable insights on Rate, Supplier, Financial Highlights and impress your audience. This template can be altered and modified as per your expectations. So, grab it now.

Financial Ppt PowerPoint Presentation Guide
This is a financial ppt powerpoint presentation guide. This is a three stage process. The stages in this process are business, strategy, marketing, analysis, dashboard, measuring.
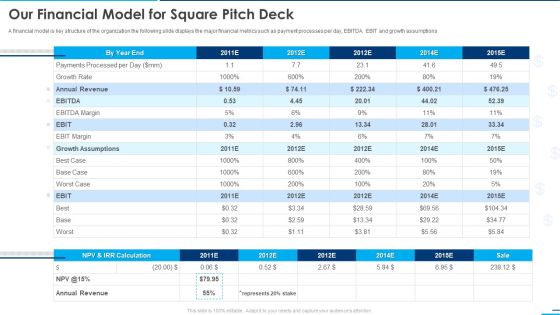
Our Financial Model For Square Pitch Deck Ppt Outline Master Slide PDF
A financial model is key structure of the organization the following slide displays the major financial metrics such as payment processes per day, EBITDA, EBIT and growth assumptions Deliver an awe inspiring pitch with this creative our financial model for square pitch deck ppt outline master slide pdf bundle. Topics like margin, growth rate, payments, annual revenue can be discussed with this completely editable template. It is available for immediate download depending on the needs and requirements of the user.
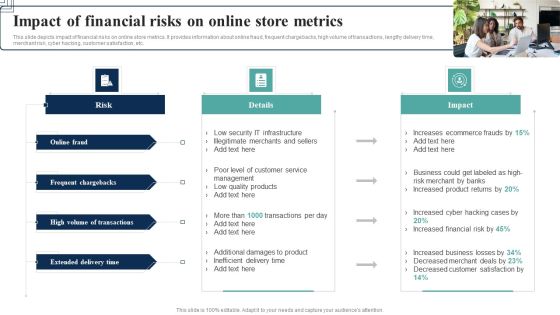
How Electronic Commerce Financial Procedure Can Be Enhanced Impact Of Financial Risks On Online Designs PDF
This slide depicts impact of financial risks on online store metrics. It provides information about online fraud, frequent chargebacks, high volume of transactions, lengthy delivery time, merchant risk, cyber hacking, customer satisfaction, etc.Do you have to make sure that everyone on your team knows about any specific topic I yes, then you should give How Electronic Commerce Financial Procedure Can Be Enhanced Impact Of Financial Risks On Online Designs PDF a try. Our experts have put a lot of knowledge and effort into creating this impeccable How Electronic Commerce Financial Procedure Can Be Enhanced Impact Of Financial Risks On Online Designs PDF. You can use this template for your upcoming presentations, as the slides are perfect to represent even the tiniest detail. You can download these templates from the Slidegeeks website and these are easy to edit. So grab these today.

Business Framework Key Metrics Required For Different Company Situations PowerPoint Presentation
This diagram has been designed with framework of key metrics required for different company situations. This diagram contains rectangle of operating value drivers with four sections inside it representing terms like growth of net Income, multiyear DCF of economic profit, net income, return on sales, ROIC-WACC, and economic profit. Use this as a major element in streamlining any business process.

HRM System Integration Framework With Key Metrics Ppt PowerPoint Presentation File Model PDF
Showcasing this set of slides titled hrm system integration framework with key metrics ppt powerpoint presentation file model pdf. The topics addressed in these templates are financial kpis, strategic focus, process kpis. All the content presented in this PPT design is completely editable. Download it and make adjustments in color, background, font etc. as per your unique business setting.

Supply Chain Management Metrics With Order Status Ppt PowerPoint Presentation Layouts Graphics Design PDF
Presenting this set of slides with name supply chain management metrics with order status ppt powerpoint presentation layouts graphics design pdf. The topics discussed in these slides are global financial performance, inventory, orders, volume today, kpis monthly. This is a completely editable PowerPoint presentation and is available for immediate download. Download now and impress your audience.

Underground Aquifer Supervision Water Management Kpi Metrics Showing Water Quality Introduction PDF
Presenting this set of slides with name underground aquifer supervision water management kpi metrics showing water quality introduction pdf. The topics discussed in these slides are supply, quality, financial years. This is a completely editable PowerPoint presentation and is available for immediate download. Download now and impress your audience.
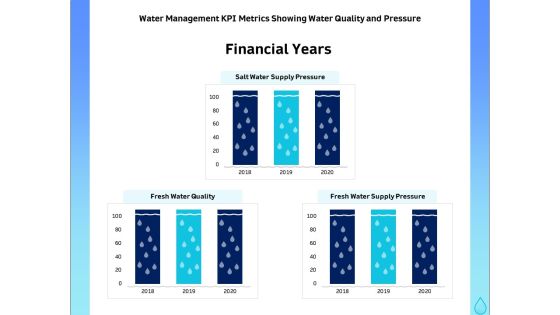
Integrated Water Resource Management Water Management KPI Metrics Showing Water Quality And Pressure Portrait PDF
Presenting this set of slides with name integrated water resource management water management kpi metrics showing water quality and pressure portrait pdf. The topics discussed in these slides are financial years, fresh water quality, fresh water supply pressure, salt water supply pressure, 2018 to 2020. This is a completely editable PowerPoint presentation and is available for immediate download. Download now and impress your audience.

Business Analysis With Competitors On Multiple Metrics Ppt PowerPoint Presentation Summary Information PDF
Pitch your topic with ease and precision using this business analysis with competitors on multiple metrics ppt powerpoint presentation summary information pdf. This layout presents information on market share, financial position, competitor. It is also available for immediate download and adjustment. So, changes can be made in the color, design, graphics or any other component to create a unique layout.

Metrics For Project Success Benefits And Return Of Investment Ppt PowerPoint Presentation Pictures Structure
This is a metrics for project success benefits and return of investment ppt powerpoint presentation pictures structure. This is a four stage process. The stages in this process are project dashboard, project kpis, project metrics.
 Home
Home