Financial Metrics
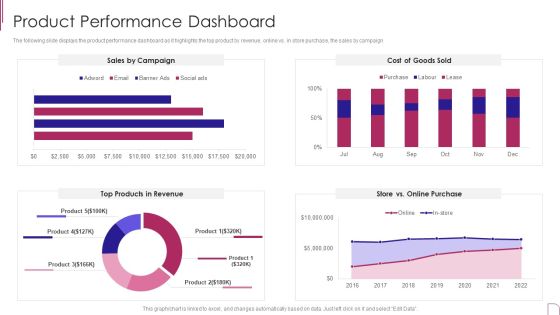
Yearly Product Performance Assessment Repor Product Performance Dashboard Download PDF
The following slide displays the product performance dashboard as it highlights the top product by revenue, online vs. in store purchase, the sales by campaign.Deliver an awe inspiring pitch with this creative Yearly Product Performance Assessment Repor Product Performance Dashboard Download PDF bundle. Topics like Products, Revenue, Online Purchase can be discussed with this completely editable template. It is available for immediate download depending on the needs and requirements of the user.
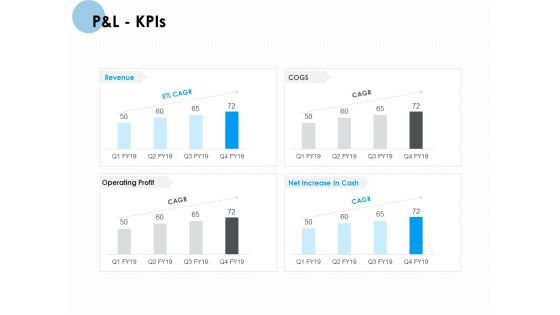
P And L Kpis Ppt PowerPoint Presentation Pictures Visual Aids
Presenting this set of slides with name p and l kpis ppt powerpoint presentation pictures visual aids. The topics discussed in these slides are net sales, total income, expenses, financing cost, profit before tax, profit after tax. This is a completely editable PowerPoint presentation and is available for immediate download. Download now and impress your audience.
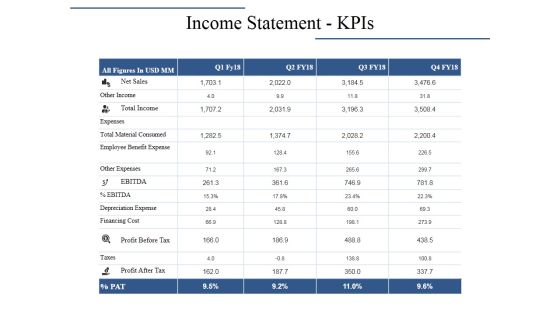
Income Statement Kpis Ppt PowerPoint Presentation Layouts Graphics Pictures
This is a income statement kpis ppt powerpoint presentation layouts graphics pictures. This is a four stage process. The stages in this process are net sales, total income, other income, profit before tax, expenses.

Balance Time And Money Editable PowerPoint Slides
Balance Time and Money Editable PowerPoint Slides-These high quality powerpoint pre-designed slides and powerpoint templates have been carefully created by our professional team to help you impress your audience. All slides have been created and are 100% editable in powerpoint. Each and every property of any graphic - color, size, orientation, shading, outline etc. can be modified to help you build an effective powerpoint presentation. Any text can be entered at any point in the powerpoint template or slide. Simply DOWNLOAD, TYPE and PRESENT!-These PowerPoint presentation slides can be used for themes relating to-Alternative, analysis, balance, brass, bronze, case, classic, comparison, concept, court, crime, doubt, equal, golden, guilt, icon, idea, innocence, judge, justice, law, lawsuit, legal, litigation, measure, opinion, render, scales, sign, symbol, trial, tribunal, value, weigh-Balance Time and Money Editable PowerPoint Slides

Kpis To Track Partnership Project Administration Graphics PDF
This slide covers KPIs which can be measure performance of partnership project management. It includes key performance indicators such as number of partners, revenue through partners, proper satisfaction and number of deal registrations. Pitch your topic with ease and precision using this Kpis To Track Partnership Project Administration Graphics PDF. This layout presents information on Partner Satisfaction, Revenue Through Partners, Number Of Partners. It is also available for immediate download and adjustment. So, changes can be made in the color, design, graphics or any other component to create a unique layout.

Measuring Business Earnings With Profitability Ratios Effective Planning For Monetary Strategy Elements PDF
This slide provides glimpse about profitability ratio analysis for calculating our firms business earnings and net profit margin. It includes quarterly gross profit margin, quarterly net profit margin, key insights, etc.If you are looking for a format to display your unique thoughts, then the professionally designed Measuring Business Earnings With Profitability Ratios Effective Planning For Monetary Strategy Elements PDF is the one for you. You can use it as a Google Slides template or a PowerPoint template. Incorporate impressive visuals, symbols, images, and other charts. Modify or reorganize the text boxes as you desire. Experiment with shade schemes and font pairings. Alter, share or cooperate with other people on your work. Download Measuring Business Earnings With Profitability Ratios Effective Planning For Monetary Strategy Elements PDF and find out how to give a successful presentation. Present a perfect display to your team and make your presentation unforgettable.

Monetary Planning And Evaluation Guide Leverage Ratios To Measure The Debt Level Ppt Infographics Show PDF
The following slide outlines top 2 leverage ratios which will assist the in determining the debt level incurred by the organization. This slide provides information about debt to equity and interest coverage ratio of the company and its competitors for the period of last 3 years. This modern and well-arranged Monetary Planning And Evaluation Guide Leverage Ratios To Measure The Debt Level Ppt Infographics Show PDF provides lots of creative possibilities. It is very simple to customize and edit with the Powerpoint Software. Just drag and drop your pictures into the shapes. All facets of this template can be edited with Powerpoint no extra software is necessary. Add your own material, put your images in the places assigned for them, adjust the colors, and then you can show your slides to the world, with an animated slide included.

AI And ML Driving Monetary Value For Organization Performance Based Comparison Of Competitors Infographics PDF
Following slide illustrates performance comparison of competitors using AI technologies. Performance is measured on parameters such as product quality, price, after sales service and customer service. Deliver an awe inspiring pitch with this creative ai and ml driving monetary value for organization performance based comparison of competitors infographics pdf bundle. Topics like parameters, product quality, price, after sales service, customer service can be discussed with this completely editable template. It is available for immediate download depending on the needs and requirements of the user.

Profitability Measurement Ppt Slide Design
This is a profitability measurement ppt slide design. This is a three stage process. The stages in this process are profitability, monitor result, revenue, expenses.

Business Review With Kpis Purpose And Current Performance Inspiration PDF
The following slide shows key performance indicators measured by firms to review the performance of organization. It KPIs includes customer conversion rate, client retention rate, profit margin and revenue growth. Showcasing this set of slides titled Business Review With Kpis Purpose And Current Performance Inspiration PDF. The topics addressed in these templates are Customer Conversion Rate, Client Retention Rate, Profit Margin. All the content presented in this PPT design is completely editable. Download it and make adjustments in color, background, font etc. as per your unique business setting.

Kpis To Track Personalized Email Marketing Campaign Results Slides PDF
This slide showcases KPIs that can help organization in measure the results of personalized email marketing campaigns. KPIs include - conversion rate, click through rate, click to open rate, revenue per subscriber and revenue per email. Get a simple yet stunning designed Kpis To Track Personalized Email Marketing Campaign Results Slides PDF. It is the best one to establish the tone in your meetings. It is an excellent way to make your presentations highly effective. So, download this PPT today from Slidegeeks and see the positive impacts. Our easy-to-edit Kpis To Track Personalized Email Marketing Campaign Results Slides PDF can be your go-to option for all upcoming conferences and meetings. So, what are you waiting for Grab this template today.
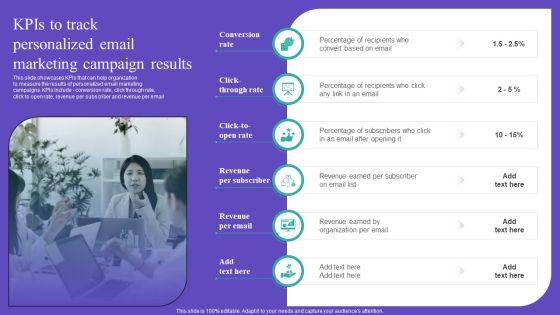
Kpis To Track Personalized Email Marketing Campaign Results Guidelines PDF
This slide showcases KPIs that can help organization to measure the results of personalized email marketing campaigns. KPIs include - conversion rate, click through rate, click to open rate, revenue per subscriber and revenue per email Do you have to make sure that everyone on your team knows about any specific topic I yes, then you should give Kpis To Track Personalized Email Marketing Campaign Results Guidelines PDF a try. Our experts have put a lot of knowledge and effort into creating this impeccable Kpis To Track Personalized Email Marketing Campaign Results Guidelines PDF. You can use this template for your upcoming presentations, as the slides are perfect to represent even the tiniest detail. You can download these templates from the Slidegeeks website and these are easy to edit. So grab these today
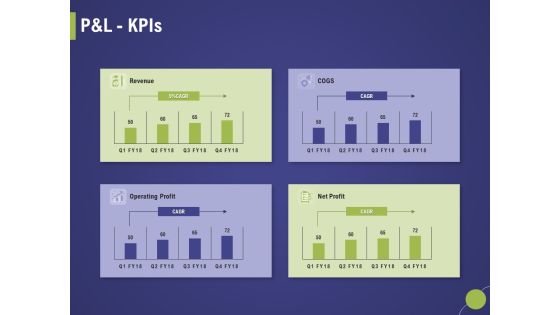
Firm Capability Assessment Pandl Kpis Ppt Inspiration Model PDF
Presenting this set of slides with name firm capability assessment pandl kpis ppt inspiration model pdf. The topics discussed in these slides are expenses, net sales, other income, financing cost, depreciation expense, profit before tax. This is a completely editable PowerPoint presentation and is available for immediate download. Download now and impress your audience.
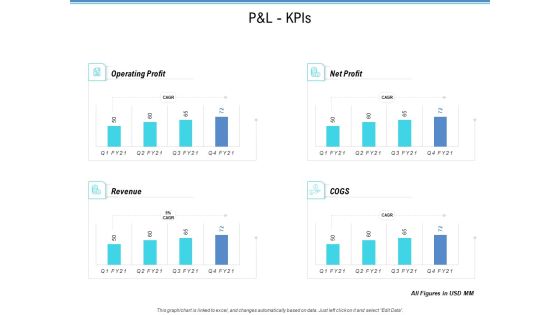
Enterprise Analysis P And L Kpis Ppt Inspiration Demonstration PDF
Deliver an awe-inspiring pitch with this creative enterprise analysis p and l kpis ppt inspiration demonstration pdf bundle. Topics like net sales, expenses, financing cost, material consumed, taxes can be discussed with this completely editable template. It is available for immediate download depending on the needs and requirements of the user.

Project Scorecard Template Business Strategy Productivity Ppt PowerPoint Presentation Complete Deck
Presenting this set of slides with name project scorecard template business strategy productivity ppt powerpoint presentation complete deck. The topics discussed in these slides are business, strategy, productivity, risk management, revenue. This is a completely editable PowerPoint presentation and is available for immediate download. Download now and impress your audience.

Capsim Strategy Balanced Scorecard Based On Project Results Formats PDF
Deliver an awe inspiring pitch with this creative Capsim Strategy Balanced Scorecard Based On Project Results Formats PDF bundle. Topics like Working Capital, Growth, Employee Productivity can be discussed with this completely editable template. It is available for immediate download depending on the needs and requirements of the user.
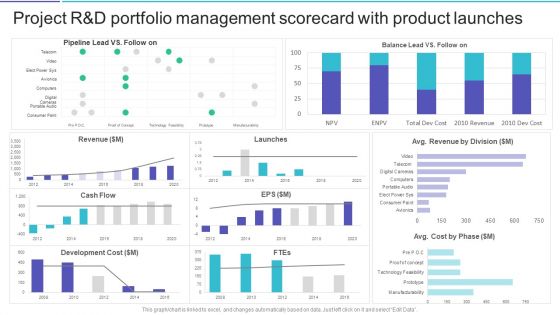
Project R And D Portfolio Management Scorecard With Product Launches Brochure PDF
Deliver and pitch your topic in the best possible manner with this Project R And D Portfolio Management Scorecard With Product Launches Brochure PDF Use them to share invaluable insights on Development Cost, Pipeline Lead, Revenue Division and impress your audience. This template can be altered and modified as per your expectations. So, grab it now.

Auto Sales Scorecard For Petrol Vs Diesel Vehicles Template PDF
This graph or chart is linked to excel, and changes automatically based on data. Just left click on it and select Edit Data. Deliver an awe inspiring pitch with this creative Auto Sales Scorecard For Petrol Vs Diesel Vehicles Template PDF bundle. Topics like Top Products Revenue, Petrol Vs Diesel, Vehicles Incremental Sales, Marketing Activities Product can be discussed with this completely editable template. It is available for immediate download depending on the needs and requirements of the user.

Product Performance Comparison Graph Showing Revenue Growth Portrait PDF
Showcasing this set of slides titled Product Performance Comparison Graph Showing Revenue Growth Portrait PDF. The topics addressed in these templates are Sales Revenue, Product. All the content presented in this PPT design is completely editable. Download it and make adjustments in color, background, font etc. as per your unique business setting.
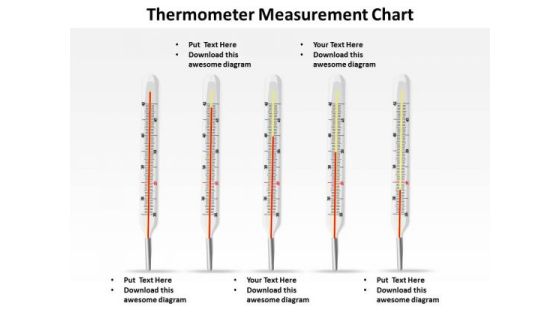
Sales Diagram Thermometer Measurement Chart Marketing Diagram
Your Grasp Of Economics Is Well Known. Help Your Audience Comprehend Issues With Our Sales Diagram Thermometer Measurement Chart Marketing Diagram Powerpoint Templates.

P And L Kpis Template 2 Ppt PowerPoint Presentation Outline Clipart
This is a p and l kpis template 2 ppt powerpoint presentation outline clipart. This is a four stage process. The stages in this process are net sales, total income, expenses, profit before tax, profit after tax.
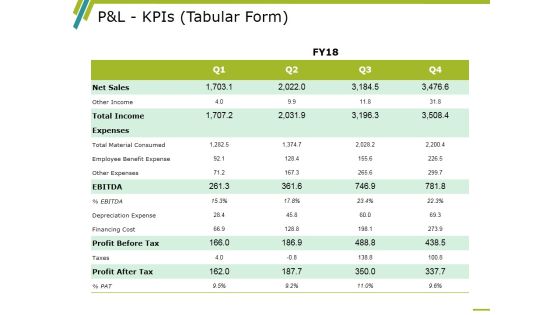
P And L Kpis Template 1 Ppt PowerPoint Presentation Infographics Professional
This is a p and l kpis template 1 ppt powerpoint presentation infographics professional. This is a four stage process. The stages in this process are Other Income, Total Income, Ebitda, Profit Before Tax, Profit After Tax.

Corporate Resource Planning Dashboard To Measure Performance Of ERP Implementation Designs PDF
This slide describes the dashboard to measure the performance of ERP implementation, and it is coving details of production and revenues.Deliver and pitch your topic in the best possible manner with this Corporate Resource Planning Dashboard To Measure Performance Of ERP Implementation Designs PDF Use them to share invaluable insights on Dashboard To Measure, Performance Of ERP, Implementation and impress your audience. This template can be altered and modified as per your expectations. So, grab it now.

Business ERP Software Dashboard To Measure Performance Of ERP Implementation Demonstration PDF
This slide describes the dashboard to measure the performance of ERP implementation, and it is coving details of production and revenues.Deliver an awe inspiring pitch with this creative business erp software dashboard to measure performance of erp implementation demonstration pdf bundle. Topics like communication, marketing, database can be discussed with this completely editable template. It is available for immediate download depending on the needs and requirements of the user.
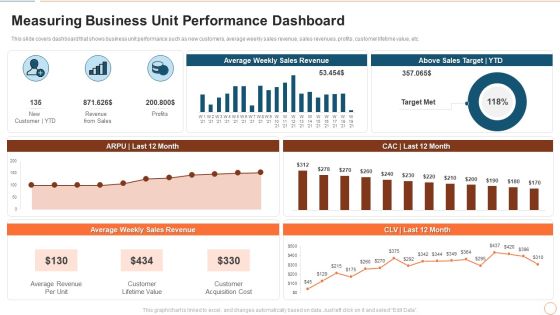
Illustrating Product Leadership Plan Incorporating Innovative Techniques Measuring Business Unit Professional PDF
This slide covers dashboard that shows business unit performance such as new customers, average weekly sales revenue, sales revenues, profits, customer lifetime value, etc. Deliver an awe inspiring pitch with this creative illustrating product leadership plan incorporating innovative techniques measuring business unit professional pdf bundle. Topics like average revenue per unit, customer lifetime value, customer acquisition cost can be discussed with this completely editable template. It is available for immediate download depending on the needs and requirements of the user.

Formulating Competitive Plan Of Action For Effective Product Leadership Measuring Business Unit Slides PDF
This slide covers dashboard that shows business unit performance such as new customers, average weekly sales revenue, sales revenues, profits, customer lifetime value, etc. Deliver an awe inspiring pitch with this creative formulating competitive plan of action for effective product leadership measuring business unit slides pdf bundle. Topics like average revenue per unit, customer lifetime value, customer acquisition cost can be discussed with this completely editable template. It is available for immediate download depending on the needs and requirements of the user.
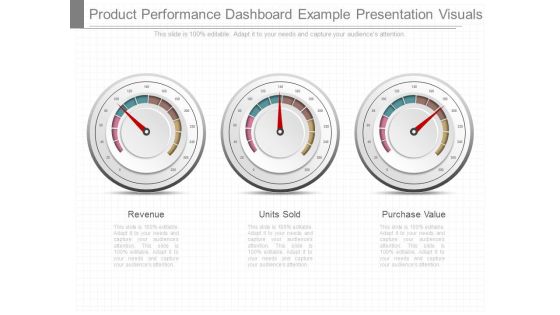
Product Performance Dashboard Example Presentation Visuals
This is a product performance dashboard example presentation visuals. This is a three stage process. The stages in this process are revenue, units sold, purchase value.

Distribution Strategies For Increasing Dashboards To Measure Performance Of Distribution Summary PDF
This slide covers the dashboards to measure performance of various distribution strategies of the organization. This includes partner performance dashboards, top products by revenue, sales by location etc. Want to ace your presentation in front of a live audience Our Distribution Strategies For Increasing Dashboards To Measure Performance Of Distribution Summary PDF can help you do that by engaging all the users towards you. Slidegeeks experts have put their efforts and expertise into creating these impeccable powerpoint presentations so that you can communicate your ideas clearly. Moreover, all the templates are customizable, and easy-to-edit and downloadable. Use these for both personal and commercial use.
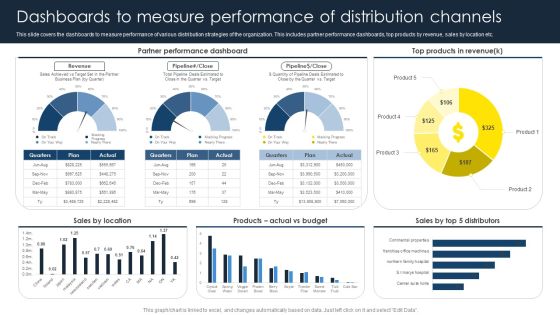
Optimize Business Sales Dashboards To Measure Performance Of Distribution Summary PDF
This slide covers the dashboards to measure performance of various distribution strategies of the organization. This includes partner performance dashboards, top products by revenue, sales by location etc. The best PPT templates are a great way to save time, energy, and resources. Slidegeeks have 100 percent editable powerpoint slides making them incredibly versatile. With these quality presentation templates, you can create a captivating and memorable presentation by combining visually appealing slides and effectively communicating your message. Download Optimize Business Sales Dashboards To Measure Performance Of Distribution Summary PDF from Slidegeeks and deliver a wonderful presentation.

Business Success PowerPoint Backgrounds And Templates 1210
Microsoft PowerPoint Template and Background with yellow measuring tape and US dollars concept how close to success in business

Website Analytics Icon For Measuring Market Revenue Ideas PDF
Presenting Website Analytics Icon For Measuring Market Revenue Ideas PDF to dispense important information. This template comprises four stages. It also presents valuable insights into the topics including Website Analytics Icon, Measuring Market Revenue. This is a completely customizable PowerPoint theme that can be put to use immediately. So, download it and address the topic impactfully.
Global Expansion Strategy Icon For Measuring Revenue Growth Professional PDF
Presenting Global Expansion Strategy Icon For Measuring Revenue Growth Professional PDF to dispense important information. This template comprises three stages. It also presents valuable insights into the topics including Global Expansion Strategy Icon, Measuring Revenue, Growth. This is a completely customizable PowerPoint theme that can be put to use immediately. So, download it and address the topic impactfully.
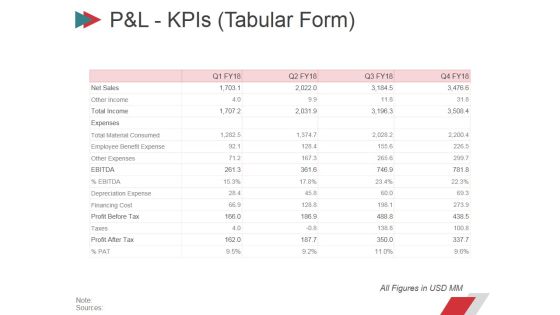
Pandl Kpis Tabular Form Ppt PowerPoint Presentation Summary Layout
This is a pandl kpis tabular form ppt powerpoint presentation summary layout. This is a four stage process. The stages in this process are revenue, cogs, operating profit, net profit.

Pandl Kpis Tabular Form Ppt PowerPoint Presentation File Design Templates
This is a pandl kpis tabular form ppt powerpoint presentation file design templates. This is a four stage process. The stages in this process are revenue, cogs, operating profit, net profit.

P And L Kpis Ppt PowerPoint Presentation Designs Download
This is a p and l kpis ppt powerpoint presentation designs download. This is a four stage process. The stages in this process are revenue, cogs, operating profit, net profit.

Dashboard Tracking Essential Kpis For Ecommerce Performance Slides PDF
This slide provides information regarding essential KPIs for ecommerce performance dashboard tracking average bounce rate, new vs. old customers, channel revenue vs. channel acquisitions costs, channel revenue vs. sales, average conversion rate, etc. Deliver an awe inspiring pitch with this creative Dashboard Tracking Essential Kpis For Ecommerce Performance Slides PDF bundle. Topics like Average Bounce Rate, Channel Acquisition Costs, Channel Revenue can be discussed with this completely editable template. It is available for immediate download depending on the needs and requirements of the user.

Analyzing Impact Of Blockchain Iot On Major Kpis Icons PDF
This slide showcases impact analysis of blockchain internet of things IoT on key performance indicators KPIs. It provides information about efficiency, security, risk, costs, business models, revenue resources, etc. Deliver an awe inspiring pitch with this creative Analyzing Impact Of Blockchain Iot On Major Kpis Icons PDF bundle. Topics like Blockchain Integration, Business Model, Revenue Sources can be discussed with this completely editable template. It is available for immediate download depending on the needs and requirements of the user.
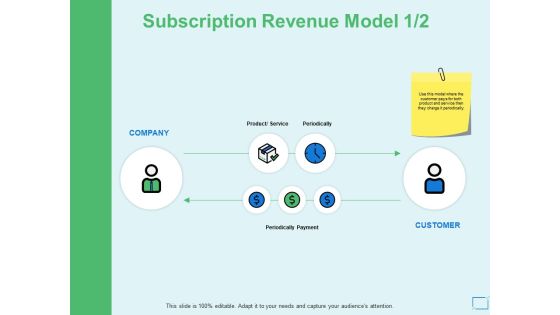
Subscription Revenue Model Measuring Ppt PowerPoint Presentation File Format
Presenting this set of slides with name subscription revenue model measuring ppt powerpoint presentation file format. The topics discussed in these slides are marketing, business, management, planning, strategy. This is a completely editable PowerPoint presentation and is available for immediate download. Download now and impress your audience.
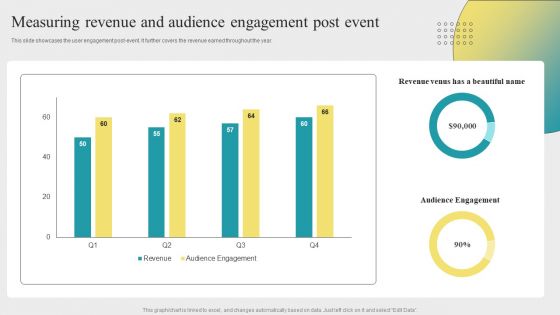
Measuring Revenue And Audience Engagement Post Event Activities Inspiration PDF
This slide showcases the user engagement post-event. It further covers the revenue earned throughout the year. Find a pre-designed and impeccable Measuring Revenue And Audience Engagement Post Event Activities Inspiration PDF. The templates can ace your presentation without additional effort. You can download these easy-to-edit presentation templates to make your presentation stand out from others. So, what are you waiting for Download the template from Slidegeeks today and give a unique touch to your presentation.

Implementing Effective Distribution Dashboards To Measure Performance Of Distribution Portrait PDF
This slide covers the dashboards to measure performance of various distribution strategies of the organization. This includes partner performance dashboards, top products by revenue, sales by location etc. Crafting an eye-catching presentation has never been more straightforward. Let your presentation shine with this tasteful yet straightforward Implementing Effective Distribution Dashboards To Measure Performance Of Distribution Portrait PDF template. It offers a minimalistic and classy look that is great for making a statement. The colors have been employed intelligently to add a bit of playfulness while still remaining professional. Construct the ideal Implementing Effective Distribution Dashboards To Measure Performance Of Distribution Portrait PDF that effortlessly grabs the attention of your audience Begin now and be certain to wow your customers
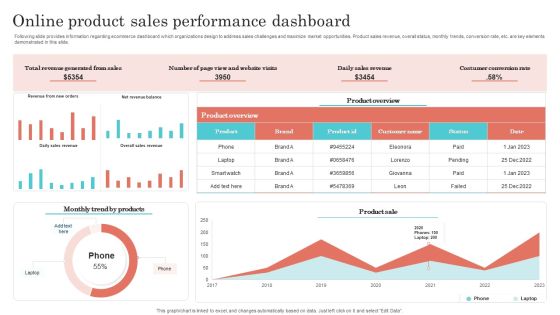
Online Product Sales Performance Dashboard Designs PDF
Following slide provides information regarding ecommerce dashboard which organizations design to address sales challenges and maximize market opportunities. Product sales revenue, overall status, monthly trends, conversion rate, etc. are key elements demonstrated in this slide. Showcasing this set of slides titled Online Product Sales Performance Dashboard Designs PDF. The topics addressed in these templates are Revenue Generated From Sales, Daily Sales Revenue, Costumer Conversion Rate. All the content presented in this PPT design is completely editable. Download it and make adjustments in color, background, font etc. as per your unique business setting.
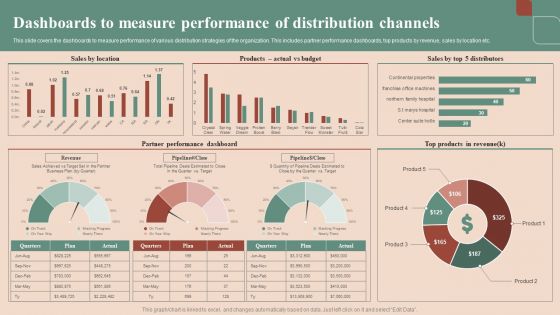
Maximizing Profit Returns With Right Distribution Source Dashboards To Measure Performance Of Distribution Channels Microsoft PDF
This slide covers the dashboards to measure performance of various distribution strategies of the organization. This includes partner performance dashboards, top products by revenue, sales by location etc. Slidegeeks is here to make your presentations a breeze with Maximizing Profit Returns With Right Distribution Source Dashboards To Measure Performance Of Distribution Channels Microsoft PDF With our easy-to-use and customizable templates, you can focus on delivering your ideas rather than worrying about formatting. With a variety of designs to choose from, youre sure to find one that suits your needs. And with animations and unique photos, illustrations, and fonts, you can make your presentation pop. So whether youre giving a sales pitch or presenting to the board, make sure to check out Slidegeeks first.
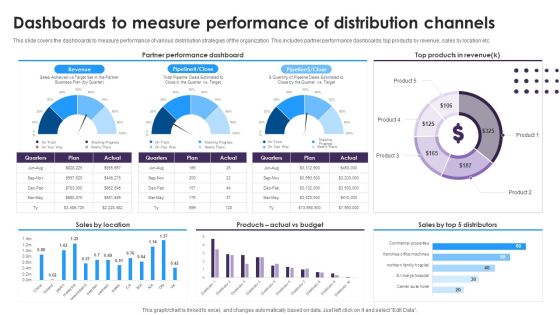
Omnichannel Distribution System To Satisfy Customer Needs Dashboards To Measure Performance Of Distribution Channels Brochure PDF
This slide covers the dashboards to measure performance of various distribution strategies of the organization. This includes partner performance dashboards, top products by revenue, sales by location etc. Present like a pro with Omnichannel Distribution System To Satisfy Customer Needs Dashboards To Measure Performance Of Distribution Channels Brochure PDF Create beautiful presentations together with your team, using our easy-to-use presentation slides. Share your ideas in real-time and make changes on the fly by downloading our templates. So whether you are in the office, on the go, or in a remote location, you can stay in sync with your team and present your ideas with confidence. With Slidegeeks presentation got a whole lot easier. Grab these presentations today.
Measuring Human Capital Ppt PowerPoint Presentation Styles Ideas Cpb
Presenting this set of slides with name measuring human capital ppt powerpoint presentation styles ideas cpb. This is a seven stage process. The stages in this process are measuring human capital. This is a completely editable PowerPoint presentation and is available for immediate download. Download now and impress your audience.
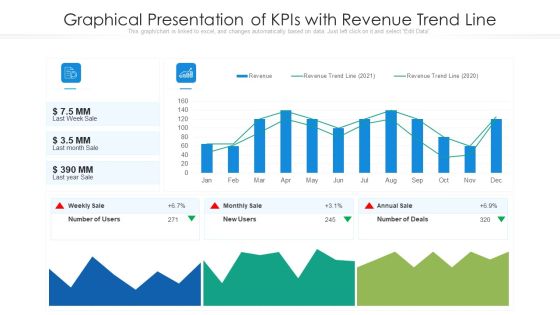
Graphical Presentation Of Kpis With Revenue Trend Line Ppt Inspiration Example Introduction PDF
Deliver and pitch your topic in the best possible manner with this graphical presentation of kpis with revenue trend line ppt inspiration example introduction pdf. Use them to share invaluable insights on graphical presentation of kpis with revenue trend line and impress your audience. This template can be altered and modified as per your expectations. So, grab it now.

Customer Success KPIS To Generate Revenue Icon Ppt PowerPoint Presentation Styles Slideshow PDF
Showcasing this set of slides titled Customer Success KPIS To Generate Revenue Icon Ppt PowerPoint Presentation Styles Slideshow PDF. The topics addressed in these templates are Customer Success, KPIs To Generate, Revenue Icon. All the content presented in this PPT design is completely editable. Download it and make adjustments in color, background, font etc. as per your unique business setting.

Dashboard Depicting Sales Kpis To Track Current Status Structure PDF
This slide shows the dashboard that depicts sales KPIs to track current status which involves won and lost opportunities, revenues and pipeline by territory, sales by different products, etc. Deliver and pitch your topic in the best possible manner with this Dashboard Depicting Sales Kpis To Track Current Status Structure PDF. Use them to share invaluable insights on Total Opportunities, Revenue By Territory, Sales By Product and impress your audience. This template can be altered and modified as per your expectations. So, grab it now.

Measuring Intellectual Capital Ppt PowerPoint Presentation Professional Visuals Cpb
Presenting this set of slides with name measuring intellectual capital ppt powerpoint presentation professional visuals cpb. This is an editable Powerpoint six stages graphic that deals with topics like measuring intellectual capital to help convey your message better graphically. This product is a premium product available for immediate download and is 100 percent editable in Powerpoint. Download this now and use it in your presentations to impress your audience.

Product Launch Goals And Performance Indicators Guidelines PDF
This slides shows table to specify measurable, observable and time specific goals such as revenue generated, subscribers gained etc. This is a product launch goals and performance indicators guidelines pdf template with various stages. Focus and dispense information on one stages using this creative set, that comes with editable features. It contains large content boxes to add your information on topics like revenue, goal, customer retention. You can also showcase facts, figures, and other relevant content using this PPT layout. Grab it now.
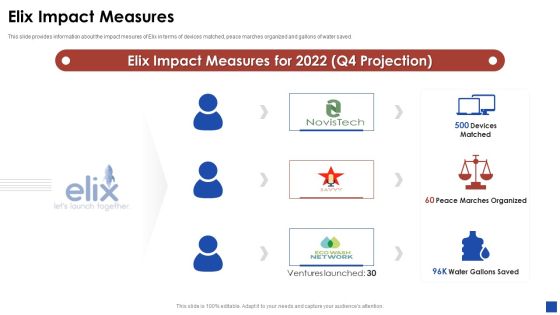
Elix Incubator Venture Capital Funding Elix Impact Measures Information PDF
This slide provides information about the impact mesures of Elix in terms of devices matched, peace marches organized and gallons of water saved. Deliver an awe inspiring pitch with this creative elix incubator venture capital funding elix impact measures information pdf bundle. Topics like elix impact measures can be discussed with this completely editable template. It is available for immediate download depending on the needs and requirements of the user.

Deal Assessment Audit Process P And L Kpis Download PDF
Deliver and pitch your topic in the best possible manner with this deal assessment audit process p and l kpis download pdf. Use them to share invaluable insights on operating profit, net profit, revenue, cogs and impress your audience. This template can be altered and modified as per your expectations. So, grab it now.

Investigation For Business Procurement Pandl Kpis Ppt Inspiration Gallery PDF
Deliver an awe-inspiring pitch with this creative investigation for business procurement pandl kpis ppt inspiration gallery pdf. bundle. Topics like revenue, cogs net profit, operating profit can be discussed with this completely editable template. It is available for immediate download depending on the needs and requirements of the user.

Monthly Company Performance Analysisp And L Kpis Brochure PDF
Deliver and pitch your topic in the best possible manner with this monthly company performance analysisp and l kpis brochure pdf. Use them to share invaluable insights on revenue, net increase in cash and impress your audience. This template can be altered and modified as per your expectations. So, grab it now.
Sales KPIS With Revenue In Last 12 Weeks Ppt PowerPoint Presentation Infographic Template Icons PDF
Presenting this set of slides with name sales kpis with revenue in last 12 weeks ppt powerpoint presentation infographic template icons pdf. The topics discussed in these slides are sales growth, current period, previous period, sales revenue, sales representative, last 12 weeks. This is a completely editable PowerPoint presentation and is available for immediate download. Download now and impress your audience.

Program Management Kpis With Revenue Breakdown Ppt PowerPoint Presentation File Format Ideas PDF
Presenting this set of slides with name program management kpis with revenue breakdown ppt powerpoint presentation file format ideas pdf. The topics discussed in these slides are revenue, market, goal. This is a completely editable PowerPoint presentation and is available for immediate download. Download now and impress your audience.

Quarterly Sales Team Performance Analysis Kpis Slides PDF
The following slide depicts the efforts made my sales team in increasing companys growth. It also includes KPAs such as new customers acquired, sales, profit, average revenue per unit, customer lifetime value, acquisition cost etc. Showcasing this set of slides titled Quarterly Sales Team Performance Analysis Kpis Slides PDF. The topics addressed in these templates are Above Sales Target, Average Sales Revenue, Average Customer. All the content presented in this PPT design is completely editable. Download it and make adjustments in color, background, font etc. as per your unique business setting.
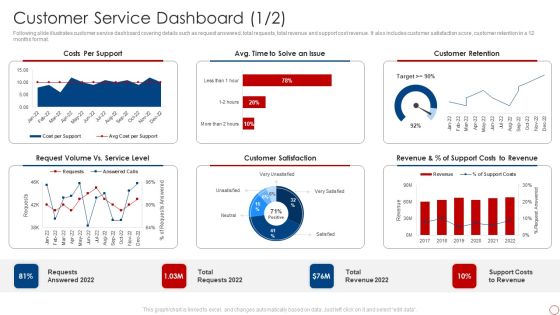
Kpis For Evaluating Business Sustainability Customer Service Dashboard Designs PDF
Following slide illustrates customer service dashboard covering details such as request answered, total requests, total revenue and support cost revenue. It also includes customer satisfaction score, customer retention in a 12 months format. Deliver and pitch your topic in the best possible manner with this Kpis For Evaluating Business Sustainability Customer Service Dashboard Designs PDF. Use them to share invaluable insights on Costs Per Support, Customer Retention, Customer Satisfaction and impress your audience. This template can be altered and modified as per your expectations. So, grab it now.

Kpis For Evaluating Business Sustainability Short Term Goals Infographics PDF
This slide covers the short term goals set by the firm for FY22. Goals covered are to capture competitors market share, reduce churn rate, increase sales revenue and to invest in CSR activities. This is a Kpis For Evaluating Business Sustainability Short Term Goals Infographics PDF template with various stages. Focus and dispense information on five stages using this creative set, that comes with editable features. It contains large content boxes to add your information on topics like Market Share, Reduce Customer Churn, Sales Revenue. You can also showcase facts, figures, and other relevant content using this PPT layout. Grab it now.
Product Sales Kpis With Website Traffic Ppt Icon Smartart
This slide showcase different strategies through which product is marketize to increase the product reach to the consumer and increase the market share. It includes total product revenue, sales comparison of online and in store sales, marketing campaigning and website traffic. Showcasing this set of slides titled Product Sales Kpis With Website Traffic Ppt Icon Smartart. The topics addressed in these templates are Website Traffic, Product Sales Increment, Total Product Revenue. All the content presented in this PPT design is completely editable. Download it and make adjustments in color, background, font etc. as per your unique business setting.

Sales Product Cycle Length Kpis Ppt Pictures Aids PDF
This slide shows the life cycle of a product and consumer acquisition in 2023. it comprises average revenue per unit, goal sales, consumer acquisition costs, and quarterly sales. Showcasing this set of slides titled Sales Product Cycle Length Kpis Ppt Pictures Aids PDF. The topics addressed in these templates are Product Value, Consumer Acquisition Cost, Average Revenue, Per Unit. All the content presented in this PPT design is completely editable. Download it and make adjustments in color, background, font etc. as per your unique business setting.
 Home
Home