Financial Metrics

Business To Business Sales Playbook Metrices To Track Sales Team Performance Elements PDF
This slide provides information regarding various metrics catered to track sales team performance in terms of average revenue per account, win rate, NPS, along with sales representative performance tracking through number of opportunities created, lead response time, etc. Deliver an awe inspiring pitch with this creative business to business sales playbook metrices to track sales team performance elements pdf bundle. Topics like metrices to track sales team performance can be discussed with this completely editable template. It is available for immediate download depending on the needs and requirements of the user.

B2B Customers Journey Playbook Metrices To Track Sales Team Performance Professional PDF
This slide provides information regarding various metrics catered to track sales team performance in terms of average revenue per account, win rate, NPS, along with sales representative performance tracking through number of opportunities created, lead response time, etc. Presenting b2b customers journey playbook metrices to track sales team performance professional pdf to provide visual cues and insights. Share and navigate important information on fivestages that need your due attention. This template can be used to pitch topics like metrices to track sales team performance. In addtion, this PPT design contains high resolution images, graphics, etc, that are easily editable and available for immediate download.
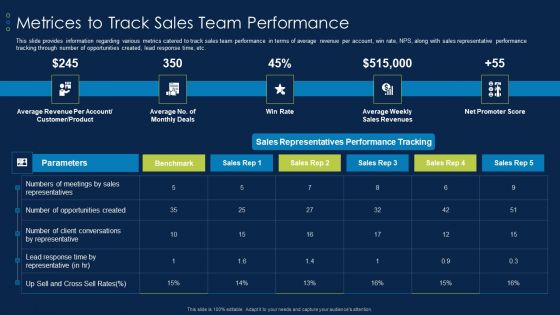
Business To Business Account Metrices To Track Sales Team Performance Background PDF
This slide provides information regarding various metrics catered to track sales team performance in terms of average revenue per account, win rate, NPS, along with sales representative performance tracking through number of opportunities created, lead response time, etc. Deliver an awe inspiring pitch with this creative Business To Business Account Metrices To Track Sales Team Performance Background PDF bundle. Topics like Average Revenue Per Account, Customer, Product, Sales Representatives Performance Tracking can be discussed with this completely editable template. It is available for immediate download depending on the needs and requirements of the user.
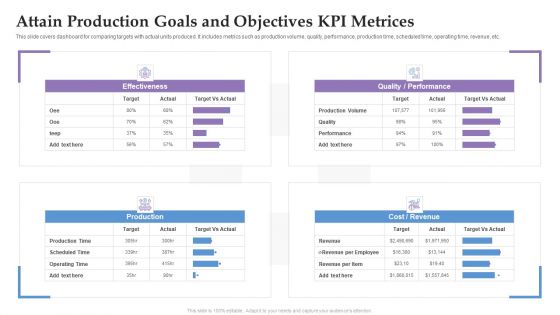
Attain Production Goals And Objectives KPI Metrices Ppt Summary Format Ideas PDF
This slide covers dashboard for comparing targets with actual units produced. It includes metrics such as production volume, quality, performance, production time, scheduled time, operating time, revenue, etc. Pitch your topic with ease and precision using this Attain Production Goals And Objectives KPI Metrices Ppt Summary Format Ideas PDF. This layout presents information on Production, Cost, Revenue, Performance. It is also available for immediate download and adjustment. So, changes can be made in the color, design, graphics or any other component to create a unique layout.
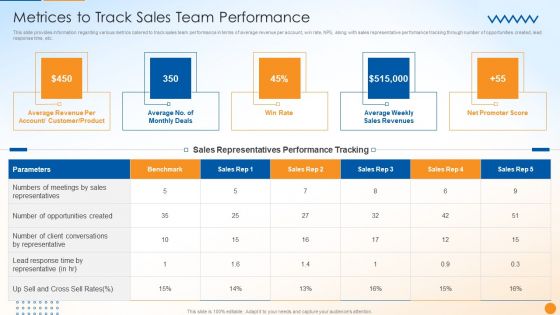
B2B Sales Techniques Playbook Metrices To Track Sales Team Performance Formats PDF
This slide provides information regarding various metrics catered to track sales team performance in terms of average revenue per account, win rate, NPS, along with sales representative performance tracking through number of opportunities created, lead response time, etc. Presenting B2B Sales Techniques Playbook Metrices To Track Sales Team Performance Formats PDF to provide visual cues and insights. Share and navigate important information on four stages that need your due attention. This template can be used to pitch topics like Conversations Representative, Opportunities Created, Sales Revenues. In addtion, this PPT design contains high resolution images, graphics, etc, that are easily editable and available for immediate download.
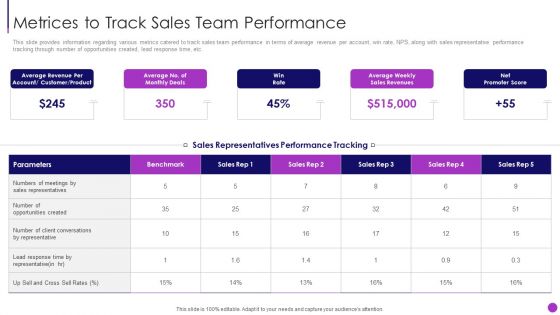
Business To Business Sales Management Playbook Metrices To Track Sales Team Performance Diagrams PDF
This slide provides information regarding various metrics catered to track sales team performance in terms of average revenue per account, win rate, NPS, along with sales representative performance tracking through number of opportunities created, lead response time, etc.Deliver an awe inspiring pitch with this creative Business To Business Sales Management Playbook Metrices To Track Sales Team Performance Diagrams PDF bundle. Topics like Sales Representatives, Client Conversations, Lead Response can be discussed with this completely editable template. It is available for immediate download depending on the needs and requirements of the user.

Instructions Playbook For B2B Sales Executive Metrices To Track Sales Team Performance Information PDF
This slide provides information regarding various metrics catered to track sales team performance in terms of average revenue per account, win rate, NPS, along with sales representative performance tracking through number of opportunities created, lead response time, etc. Deliver an awe inspiring pitch with this creative Instructions Playbook For B2B Sales Executive Metrices To Track Sales Team Performance Information PDF bundle. Topics like Sales Representatives, Opportunities Created, Lead Response can be discussed with this completely editable template. It is available for immediate download depending on the needs and requirements of the user.

Periodic Revenue Model Key Metrices For Forecasting In Recurring Revenue Model Portrait PDF
The purpose of the following slide is to display various metrices that can be used to forecast the performance of recurring revenue model. These metrices can be Annual recurring revenue, Customer churn rate, customer lifetime value, account expansion and contraction. Find a pre designed and impeccable Periodic Revenue Model Key Metrices For Forecasting In Recurring Revenue Model Portrait PDF. The templates can ace your presentation without additional effort. You can download these easy to edit presentation templates to make your presentation stand out from others. So, what are you waiting for Download the template from Slidegeeks today and give a unique touch to your presentation.

Membership Based Revenue Plan Key Metrices For Forecasting In Recurring Revenue Model Mockup PDF
The purpose of the following slide is to display various metrices that can be used to forecast the performance of recurring revenue model. These metrices can be Annual recurring revenue, Customer churn rate, customer lifetime value, account expansion and contraction. Find highly impressive Membership Based Revenue Plan Key Metrices For Forecasting In Recurring Revenue Model Mockup PDF on Slidegeeks to deliver a meaningful presentation. You can save an ample amount of time using these presentation templates. No need to worry to prepare everything from scratch because Slidegeeks experts have already done a huge research and work for you. You need to download Membership Based Revenue Plan Key Metrices For Forecasting In Recurring Revenue Model Mockup PDF for your upcoming presentation. All the presentation templates are 100 percent editable and you can change the color and personalize the content accordingly. Download now

Deploying And Managing Recurring Key Metrices For Forecasting In Recurring Revenue Professional PDF
The purpose of the following slide is to display various metrices that can be used to forecast the performance of recurring revenue model. These metrices can be Annual recurring revenue, Customer churn rate, customer lifetime value, account expansion and contraction. Whether you have daily or monthly meetings, a brilliant presentation is necessary. Deploying And Managing Recurring Key Metrices For Forecasting In Recurring Revenue Professional PDF can be your best option for delivering a presentation. Represent everything in detail using Deploying And Managing Recurring Key Metrices For Forecasting In Recurring Revenue Professional PDF and make yourself stand out in meetings. The template is versatile and follows a structure that will cater to your requirements. All the templates prepared by Slidegeeks are easy to download and edit. Our research experts have taken care of the corporate themes as well. So, give it a try and see the results.
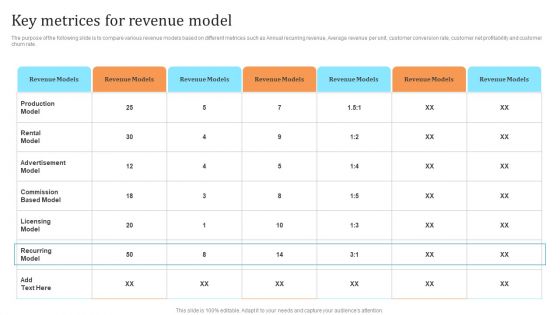
Membership Based Revenue Plan Key Metrices For Revenue Model Inspiration PDF
The purpose of the following slide is to compare various revenue models based on different metrices such as Annual recurring revenue, Average revenue per unit, customer conversion rate, customer net profitability and customer churn rate. If your project calls for a presentation, then Slidegeeks is your go-to partner because we have professionally designed, easy-to-edit templates that are perfect for any presentation. After downloading, you can easily edit Membership Based Revenue Plan Key Metrices For Revenue Model Inspiration PDF and make the changes accordingly. You can rearrange slides or fill them with different images. Check out all the handy templates

Saas Continuous Income Generation Model For Software Startup Key Metrices For Forecasting In Recurring Slides PDF
The purpose of the following slide is to display various metrices that can be used to forecast the performance of recurring revenue model. These metrices can be Annual recurring revenue, Customer churn rate, customer lifetime value, account expansion and contraction. Do you have to make sure that everyone on your team knows about any specific topic I yes, then you should give Saas Continuous Income Generation Model For Software Startup Key Metrices For Forecasting In Recurring Slides PDF a try. Our experts have put a lot of knowledge and effort into creating this impeccable Saas Continuous Income Generation Model For Software Startup Key Metrices For Forecasting In Recurring Slides PDF. You can use this template for your upcoming presentations, as the slides are perfect to represent even the tiniest detail. You can download these templates from the Slidegeeks website and these are easy to edit. So grab these today.
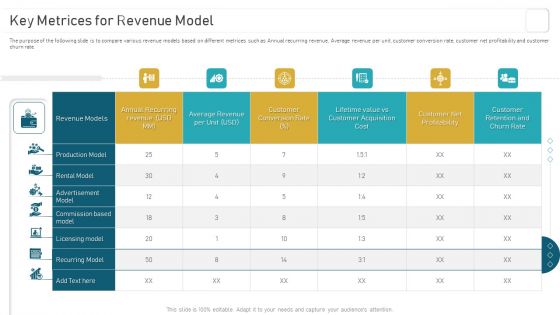
Deploying And Managing Recurring Key Metrices For Revenue Model Pictures PDF
The purpose of the following slide is to compare various revenue models based on different metrices such as Annual recurring revenue, Average revenue per unit, customer conversion rate, customer net profitability and customer churn rate. Find highly impressive Deploying And Managing Recurring Key Metrices For Revenue Model Pictures PDF on Slidegeeks to deliver a meaningful presentation. You can save an ample amount of time using these presentation templates. No need to worry to prepare everything from scratch because Slidegeeks experts have already done a huge research and work for you. You need to download Deploying And Managing Recurring Key Metrices For Revenue Model Pictures PDF for your upcoming presentation. All the presentation templates are 100 percent editable and you can change the color and personalize the content accordingly. Download now.
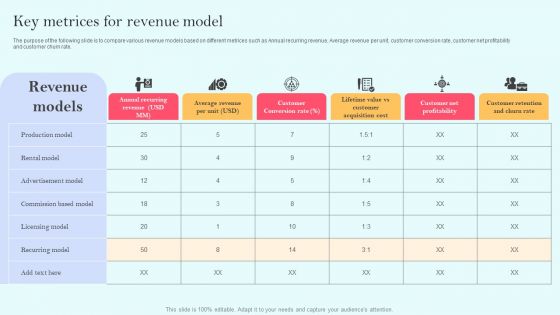
Recurring Income Generation Model Key Metrices For Revenue Model Pictures PDF
The purpose of the following slide is to compare various revenue models based on different metrices such as Annual recurring revenue, Average revenue per unit, customer conversion rate, customer net profitability and customer churn rate. This Recurring Income Generation Model Key Metrices For Revenue Model Pictures PDF is perfect for any presentation, be it in front of clients or colleagues. It is a versatile and stylish solution for organizing your meetings. The Recurring Income Generation Model Key Metrices For Revenue Model Pictures PDF features a modern design for your presentation meetings. The adjustable and customizable slides provide unlimited possibilities for acing up your presentation. Slidegeeks has done all the homework before launching the product for you. So, do not wait, grab the presentation templates today
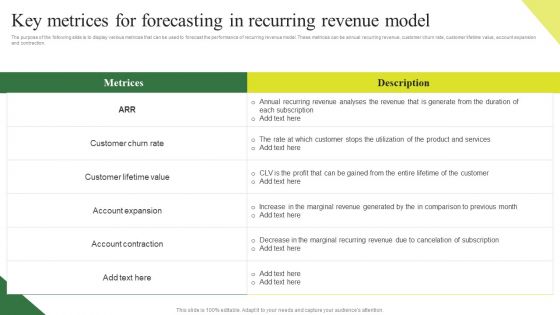
Consumption Based Pricing Model Key Metrices For Forecasting In Recurring Revenue Model Clipart PDF
The purpose of the following slide is to display various metrices that can be used to forecast the performance of recurring revenue model. These metrices can be annual recurring revenue, customer churn rate, customer lifetime value, account expansion and contraction. Coming up with a presentation necessitates that the majority of the effort goes into the content and the message you intend to convey. The visuals of a PowerPoint presentation can only be effective if it supplements and supports the story that is being told. Keeping this in mind our experts created Consumption Based Pricing Model Key Metrices For Forecasting In Recurring Revenue Model Clipart PDF to reduce the time that goes into designing the presentation. This way, you can concentrate on the message while our designers take care of providing you with the right template for the situation.
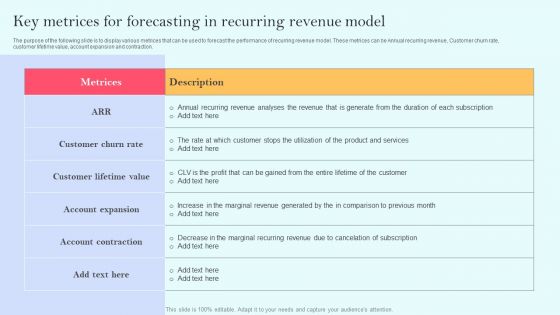
Recurring Income Generation Model Key Metrices For Forecasting In Recurring Revenue Model Summary PDF
The purpose of the following slide is to display various metrices that can be used to forecast the performance of recurring revenue model. These metrices can be Annual recurring revenue, Customer churn rate, customer lifetime value, account expansion and contraction. This modern and well arranged Recurring Income Generation Model Key Metrices For Forecasting In Recurring Revenue Model Summary PDF provides lots of creative possibilities. It is very simple to customize and edit with the Powerpoint Software. Just drag and drop your pictures into the shapes. All facets of this template can be edited with Powerpoint no extra software is necessary. Add your own material, put your images in the places assigned for them, adjust the colors, and then you can show your slides to the world, with an animated slide included.
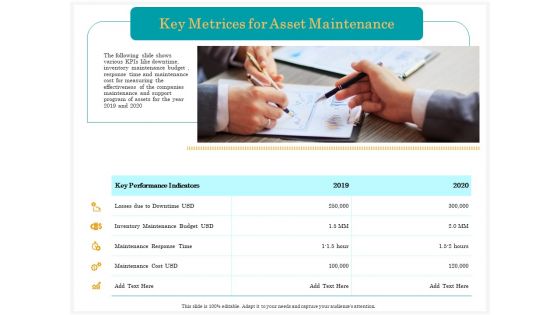
Application Life Cycle Analysis Capital Assets Key Metrices For Asset Maintenance Guidelines PDF
Presenting this set of slides with name application life cycle analysis capital assets key metrices for asset maintenance guidelines pdf. This is a five stage process. The stages in this process are inventory, maintenance, budget, cost. This is a completely editable PowerPoint presentation and is available for immediate download. Download now and impress your audience.
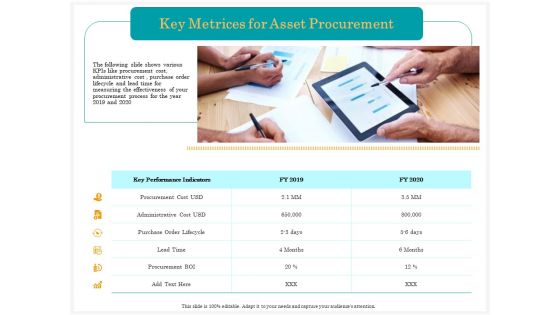
Application Life Cycle Analysis Capital Assets Key Metrices For Asset Procurement Professional PDF
Presenting this set of slides with name application life cycle analysis capital assets key metrices for asset procurement professional pdf. This is a six stage process. The stages in this process are procurement, cost, administrative, lifecycle. This is a completely editable PowerPoint presentation and is available for immediate download. Download now and impress your audience.

Consumption Based Pricing Model Key Metrices For Revenue Model Elements PDF
The purpose of the following slide is to compare various revenue models based on different metrices such as annual recurring revenue, average revenue per unit, customer conversion rate, customer net profitability and customer churn rate. This modern and well arranged Consumption Based Pricing Model Key Metrices For Forecasting In Recurring Revenue Model Clipart PDF provides lots of creative possibilities. It is very simple to customize and edit with the Powerpoint Software. Just drag and drop your pictures into the shapes. All facets of this template can be edited with Powerpoint no extra software is necessary. Add your own material, put your images in the places assigned for them, adjust the colors, and then you can show your slides to the world, with an animated slide included.
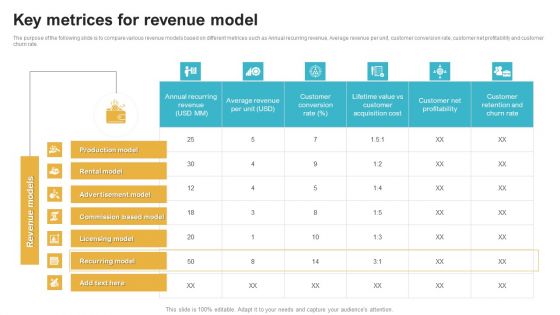
Saas Continuous Income Generation Model For Software Startup Key Metrices For Revenue Model Introduction PDF
The purpose of the following slide is to compare various revenue models based on different metrices such as Annual recurring revenue, Average revenue per unit, customer conversion rate, customer net profitability and customer churn rate. This modern and well arranged Saas Continuous Income Generation Model For Software Startup Key Metrices For Revenue Model Introduction PDF provides lots of creative possibilities. It is very simple to customize and edit with the Powerpoint Software. Just drag and drop your pictures into the shapes. All facets of this template can be edited with Powerpoint no extra software is necessary. Add your own material, put your images in the places assigned for them, adjust the colors, and then you can show your slides to the world, with an animated slide included.
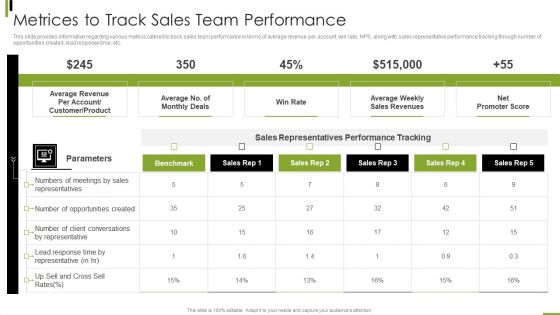
B2B Sales Framework Playbook Metrices To Track Sales Team Performance Template PDF
Deliver and pitch your topic in the best possible manner with this B2B Sales Framework Playbook Metrices To Track Sales Team Performance Template PDF. Use them to share invaluable insights on Average Revenue, Sales Representatives Performance, Opportunities Created and impress your audience. This template can be altered and modified as per your expectations. So, grab it now.

Strategy For Managing Ecommerce Returns Reverse Logistics Dashboard Days Template PDF
Deliver an awe inspiring pitch with this creative strategy for managing ecommerce returns reverse logistics dashboard days template pdf bundle. Topics like global, financial, performance, metric, inventory can be discussed with this completely editable template. It is available for immediate download depending on the needs and requirements of the user.
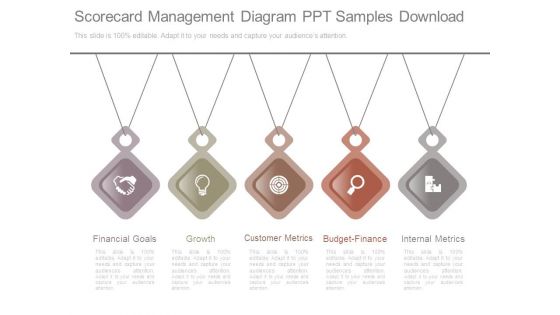
Scorecard Management Diagram Ppt Samples Download
This is a scorecard management diagram ppt samples download. This is a five stage process. The stages in this process are financial goals, growth, customer metrics, budget finance, internal metrics.
Company Financials Performance Tracking Dashboard Brochure PDF
This slide illustrates KPI dashboard that can be used by organizations to track their financial performance on company basis. Kpis covered in the slide are contract status, revenue, cost of goods, overdue and task status. Showcasing this set of slides titled Company Financials Performance Tracking Dashboard Brochure PDF. The topics addressed in these templates are Report Shortcut, Revenue Cost, Overdue Task. All the content presented in this PPT design is completely editable. Download it and make adjustments in color, background, font etc. as per your unique business setting.

League Tables In Islamic Debt Comprehensive Guide Islamic Pictures PDF
This slide covers the details related to the league tables in Islamic debt used for ranking companies based on Islamic financial metrics. It includes details related to the league tables are an important tool for financial institutions to showcase their expertise and success in the Islamic finance industry. Want to ace your presentation in front of a live audience Our League Tables In Islamic Debt Comprehensive Guide Islamic Pictures PDF can help you do that by engaging all the users towards you. Slidegeeks experts have put their efforts and expertise into creating these impeccable powerpoint presentations so that you can communicate your ideas clearly. Moreover, all the templates are customizable, and easy-to-edit and downloadable. Use these for both personal and commercial use.
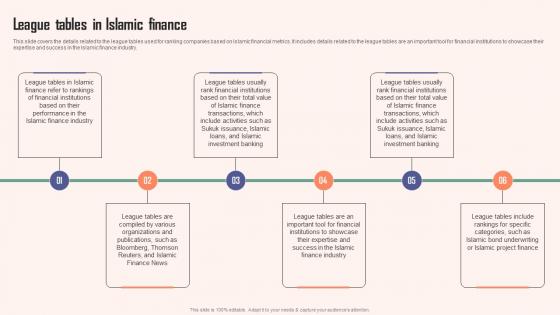
League Tables In Islamic Finance Comprehensive Guide Islamic Inspiration PDF
This slide covers the details related to the league tables used for ranking companies based on Islamic financial metrics. It includes details related to the league tables are an important tool for financial institutions to showcase their expertise and success in the Islamic finance industry. Do you have to make sure that everyone on your team knows about any specific topic I yes, then you should give League Tables In Islamic Finance Comprehensive Guide Islamic Inspiration PDF a try. Our experts have put a lot of knowledge and effort into creating this impeccable League Tables In Islamic Finance Comprehensive Guide Islamic Inspiration PDF. You can use this template for your upcoming presentations, as the slides are perfect to represent even the tiniest detail. You can download these templates from the Slidegeeks website and these are easy to edit. So grab these today
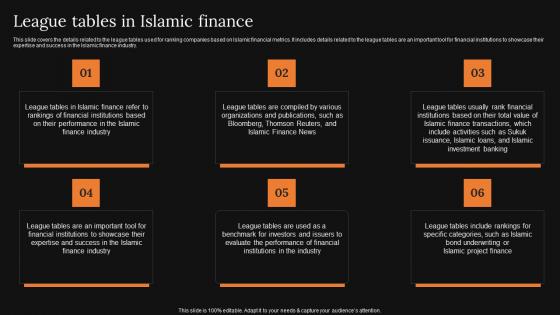
League Tables In Islamic Finance A Detailed Knowledge Of Islamic Finance Structure Pdf
This slide covers the details related to the league tables used for ranking companies based on Islamic financial metrics. It includes details related to the league tables are an important tool for financial institutions to showcase their expertise and success in the Islamic finance industry. This League Tables In Islamic Finance A Detailed Knowledge Of Islamic Finance Structure Pdf from Slidegeeks makes it easy to present information on your topic with precision. It provides customization options, so you can make changes to the colors, design, graphics, or any other component to create a unique layout. It is also available for immediate download, so you can begin using it right away. Slidegeeks has done good research to ensure that you have everything you need to make your presentation stand out. Make a name out there for a brilliant performance.
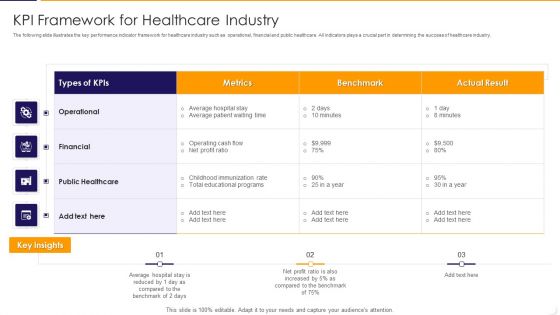
KPI Framework For Healthcare Industry Ppt PowerPoint Presentation Gallery Example PDF
Showcasing this set of slides titled kpi framework for healthcare industry ppt powerpoint presentation gallery example pdf The topics addressed in these templates are financial, profit ratio, metrics All the content presented in this PPT design is completely editable. Download it and make adjustments in color, background, font etc. as per your unique business setting.

Drivers For Measuring Brand Reinforcement Encouraging Repetitive Customer Purchase Ppt Slide
This slide showcases core drivers to measure brand reinforcement. This template focuses on building relationship between perceived costs and benefits related to products. It includes information related to financial metrics, consumer purchasing behaviour, etc. Slidegeeks is here to make your presentations a breeze with Drivers For Measuring Brand Reinforcement Encouraging Repetitive Customer Purchase Ppt Slide With our easy-to-use and customizable templates, you can focus on delivering your ideas rather than worrying about formatting. With a variety of designs to choose from, you are sure to find one that suits your needs. And with animations and unique photos, illustrations, and fonts, you can make your presentation pop. So whether you are giving a sales pitch or presenting to the board, make sure to check out Slidegeeks first
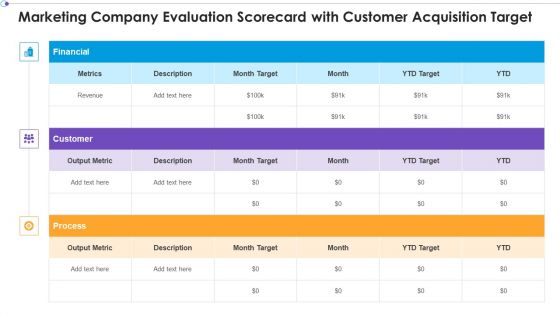
Marketing Business Assessment Scorecard Marketing Company Evaluation Scorecard With Customer Ideas PDF
Deliver an awe inspiring pitch with this creative Marketing Business Assessment Scorecard Marketing Company Evaluation Scorecard With Customer Ideas PDF bundle. Topics like Financial Customer, Output Metric, Month Target can be discussed with this completely editable template. It is available for immediate download depending on the needs and requirements of the user.

Grubhub Fund Raising Elevator Table Of Contents Rules PDF
This is a grubhub fund raising elevator table of contents rules pdf template with various stages. Focus and dispense information on four stages using this creative set, that comes with editable features. It contains large content boxes to add your information on topics like company overview, financials, economics, metrics, growth. You can also showcase facts, figures, and other relevant content using this PPT layout. Grab it now.
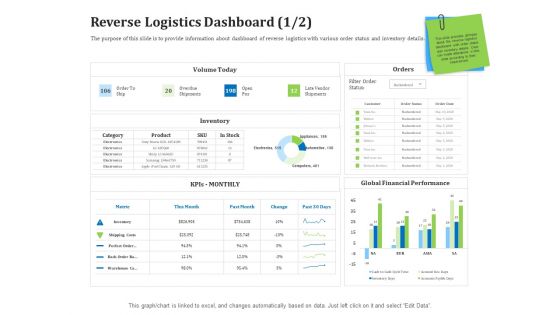
Reverse Logistics Management Reverse Logistics Dashboard Days Ppt Infographics Files PDF
The purpose of this slide is to provide information about dashboard of reverse logistics with various order status and inventory details. Deliver an awe inspiring pitch with this creative reverse logistics management reverse logistics dashboard days ppt infographics files pdf bundle. Topics like global, financial, performance, metric, inventory can be discussed with this completely editable template. It is available for immediate download depending on the needs and requirements of the user.
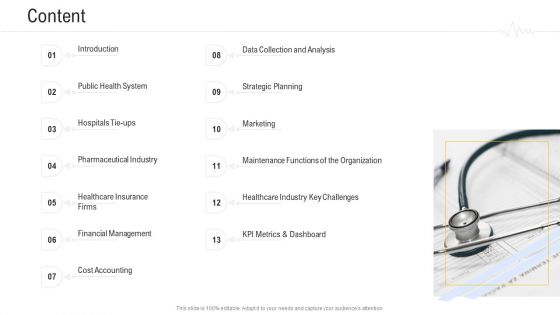
Hospital Management System Content Summary PDF
Deliver an awe inspiring pitch with this creative hospital management system content summary pdf bundle. Topics like strategic planning marketing, financial management, cost accounting, kpi metrics and dashboard can be discussed with this completely editable template. It is available for immediate download depending on the needs and requirements of the user.

Organization Level Kpis Diagram Powerpoint Layout
This is a organization level kpis diagram powerpoint layout. This is a nine stage process. The stages in this process are goals and objectives, critical success, factors, kpis, metrics, measures, corporate, financials, tactical functional.
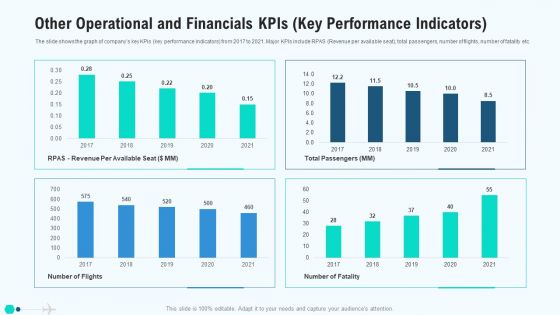
Other Operational And Financials Kpis Key Performance Indicators Clipart PDF
The slide shows the graph of companys key KPIs key performance indicators from 2017 to 2021. Major KPIs include RPAS Revenue per available seat, total passengers, number of flights, number of fatality etc. Deliver an awe inspiring pitch with this creative other operational and financials kpis key performance indicators clipart pdf bundle. Topics like other operational and financials kpis key performance indicators can be discussed with this completely editable template. It is available for immediate download depending on the needs and requirements of the user.

Other Operational And Financials Kpis Key Performance Indicators Professional PDF
The slide shows the graph of companys key KPIs key performance indicators from 2016 to 2020. Major KPIs include RPAS Revenue per available seat, total passengers, number of flights, number of fatality etc. Deliver an awe-inspiring pitch with this creative other operational and financials kpis key performance indicators professional pdf bundle. Topics like other operational and financials kpis key performance indicators can be discussed with this completely editable template. It is available for immediate download depending on the needs and requirements of the user.

Other Operational And Financials Kpis Key Performance Indicators Ideas PDF
The slide shows the graph of companys key KPIs key performance indicators from 2016 to 2020. Major KPIs include RPAS Revenue per available seat, total passengers, number of flights, number of fatality etc. Deliver an awe inspiring pitch with this creative other operational and financials kpis key performance indicators ideas pdf bundle. Topics like other operational and financials kpis key performance indicators can be discussed with this completely editable template. It is available for immediate download depending on the needs and requirements of the user.
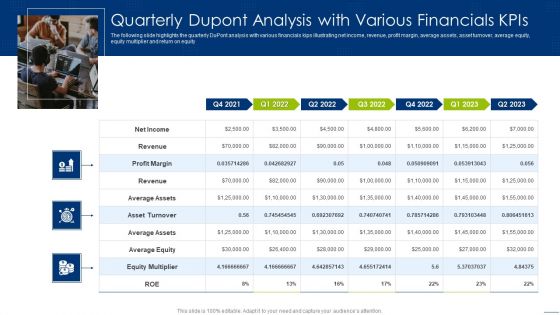
Quarterly Dupont Analysis With Various Financials Kpis Mockup PDF
Pitch your topic with ease and precision using this Quarterly Dupont Analysis With Various Financials Kpis Mockup PDF. This layout presents information on Revenue, Average Assets, Average Equity. It is also available for immediate download and adjustment. So, changes can be made in the color, design, graphics or any other component to create a unique layout.
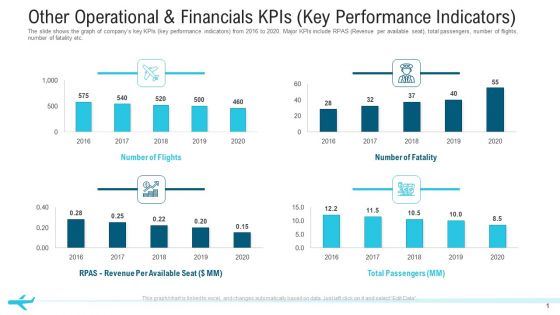
Other Operational And Financials Kpis Key Performance Indicators Structure PDF
The slide shows the graph of companys key KPIs key performance indicators from 2016 to 2020. Major KPIs include RPAS Revenue per available seat, total passengers, number of flights, number of fatality etc.Deliver an awe-inspiring pitch with this creative other operational and financials KPIs key performance indicators structure pdf. bundle. Topics like total passengers, number of flights,2016 to 2020 can be discussed with this completely editable template. It is available for immediate download depending on the needs and requirements of the user.
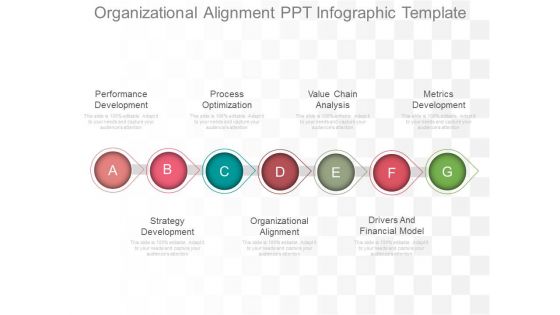
Organizational Alignment Ppt Infographic Template
This is a organizational alignment ppt infographic template. This is a seven stage process. The stages in this process are performance development, process optimization, value chain analysis, metrics development, strategy development, organizational alignment, drivers and financial model.

Service Business Plan Example Powerpoint Ideas
This is a service business plan example powerpoint ideas. This is a nine stage process. The stages in this process are business plan, product or service, marketing plan, financial plan, key management, focused strategy, investors, metrics.
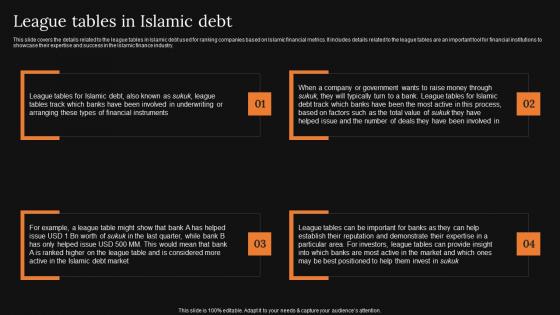
League Tables In Islamic Debt A Detailed Knowledge Of Islamic Finance Demonstration Pdf
This slide covers the details related to the league tables in Islamic debt used for ranking companies based on Islamic financial metrics. It includes details related to the league tables are an important tool for financial institutions to showcase their expertise and success in the Islamic finance industry. Presenting this PowerPoint presentation, titled League Tables In Islamic Debt A Detailed Knowledge Of Islamic Finance Demonstration Pdf, with topics curated by our researchers after extensive research. This editable presentation is available for immediate download and provides attractive features when used. Download now and captivate your audience. Presenting this League Tables In Islamic Debt A Detailed Knowledge Of Islamic Finance Demonstration Pdf. Our researchers have carefully researched and created these slides with all aspects taken into consideration. This is a completely customizable League Tables In Islamic Debt A Detailed Knowledge Of Islamic Finance Demonstration Pdf that is available for immediate downloading. Download now and make an impact on your audience. Highlight the attractive features available with our PPTs.
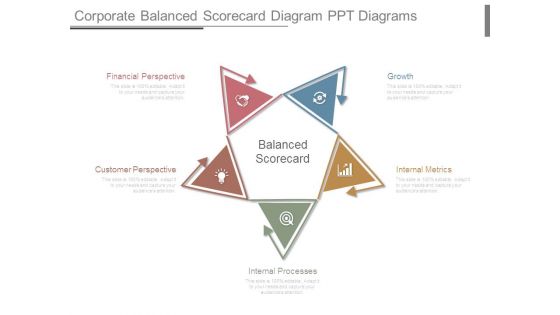
Corporate Balanced Scorecard Diagram Ppt Diagrams
This is a corporate balanced scorecard diagram ppt diagrams. This is a five stage process. The stages in this process are financial perspective, customer perspective, internal processes, growth, internal metrics, balanced scorecard.
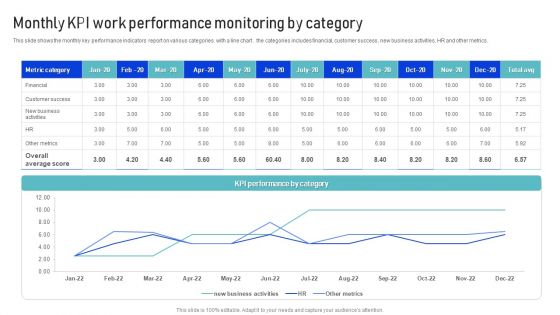
Monthly KPI Work Performance Monitoring By Category Microsoft PDF
This slide shows the monthly key performance indicators report on various categories with a line chart . the categories includes financial, customer success , new business activities, HR and other metrics. Pitch your topic with ease and precision using this Monthly KPI Work Performance Monitoring By Category Microsoft PDF. This layout presents information on Metrics, Financial, Customer Success. It is also available for immediate download and adjustment. So, changes can be made in the color, design, graphics or any other component to create a unique layout.

Matrix For Retirement Considerations And Options Ratings Infographics PDF
This slide illustrates decision making and ratings table regarding individual retirement. It includes metrics like personal health, financial health, family, age etc. Showcasing this set of slides titled Matrix For Retirement Considerations And Options Ratings Infographics PDF. The topics addressed in these templates are Personal Health, Financial Health, Family. All the content presented in this PPT design is completely editable. Download it and make adjustments in color, background, font etc. as per your unique business setting.
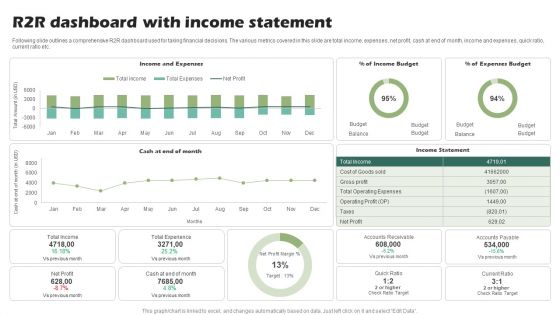
R2R Dashboard With Income Statement Ppt PowerPoint Presentation Show Slide Download PDF
Following slide outlines a comprehensive R2R dashboard used for taking financial decisions. The various metrics covered in this slide are total income, expenses, net profit, cash at end of month, income and expenses, quick ratio, current ratio etc.Showcasing this set of slides titled R2R Dashboard With Income Statement Ppt PowerPoint Presentation Show Slide Download PDF. The topics addressed in these templates are Operating Expenses, Total Experience, Accounts Receivable. All the content presented in this PPT design is completely editable. Download it and make adjustments in color, background, font etc. as per your unique business setting.
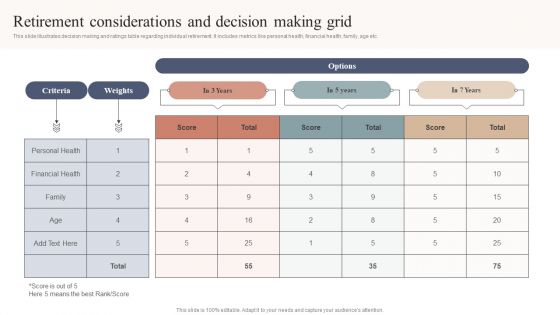
Retirement Considerations And Decision Making Grid Information PDF
This slide illustrates decision making and ratings table regarding individual retirement. It includes metrics like personal health, financial health, family, age etc. Showcasing this set of slides titled Retirement Considerations And Decision Making Grid Information PDF. The topics addressed in these templates are Retirement Considerations, Decision Making Grid. All the content presented in this PPT design is completely editable. Download it and make adjustments in color, background, font etc. as per your unique business setting.
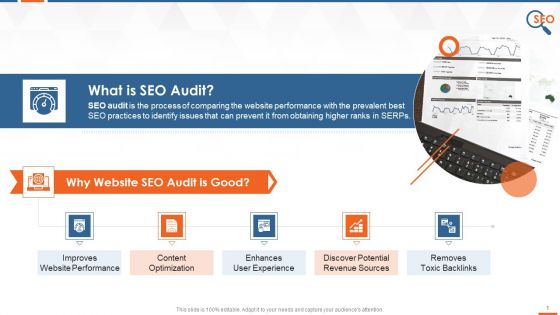
What Is SEO Audit And Its Significance Training Ppt
This slide provides information regarding the SEO audit. It also covers details of its importance in improving website performance, content optimization, enhancing user experience, discovering potential revenue sources, and removing toxic backlinks.
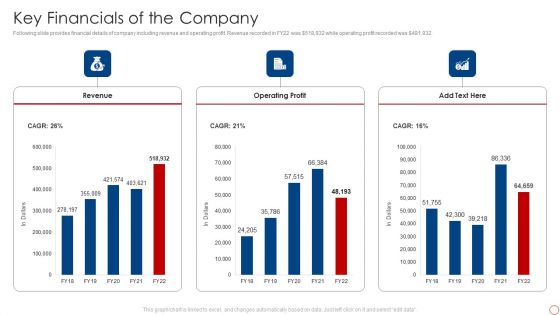
Kpis For Evaluating Business Sustainability Key Financials Of The Company Rules PDF
Following slide provides financial details of company including revenue and operating profit. Revenue recorded in FY22 was dollar 518,932 while operating profit recorded was dollar 481,932. Deliver and pitch your topic in the best possible manner with this Kpis For Evaluating Business Sustainability Financial Performance Indicator Dashboard Demonstration PDF. Use them to share invaluable insights on Revenue, Operating Profit and impress your audience. This template can be altered and modified as per your expectations. So, grab it now.
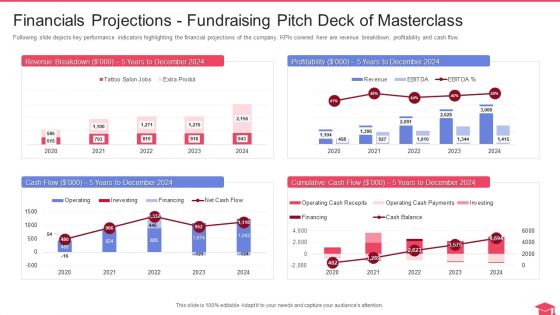
Fundraising Pitch Deck Of Masterclass Financials Projections Fundraising Pitch Deck Of Masterclass Elements PDF
Following slide depicts key performance indicators highlighting the financial projections of the company. KPIs covered here are revenue breakdown, profitability and cash flow. Deliver and pitch your topic in the best possible manner with this fundraising pitch deck of masterclass financials projections fundraising pitch deck of masterclass elements pdf. Use them to share invaluable insights on financials projections fundraising pitch deck of masterclass and impress your audience. This template can be altered and modified as per your expectations. So, grab it now.

Financials Projections Masterclass Investor Fund Raising Elevator Pitch Deck Mockup PDF
Following slide depicts key performance indicators highlighting the financial projections of the company. KPIs covered here are revenue breakdown, profitability and cash flow.Deliver an awe inspiring pitch with this creative Financials Projections Masterclass Investor Fund Raising Elevator Pitch Deck Mockup PDF bundle. Topics like Cumulative Cash, Profitability, Revenue Breakdown can be discussed with this completely editable template. It is available for immediate download depending on the needs and requirements of the user.

Sequoia Company Capital Raising Elevator What Are Our Financials Clipart PDF
Purpose of the following slide is to show the key organization financials which displays key KPIs such as the Net Sales, Gross Margin, EBITDA etc. The following slide also highlights a world map that display the organization revenue by geography. Deliver an awe inspiring pitch with this creative sequoia company capital raising elevator what are our financials clipart pdf bundle. Topics like revenues, geographical, potential, organization can be discussed with this completely editable template. It is available for immediate download depending on the needs and requirements of the user.
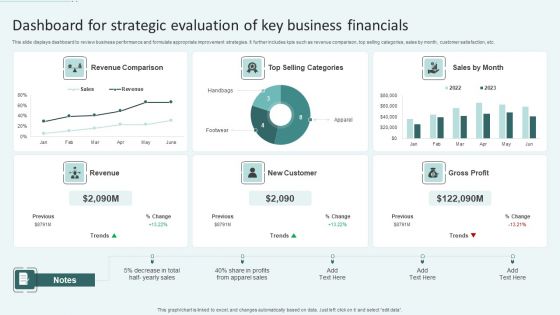
Dashboard For Strategic Evaluation Of Key Business Financials Ppt Gallery Aids PDF
This slide displays dashboard to review business performance and formulate appropriate improvement strategies. It further includes kpis such as revenue comparison, top selling categories, sales by month, customer satisfaction, etc. Showcasing this set of slides titled Dashboard For Strategic Evaluation Of Key Business Financials Ppt Gallery Aids PDF. The topics addressed in these templates are Revenue Comparison, Top Selling Categories, New Customer. All the content presented in this PPT design is completely editable. Download it and make adjustments in color, background, font etc. as per your unique business setting.
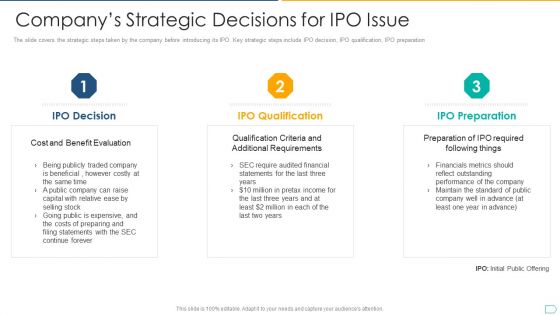
Pitchbook For IPO Deal Companys Strategic Decisions For IPO Issue Elements PDF
The slide covers the strategic steps taken by the company before introducing its IPO. Key strategic steps include IPO decision, IPO qualification, IPO preparation. This is a pitchbook for ipo deal companys strategic decisions for ipo issue elements pdf template with various stages. Focus and dispense information on three stages using this creative set, that comes with editable features. It contains large content boxes to add your information on topics like requirements, financial, costs, performance, metrics. You can also showcase facts, figures, and other relevant content using this PPT layout. Grab it now.
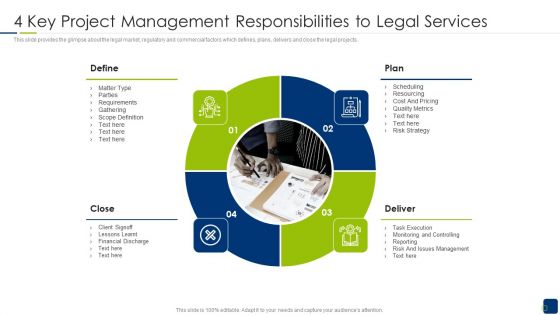
4 Key Project Management Responsibilities To Legal Services Structure PDF
This slide provides the glimpse about the legal market, regulatory and commercial factors which defines, plans, delivers and close the legal projects. This is a 4 key project management responsibilities to legal services structure pdf template with various stages. Focus and dispense information on four stages using this creative set, that comes with editable features. It contains large content boxes to add your information on topics like requirements, financial, risk, management, metrics. You can also showcase facts, figures, and other relevant content using this PPT layout. Grab it now.
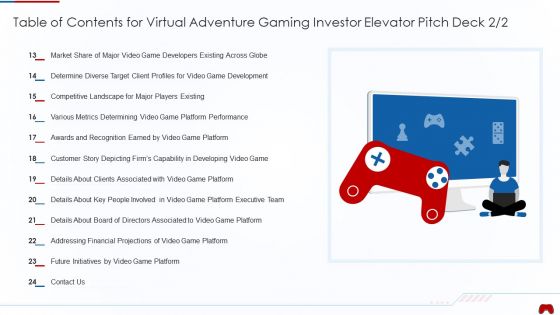
Table Of Contents For Virtual Adventure Gaming Investor Elevator Pitch Deck Capability Professional PDF
This slide caters details about financial projections of video game platform progress for next years with gross profit, EBITDA, Y or Y growth, net income. Deliver and pitch your topic in the best possible manner with this table of contents for virtual adventure gaming investor elevator pitch deck capability professional pdf. Use them to share invaluable insights on financial projections, capability, developing, metrics, competitive landscape, target and impress your audience. This template can be altered and modified as per your expectations. So, grab it now.
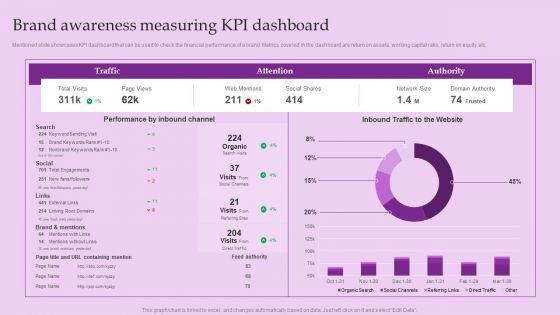
Brand Awareness Measuring Kpi Dashboard Brand And Equity Evaluation Techniques Ideas PDF
Mentioned slide showcases KPI dashboard that can be used to check the financial performance of a brand. Metrics covered in the dashboard are return on assets, working capital ratio, return on equity etc.From laying roadmaps to briefing everything in detail, our templates are perfect for you. You can set the stage with your presentation slides. All you have to do is download these easy-to-edit and customizable templates. Brand Awareness Measuring Kpi Dashboard Brand And Equity Evaluation Techniques Ideas PDF will help you deliver an outstanding performance that everyone would remember and praise you for. Do download this presentation today.

Building Market Brand Leadership Strategies Kpi Dashboard To Track Brand Performance Designs PDF
Mentioned slide showcases KPI dashboard that can be used to check the financial performance of a brand. Metrics covered in the dashboard are return on assets, working capital ratio, return on equity etc. There are so many reasons you need a Building Market Brand Leadership Strategies Kpi Dashboard To Track Brand Performance Designs PDF. The first reason is you cannot spend time making everything from scratch, Thus, Slidegeeks has made presentation templates for you too. You can easily download these templates from our website easily.
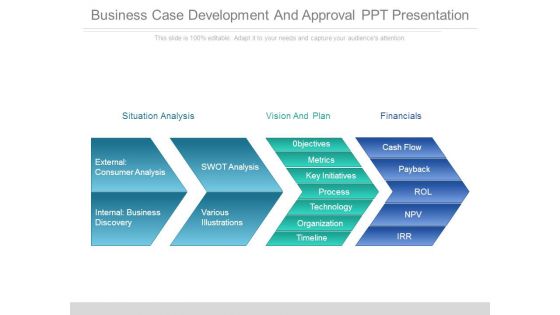
Business Case Development And Approval Ppt Presentation
This is a business case development and approval ppt presentation. This is a four stage process. The stages in this process are situation analysis, vision and plan, financials, swot analysis, various illustrations, 0bjectives, metrics, key initiatives, process, technology, organization, timeline, cash flow, payback, rol, npv, irr, external consumer analysis, internal business discovery.
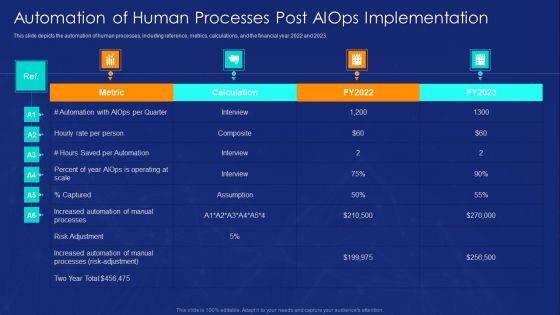
Automation Of Human Processes Post AIOPS Implementation Ppt Ideas Background Image PDF
This slide depicts the automation of human processes, including reference, metrics, calculations, and the financial year 2022 and 2023. Deliver an awe inspiring pitch with this creative Automation Of Human Processes Post AIOPS Implementation Ppt Ideas Background Image PDF bundle. Topics like Metric, Hourly Rate, Per Person, Risk Adjustment can be discussed with this completely editable template. It is available for immediate download depending on the needs and requirements of the user.

Hotel Administration Software Dashboard For Business Intelligence Infographics PDF
This slide covers HMS dashboard. The purpose of this dashboard is to get an overview of hotel key metrics and to check financial status against targets. It includes elements such as reservations, check in guests, reservation type and housekeeping. Pitch your topic with ease and precision using this Hotel Administration Software Dashboard For Business Intelligence Infographics PDF. This layout presents information on Guest, Housekeeping, Reservation Type. It is also available for immediate download and adjustment. So, changes can be made in the color, design, graphics or any other component to create a unique layout.
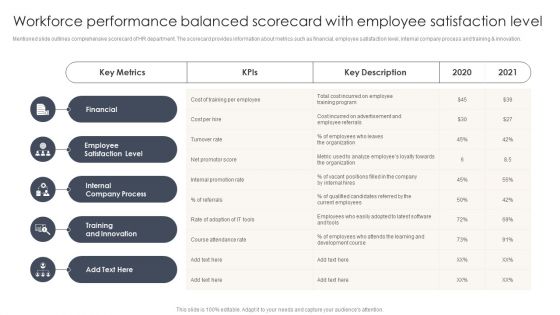
Workforce Performance Balanced Scorecard With Employee Satisfaction Level Inspiration PDF
Mentioned slide outlines comprehensive scorecard of HR department. The scorecard provides information about metrics such as financial, employee satisfaction level, internal company process and training and innovation. Pitch your topic with ease and precision using this Workforce Performance Balanced Scorecard With Employee Satisfaction Level Inspiration PDF. This layout presents information on Employee Satisfaction Level, Internal Company Process, Training Innovation. It is also available for immediate download and adjustment. So, changes can be made in the color, design, graphics or any other component to create a unique layout.

Loss Of Income And Financials Decline In An Automobile Organization Case Study Key Performance Indicators Brochure PDF
The slide shows the key Performance Indicator KPI s which will help the company to track the success rate of implemented strategies. Major KPIs include number of vehicle sold and manufactured, utilization rate, number of visitors, customer satisfaction level etc.Deliver an awe inspiring pitch with this creative loss of income and financials decline in an automobile organization case study key performance indicators brochure pdf bundle. Topics like key performance indicator, utilization rate, customer satisfaction level can be discussed with this completely editable template. It is available for immediate download depending on the needs and requirements of the user
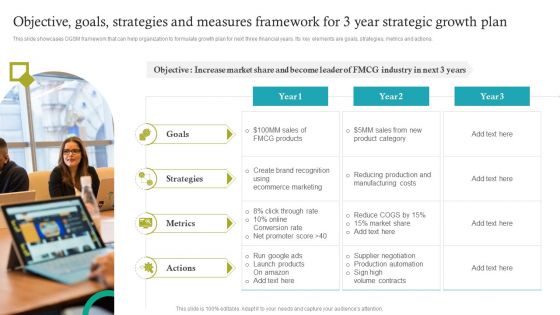
Objective Goals Strategies And Measures Framework For 3 Year Strategic Growth Plan Mockup PDF
This slide showcases OGSM framework that can help organization to formulate growth plan for next three financial years. Its key elements are goals, strategies, metrics and actions. Presenting Objective Goals Strategies And Measures Framework For 3 Year Strategic Growth Plan Mockup PDF to dispense important information. This template comprises one stages. It also presents valuable insights into the topics including Goals, Metrics, Actions. This is a completely customizable PowerPoint theme that can be put to use immediately. So, download it and address the topic impactfully.
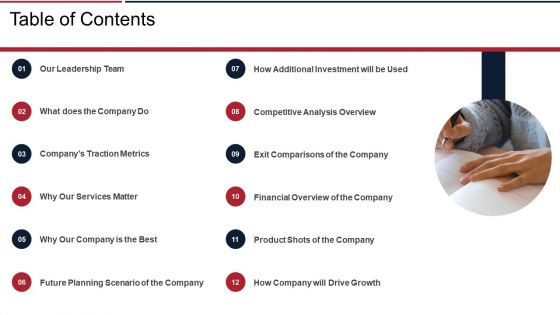
Next View Ventures Fundraising Pitch Deck Table Of Contents Elements PDF
This is a next view ventures fundraising pitch deck table of contents elements pdf template with various stages. Focus and dispense information on twelve stages using this creative set, that comes with editable features. It contains large content boxes to add your information on topics like planning scenario, traction metrics, leadership team, competitive analysis, financial overview. You can also showcase facts, figures, and other relevant content using this PPT layout. Grab it now.
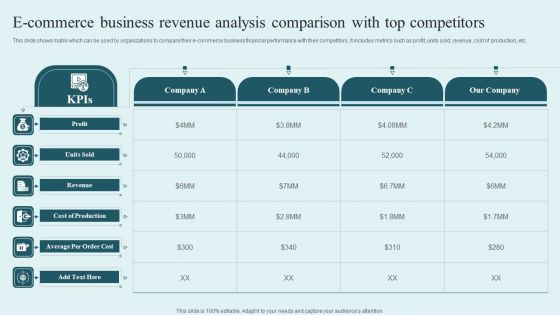
E Commerce Business Revenue Analysis Comparison With Top Competitors Rules PDF
This slide shows matrix which can be used by organizations to compare their e-commerce business financial performance with their competitors. It includes metrics such as profit, units sold, revenue, cost of production, etc. Showcasing this set of slides titled E Commerce Business Revenue Analysis Comparison With Top Competitors Rules PDF. The topics addressed in these templates are Profit, Revenue, Average Per, Order Cost . All the content presented in this PPT design is completely editable. Download it and make adjustments in color, background, font etc. as per your unique business setting.

KPI Dashboard To Monitor Beauty Care Products Sales Performance Ppt Outline Example Topics PDF
This slide shows the key performance indicators dashboard which can be used to analyze current financial position of cosmetic business. It includes metrics such as sales, expenses, profit, cash in hand, etc. Showcasing this set of slides titled KPI Dashboard To Monitor Beauty Care Products Sales Performance Ppt Outline Example Topics PDF. The topics addressed in these templates are Accounts Receivable, Profit Margin, Expense. All the content presented in this PPT design is completely editable. Download it and make adjustments in color, background, font etc. as per your unique business setting.
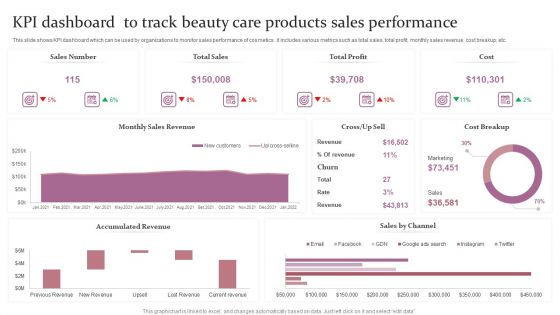
KPI Dashboard To Track Beauty Care Products Sales Performance Ppt Outline Pictures PDF
This slide shows the key performance indicators dashboard which can be used to analyze current financial position of cosmetic business. It includes metrics such as sales, expenses, profit, cash in hand, etc. Showcasing this set of slides titled KPI Dashboard To Track Beauty Care Products Sales Performance Ppt Outline Pictures PDF. The topics addressed in these templates are Sales Number, Total Sales, Total Profit, Cost. All the content presented in this PPT design is completely editable. Download it and make adjustments in color, background, font etc. as per your unique business setting.

KPI Dashboard To Monitor E Commerce Revenue Analysis Performance Mockup PDF
This slide shows the key performance indicators dashboard which can be used to analyze current financial position of e-commerce business. It includes metrics such as revenue, expenses, profit, cash in hand, etc. Showcasing this set of slides titled KPI Dashboard To Monitor E Commerce Revenue Analysis Performance Mockup PDF. The topics addressed in these templates are Accounts Receivable, Accounts Payable, Revenue, Expenses. All the content presented in this PPT design is completely editable. Download it and make adjustments in color, background, font etc. as per your unique business setting.
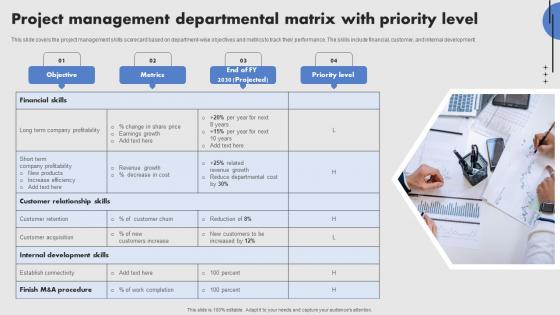
Project Management Departmental Matrix With Priority Level Elements Pdf
This slide covers the project management skills scorecard based on department-wise objectives and metrics to track their performance. The skills include financial, customer, and internal development. Pitch your topic with ease and precision using this Project Management Departmental Matrix With Priority Level Elements Pdf. This layout presents information on Objective, Metrics, Priority Level. It is also available for immediate download and adjustment. So, changes can be made in the color, design, graphics or any other component to create a unique layout.

Brand Authority KPI Dashboard To Track Brand Performance Strategy SS V
Mentioned slide showcases KPI dashboard that can be used to check the financial performance of a brand. Metrics covered in the dashboard are return on assets, working capital ratio, return on equity etc. This Brand Authority KPI Dashboard To Track Brand Performance Strategy SS V is perfect for any presentation, be it in front of clients or colleagues. It is a versatile and stylish solution for organizing your meetings. The Brand Authority KPI Dashboard To Track Brand Performance Strategy SS V features a modern design for your presentation meetings. The adjustable and customizable slides provide unlimited possibilities for acing up your presentation. Slidegeeks has done all the homework before launching the product for you. So, do not wait, grab the presentation templates today

Brand Influence KPI Dashboard To Track Brand Performance Strategy SS V
Mentioned slide showcases KPI dashboard that can be used to check the financial performance of a brand. Metrics covered in the dashboard are return on assets, working capital ratio, return on equity etc. This Brand Influence KPI Dashboard To Track Brand Performance Strategy SS V is perfect for any presentation, be it in front of clients or colleagues. It is a versatile and stylish solution for organizing your meetings. The Brand Influence KPI Dashboard To Track Brand Performance Strategy SS V features a modern design for your presentation meetings. The adjustable and customizable slides provide unlimited possibilities for acing up your presentation. Slidegeeks has done all the homework before launching the product for you. So, do not wait, grab the presentation templates today
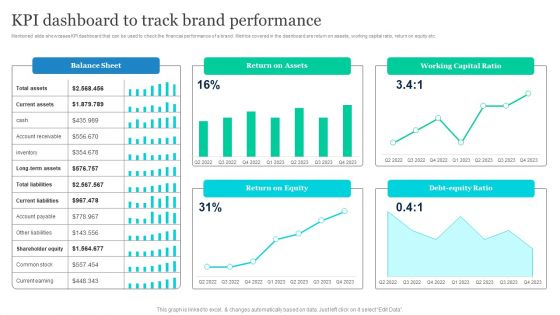
Effective Product Positioning Approach Kpi Dashboard To Track Brand Performance Infographics PDF
Mentioned slide showcases KPI dashboard that can be used to check the financial performance of a brand. Metrics covered in the dashboard are return on assets, working capital ratio, return on equity etc. Slidegeeks is one of the best resources for PowerPoint templates. You can download easily and regulate Effective Product Positioning Approach Kpi Dashboard To Track Brand Performance Infographics PDF for your personal presentations from our wonderful collection. A few clicks is all it takes to discover and get the most relevant and appropriate templates. Use our Templates to add a unique zing and appeal to your presentation and meetings. All the slides are easy to edit and you can use them even for advertisement purposes.

Implementing Brand Leadership Kpi Dashboard To Track Brand Performance Themes PDF
Mentioned slide showcases KPI dashboard that can be used to check the financial performance of a brand. Metrics covered in the dashboard are return on assets, working capital ratio, return on equity etc. This Implementing Brand Leadership Kpi Dashboard To Track Brand Performance Themes PDF is perfect for any presentation, be it in front of clients or colleagues. It is a versatile and stylish solution for organizing your meetings. The Implementing Brand Leadership Kpi Dashboard To Track Brand Performance Themes PDF features a modern design for your presentation meetings. The adjustable and customizable slides provide unlimited possibilities for acing up your presentation. Slidegeeks has done all the homework before launching the product for you. So, dont wait, grab the presentation templates today.

Brand Management Strategy To Increase Awareness KPI Dashboard To Track Brand Performance Slides PDF
Mentioned slide showcases KPI dashboard that can be used to check the financial performance of a brand. Metrics covered in the dashboard are return on assets, working capital ratio, return on equity etc. This Brand Management Strategy To Increase Awareness KPI Dashboard To Track Brand Performance Slides PDF is perfect for any presentation, be it in front of clients or colleagues. It is a versatile and stylish solution for organizing your meetings. The Brand Management Strategy To Increase Awareness KPI Dashboard To Track Brand Performance Slides PDF features a modern design for your presentation meetings. The adjustable and customizable slides provide unlimited possibilities for acing up your presentation. Slidegeeks has done all the homework before launching the product for you. So, dont wait, grab the presentation templates today
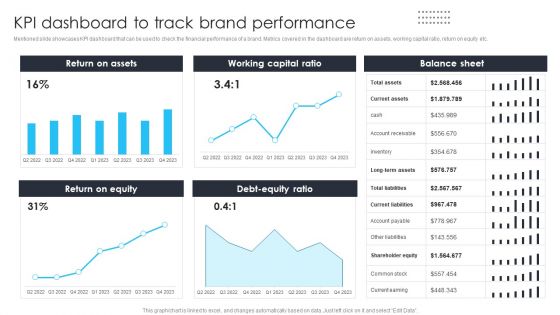
Building Brand Leadership Strategy To Dominate The Market KPI Dashboard To Track Brand Performance Formats PDF
Mentioned slide showcases KPI dashboard that can be used to check the financial performance of a brand. Metrics covered in the dashboard are return on assets, working capital ratio, return on equity etc.This Building Brand Leadership Strategy To Dominate The Market KPI Dashboard To Track Brand Performance Formats PDF is perfect for any presentation, be it in front of clients or colleagues. It is a versatile and stylish solution for organizing your meetings. The Building Brand Leadership Strategy To Dominate The Market KPI Dashboard To Track Brand Performance Formats PDF features a modern design for your presentation meetings. The adjustable and customizable slides provide unlimited possibilities for acing up your presentation. Slidegeeks has done all the homework before launching the product for you. So, dont wait, grab the presentation templates today
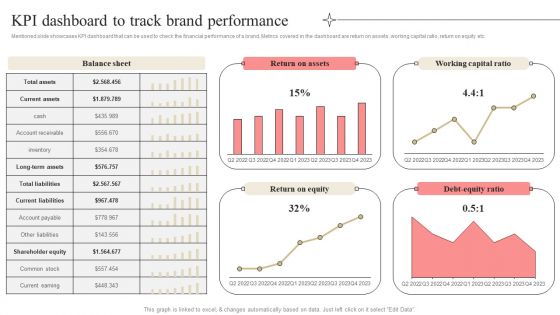
Developing Market Leading Businesses KPI Dashboard To Track Brand Performance Summary PDF
Mentioned slide showcases KPI dashboard that can be used to check the financial performance of a brand. Metrics covered in the dashboard are return on assets, working capital ratio, return on equity etc. Coming up with a presentation necessitates that the majority of the effort goes into the content and the message you intend to convey. The visuals of a PowerPoint presentation can only be effective if it supplements and supports the story that is being told. Keeping this in mind our experts created Developing Market Leading Businesses KPI Dashboard To Track Brand Performance Summary PDF to reduce the time that goes into designing the presentation. This way, you can concentrate on the message while our designers take care of providing you with the right template for the situation.
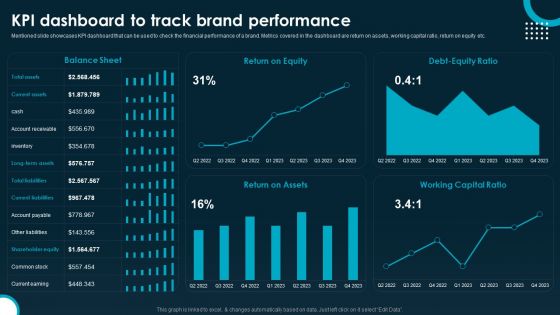
KPI Dashboard To Track Brand Performance Information PDF
Mentioned slide showcases KPI dashboard that can be used to check the financial performance of a brand. Metrics covered in the dashboard are return on assets, working capital ratio, return on equity etc. Do you know about Slidesgeeks KPI Dashboard To Track Brand Performance Information PDF These are perfect for delivering any kind od presentation. Using it, create PowerPoint presentations that communicate your ideas and engage audiences. Save time and effort by using our pre designed presentation templates that are perfect for a wide range of topic. Our vast selection of designs covers a range of styles, from creative to business, and are all highly customizable and easy to edit. Download as a PowerPoint template or use them as Google Slides themes.

KPI Dashboard To Track Brand Performance Ppt Ideas Pictures PDF
Mentioned slide showcases KPI dashboard that can be used to check the financial performance of a brand. Metrics covered in the dashboard are return on assets, working capital ratio, return on equity etc. Formulating a presentation can take up a lot of effort and time, so the content and message should always be the primary focus. The visuals of the PowerPoint can enhance the presenters message, so our KPI Dashboard To Track Brand Performance Ppt Ideas Pictures PDF was created to help save time. Instead of worrying about the design, the presenter can concentrate on the message while our designers work on creating the ideal templates for whatever situation is needed. Slidegeeks has experts for everything from amazing designs to valuable content, we have put everything into KPI Dashboard To Track Brand Performance Ppt Ideas Pictures PDF.

KPI Dashboard To Analyze Performance Of Healthcare General Management Introduction Pdf
The following slide showcases key performance indicator KPI dashboard which can be used to analyze the financial performance of hospital. The metrics covered in the slide are net profit margin, income and expenses, etc. Slidegeeks has constructed KPI Dashboard To Analyze Performance Of Healthcare General Management Introduction Pdf after conducting extensive research and examination. These presentation templates are constantly being generated and modified based on user preferences and critiques from editors. Here, you will find the most attractive templates for a range of purposes while taking into account ratings and remarks from users regarding the content. This is an excellent jumping-off point to explore our content and will give new users an insight into our top-notch PowerPoint Templates.
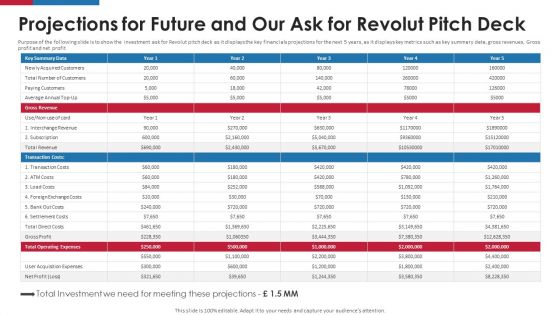
Revolut Capital Funding Projections For Future And Our Ask For Revolut Pitch Deck Ppt Pictures PDF
Purpose of the following slide is to show the investment ask for Revolut pitch deck as it displays the key financials projections for the next 5 years, as it displays key metrics such as key summary data, gross revenues, Gross profit and net profit. Purpose of the following slide is to show the investment ask for Revolut pitch deck as it displays the key financials projections for the next 5 years, as it displays key metrics such as key summary data, gross revenues, Gross profit and net profit. Deliver and pitch your topic in the best possible manner with this Revolut Capital Funding Projections For Future And Our Ask For Revolut Pitch Deck Ppt Pictures PDF. Use them to share invaluable insights on Key Summary Data, Gross Revenue, Transaction Costs and impress your audience. This template can be altered and modified as per your expectations. So, grab it now.
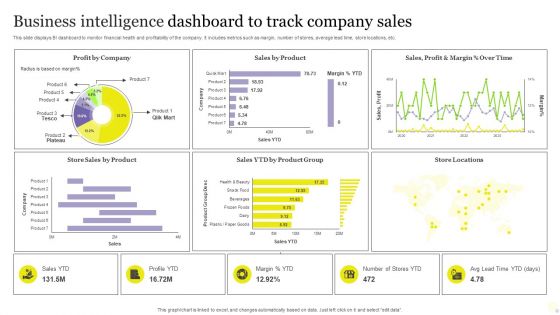
Business Intelligence Dashboard To Track Company Sales Rules PDF
This slide displays BI dashboard to monitor financial health and profitability of the company. It includes metrics such as margin, number of stores, average lead time, store locations, etc. Showcasing this set of slides titled Business Intelligence Dashboard To Track Company Sales Rules PDF. The topics addressed in these templates are Business Intelligence Dashboard, Track Company Sales. All the content presented in this PPT design is completely editable. Download it and make adjustments in color, background, font etc. as per your unique business setting.

sales performance by product ppt powerpoint presentation infographic template infographic template
Presenting this set of slides with name sales performance by product ppt powerpoint presentation infographic template infographic template. The topics discussed in these slides are finance, marketing, management, investment, analysis. This is a completely editable PowerPoint presentation and is available for immediate download. Download now and impress your audience.
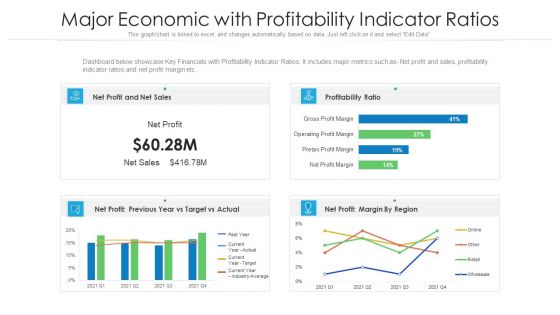
Major Economic With Profitability Indicator Ratios Ppt PowerPoint Presentation Gallery Layouts PDF
Dashboard below showcase Key Financials with Profitability Indicator Ratios. It includes major metrics such as- Net profit and sales, profitability indicator ratios and net profit margin etc. Pitch your topic with ease and precision using this major economic with profitability indicator ratios ppt powerpoint presentation gallery layouts pdf. This layout presents information on sales, profitability ratio, target. It is also available for immediate download and adjustment. So, changes can be made in the color, design, graphics or any other component to create a unique layout.
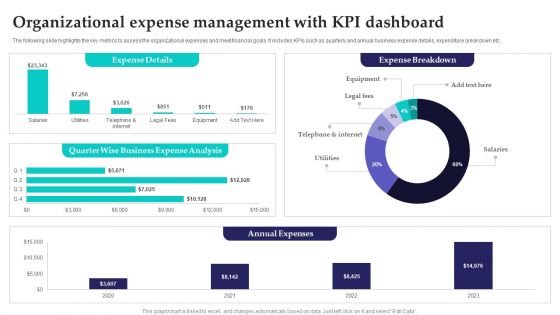
Organizational Expense Management With Kpi Dashboard Slides PDF
The following slide highlights the key metrics to assess the organizational expenses and meet financial goals. It includes KPIs such as quarterly and annual business expense details, expenditure breakdown etc. Showcasing this set of slides titled Organizational Expense Management With Kpi Dashboard Slides PDF. The topics addressed in these templates are Annual Expenses, Expense Details, Expense Breakdown. All the content presented in this PPT design is completely editable. Download it and make adjustments in color, background, font etc. as per your unique business setting.
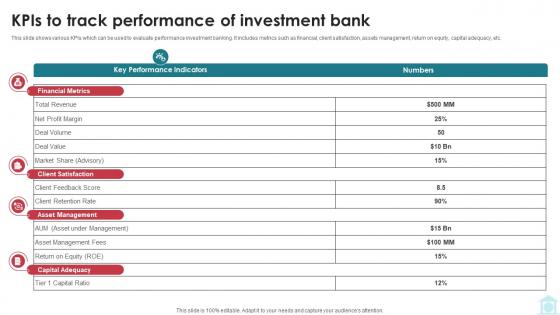
Kpis To Track Performance Of Investment Bank Mastering Investment Banking Fin SS V
This slide shows various KPIs which can be used to evaluate performance investment banking. It includes metrics such as financial, client satisfaction, assets management, return on equity, capital adequacy, etc. Here you can discover an assortment of the finest PowerPoint and Google Slides templates. With these templates, you can create presentations for a variety of purposes while simultaneously providing your audience with an eye-catching visual experience. Download Kpis To Track Performance Of Investment Bank Mastering Investment Banking Fin SS V to deliver an impeccable presentation. These templates will make your job of preparing presentations much quicker, yet still, maintain a high level of quality. Slidegeeks has experienced researchers who prepare these templates and write high-quality content for you. Later on, you can personalize the content by editing the Kpis To Track Performance Of Investment Bank Mastering Investment Banking Fin SS V

KPIs To Track Performance Of Investment Bank Understanding Investment Banking Framework Fin SS V
This slide shows various KPIs which can be used to evaluate performance investment banking. It includes metrics such as financial, client satisfaction, assets management, return on equity, capital adequacy, etc. Here you can discover an assortment of the finest PowerPoint and Google Slides templates. With these templates, you can create presentations for a variety of purposes while simultaneously providing your audience with an eye-catching visual experience. Download KPIs To Track Performance Of Investment Bank Understanding Investment Banking Framework Fin SS V to deliver an impeccable presentation. These templates will make your job of preparing presentations much quicker, yet still, maintain a high level of quality. Slidegeeks has experienced researchers who prepare these templates and write high-quality content for you. Later on, you can personalize the content by editing the KPIs To Track Performance Of Investment Bank Understanding Investment Banking Framework Fin SS V.
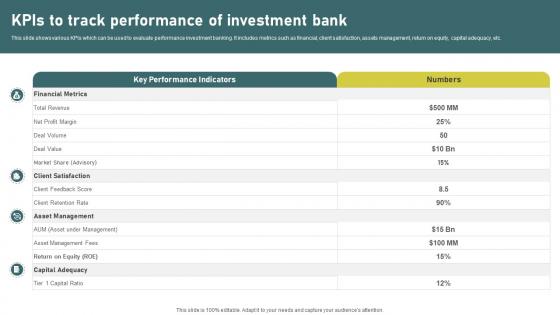
KPIs To Track Performance Of Investment Banking Simplified Functions Fin SS V
This slide shows various KPIs which can be used to evaluate performance investment banking. It includes metrics such as financial, client satisfaction, assets management, return on equity, capital adequacy, etc. Here you can discover an assortment of the finest PowerPoint and Google Slides templates. With these templates, you can create presentations for a variety of purposes while simultaneously providing your audience with an eye-catching visual experience. Download KPIs To Track Performance Of Investment Banking Simplified Functions Fin SS V to deliver an impeccable presentation. These templates will make your job of preparing presentations much quicker, yet still, maintain a high level of quality. Slidegeeks has experienced researchers who prepare these templates and write high-quality content for you. Later on, you can personalize the content by editing the NNNNNNNNNNNNNNNNNNNNNNNNNNNNNN.

Leading And Lagging Indicators Balanced Scorecard Pictures PDF
This slide showcase a balanced scorecard that enable managers to track leading lagging performance metric to improve their internal operations. It incorporates financial, customer, internal and learning and growth indicators of a organization. Pitch your topic with ease and precision using this Leading And Lagging Indicators Balanced Scorecard Pictures PDF. This layout presents information on Financial Indicator, Customer Indicator, Internal Indicator, Growth Indicator. It is also available for immediate download and adjustment. So, changes can be made in the color, design, graphics or any other component to create a unique layout.

Major Economic Highlights With Operating Profit Ppt PowerPoint Presentation File Portfolio PDF
This slide showcase key Financials highlights with OPEX and EBIT. It includes major metrics such as- operating expenditure, earning before interest and taxes with gross profit, marketing, interest and taxes etc. Showcasing this set of slides titled major economic highlights with operating profit ppt powerpoint presentation file portfolio pdf. The topics addressed in these templates are revenue, sales, administration. All the content presented in this PPT design is completely editable. Download it and make adjustments in color, background, font etc. as per your unique business setting.
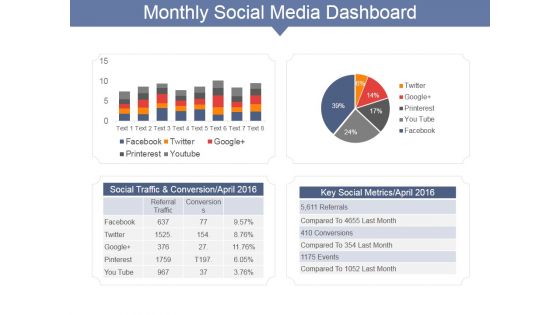
Monthly Social Media Dashboard Ppt PowerPoint Presentation Gallery Show
This is a monthly social media dashboard ppt powerpoint presentation gallery show. This is a two stage process. The stages in this process are social traffic and conversion april, key social metrics april, facebook, twitter.

Monthly Social Media Dashboard Ppt PowerPoint Presentation Pictures Guide
This is a monthly social media dashboard ppt powerpoint presentation pictures guide. This is a two stage process. The stages in this process are social traffic and conversions april, key social metrics april, facebook, twitter, google.

Online Marketing Tactics To Enhance Sales Kpis To Measure Audience Reach Across Social Media Professional PDF
This slide shows the dashboard that represents metrics to measure audience reach across social media channels which includes views, clicks, likes, impressions, actions, tweets, followers, interactions, etc. Deliver an awe inspiring pitch with this creative Online Marketing Tactics To Enhance Sales Kpis To Measure Audience Reach Across Social Media Professional PDF bundle. Topics like LinkedIn Channel, Facebook Account, Twitter, Facebook Ads can be discussed with this completely editable template. It is available for immediate download depending on the needs and requirements of the user.

Customer Satisfaction Data Insights Dashboard Ideas PDF
The following slide highlights the key metrics of the customer satisfaction survey conducted to measure and enhance the user experience. It includes satisfaction, recommendation rate, customers professional background and reviews. Showcasing this set of slides titled Customer Satisfaction Data Insights Dashboard Ideas PDF. The topics addressed in these templates are Recommendation Rate, Customer Satisfaction Rate, Customer Professional Background. All the content presented in this PPT design is completely editable. Download it and make adjustments in color, background, font etc. as per your unique business setting.
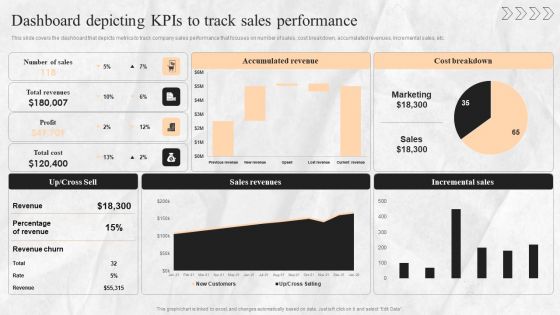
Digital Transition Plan For Managing Business Dashboard Depicting Kpis To Track Sales Performance Guidelines PDF
This slide covers the dashboard that depicts metrics to track company sales performance that focuses on number of sales, cost breakdown, accumulated revenues, incremental sales, etc. Are you in need of a template that can accommodate all of your creative concepts This one is crafted professionally and can be altered to fit any style. Use it with Google Slides or PowerPoint. Include striking photographs, symbols, depictions, and other visuals. Fill, move around, or remove text boxes as desired. Test out color palettes and font mixtures. Edit and save your work, or work with colleagues. Download Digital Transition Plan For Managing Business Dashboard Depicting Kpis To Track Sales Performance Guidelines PDF and observe how to make your presentation outstanding. Give an impeccable presentation to your group and make your presentation unforgettable.
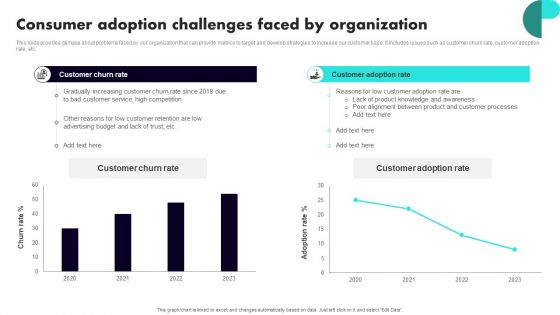
Implementing Client Onboarding Process Consumer Adoption Challenges Faced By Organization Graphics PDF
This slide provides glimpse about problems faced by our organization that can provide metrics to target and develop strategies to increase our customer base. It includes issues such as customer churn rate, customer adoption rate, etc. Slidegeeks is here to make your presentations a breeze with Implementing Client Onboarding Process Consumer Adoption Challenges Faced By Organization Graphics PDF With our easy to use and customizable templates, you can focus on delivering your ideas rather than worrying about formatting. With a variety of designs to choose from, you are sure to find one that suits your needs. And with animations and unique photos, illustrations, and fonts, you can make your presentation pop. So whether you are giving a sales pitch or presenting to the board, make sure to check out Slidegeeks first.
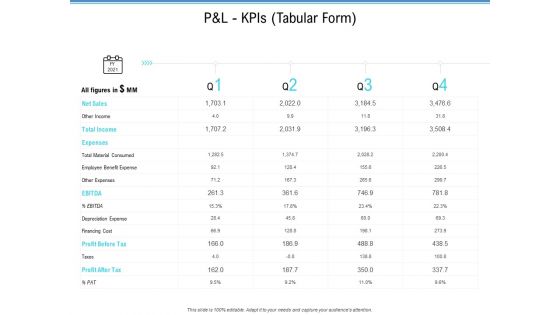
Enterprise Analysis P And L Kpis Tabular Form Ppt Slides Graphics Download PDF
Deliver and pitch your topic in the best possible manner with this enterprise analysis p and l kpis tabular form ppt slides graphics download pdf. Use them to share invaluable insights on operating profit, net profit, cogs, revenue and impress your audience. This template can be altered and modified as per your expectations. So, grab it now.

Money Growth Investment Ideas PowerPoint Template
Above is the creatively designed PPT slide which you can use to explain that how the idea of investment can lead to the money growth. This template also help you explain to your colleagues that how different ideas if put together can lead to the betterment of the company or the growth of the company. There are icons present in the template as well which are easily editable. You can choose the color, text and icon of your choice as per your requirement. Use this slide in your presentation and leave great impression on your audience.
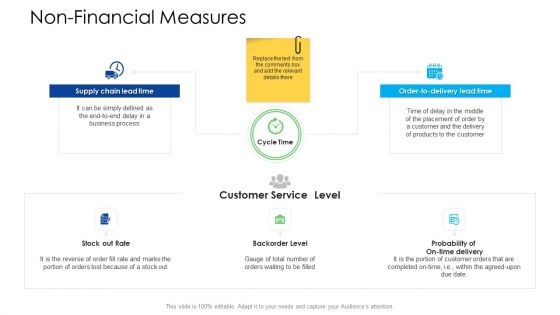
Logistics Management Services Non-Financial Measures Slides PDF
Presenting logistics management services non-financial measures slides pdf to provide visual cues and insights. Share and navigate important information on three stages that need your due attention. This template can be used to pitch topics like supply chain lead time, order to delivery lead time, customer service level. In addtion, this PPT design contains high resolution images, graphics, etc, that are easily editable and available for immediate download.
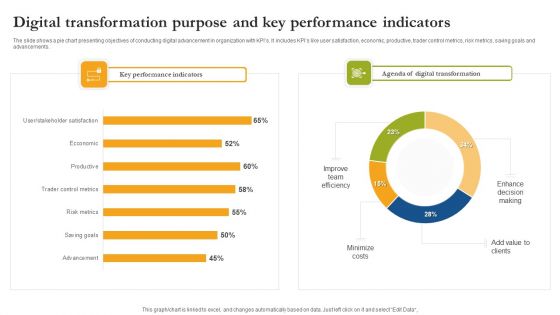
Digital Transformation Purpose And Key Performance Indicators Formats PDF
The slide shows a pie chart presenting objectives of conducting digital advancement in organization with KPIs. It includes KPIs like user satisfaction, economic, productive, trader control metrics, risk metrics, saving goals and advancements. Pitch your topic with ease and precision using this Digital Transformation Purpose And Key Performance Indicators Formats PDF. This layout presents information on Key Performance Indicators, Digital Transformation, Minimize Costs. It is also available for immediate download and adjustment. So, changes can be made in the color, design, graphics or any other component to create a unique layout.

Target Marketing Techniques Analyze Online And Offline Marketing Campaigns Data Ideas PDF
This template covers dashboard to measure and analyze target marketing campaign performance. It also helps in tracking and reporting online and offline marketing campaigns through KPIs such as traffic sources, lead generation metrics, offline product sales, store visitations, customer acquisition, and offline retention and advocacy Find a pre designed and impeccable Target Marketing Techniques Evaluating Growth Rate For Target Marketing Slides PDF. The templates can ace your presentation without additional effort. You can download these easy to edit presentation templates to make your presentation stand out from others. So, what are you waiting for Download the template from Slidegeeks today and give a unique touch to your presentation.

Competitive Edge Performance Representation For Variance Analysis Techniques And Models Ideas PDF
This slide covers the graphical representation for gap analyzation process. It also covers the important factors such as, sales metrics, time frame, potential and performance. Showcasing this set of slides titled competitive edge performance representation for variance analysis techniques and models ideas pdf. The topics addressed in these templates are competitive edge performance representation for variance analysis techniques and models. All the content presented in this PPT design is completely editable. Download it and make adjustments in color, background, font etc. as per your unique business setting.
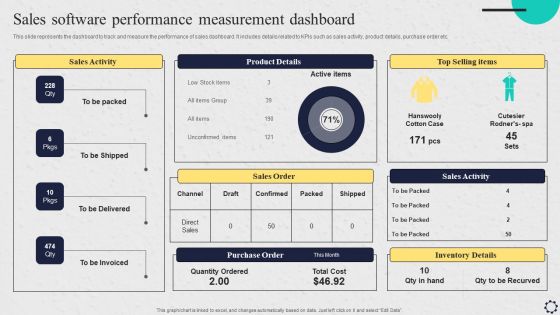
Software Implementation Strategy Sales Software Performance Measurement Dashboard Template PDF
This slide represents the dashboard to track and measure the performance of sales dashboard. It includes details related to KPIs such as sales activity, product details, purchase order etc. Coming up with a presentation necessitates that the majority of the effort goes into the content and the message you intend to convey. The visuals of a PowerPoint presentation can only be effective if it supplements and supports the story that is being told. Keeping this in mind our experts created Software Implementation Strategy Sales Software Performance Measurement Dashboard Template PDF to reduce the time that goes into designing the presentation. This way, you can concentrate on the message while our designers take care of providing you with the right template for the situation.
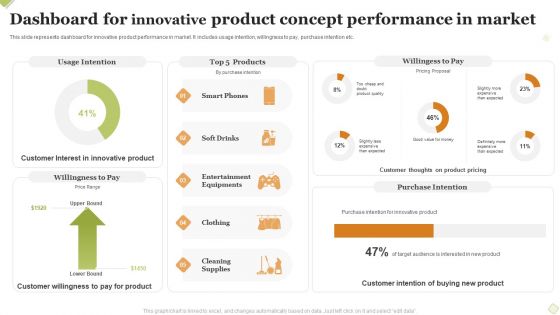
Dashboard For Innovative Product Concept Performance In Market Formats PDF
This slide represents dashboard for innovative product performance in market. It includes usage intention, willingness to pay, purchase intention etc. Pitch your topic with ease and precision using this Dashboard For Innovative Product Concept Performance In Market Formats PDF This layout presents information on Usage Intention, Willingess To Pay, Purchase Intention . It is also available for immediate download and adjustment. So, changes can be made in the color, design, graphics or any other component to create a unique layout.
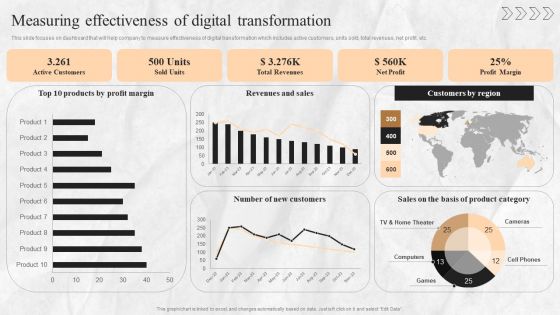
Digital Transition Plan For Managing Business Measuring Effectiveness Of Digital Transformation Portrait PDF
This slide focuses on dashboard that will help company to measure effectiveness of digital transformation which includes active customers, units sold, total revenues, net profit, etc. Formulating a presentation can take up a lot of effort and time, so the content and message should always be the primary focus. The visuals of the PowerPoint can enhance the presenters message, so our Digital Transition Plan For Managing Business Measuring Effectiveness Of Digital Transformation Portrait PDF was created to help save time. Instead of worrying about the design, the presenter can concentrate on the message while our designers work on creating the ideal templates for whatever situation is needed. Slidegeeks has experts for everything from amazing designs to valuable content, we have put everything into Digital Transition Plan For Managing Business Measuring Effectiveness Of Digital Transformation Portrait PDF

Software Implementation Strategy Release Burndown Report To Measure Software Implementation Project Progress Introduction PDF
This slide represents the team progress towards the release date by plotting the remaining effort against the ideal effort. It includes details related to use cases of release burndown report. Formulating a presentation can take up a lot of effort and time, so the content and message should always be the primary focus. The visuals of the PowerPoint can enhance the presenters message, so our Software Implementation Strategy Release Burndown Report To Measure Software Implementation Project Progress Introduction PDF was created to help save time. Instead of worrying about the design, the presenter can concentrate on the message while our designers work on creating the ideal templates for whatever situation is needed. Slidegeeks has experts for everything from amazing designs to valuable content, we have put everything into Software Implementation Strategy Release Burndown Report To Measure Software Implementation Project Progress Introduction PDF
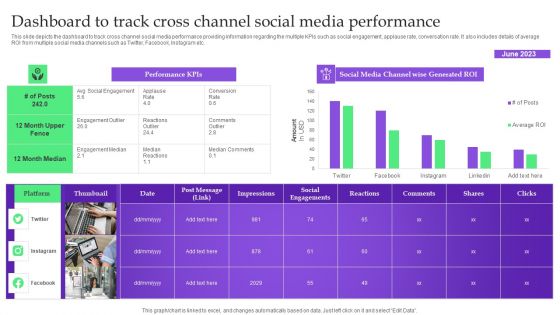
Analysis Plan For E Commerce Promotion Tactics Dashboard To Track Cross Channel Social Media Performance Demonstration PDF
This slide depicts the dashboard to track cross channel social media performance providing information regarding the multiple KPIs such as social engagement, applause rate, conversation rate. It also includes details of average ROI from multiple social media channels such as Twitter, Facebook, Instagram etc. This Analysis Plan For E Commerce Promotion Tactics Dashboard To Track Cross Channel Social Media Performance Demonstration PDF is perfect for any presentation, be it in front of clients or colleagues. It is a versatile and stylish solution for organizing your meetings. The Analysis Plan For E Commerce Promotion Tactics Dashboard To Track Cross Channel Social Media Performance Demonstration PDF features a modern design for your presentation meetings. The adjustable and customizable slides provide unlimited possibilities for acing up your presentation. Slidegeeks has done all the homework before launching the product for you. So, do not wait, grab the presentation templates today.

Product Data Insights Analysis Sheet Infographics PDF
The following slide depicts the annual performance of multiple products in terms of profit or loss to track whether they are doing well or not. The analysis sheet includes element such as cost, units, selling price, sales etc. Pitch your topic with ease and precision using this Product Data Insights Analysis Sheet Infographics PDF. This layout presents information on Unit Sold, Selling Price, Total Sales. It is also available for immediate download and adjustment. So, changes can be made in the color, design, graphics or any other component to create a unique layout.

Multi Channel Marketing Strategy Dashboard Slides PDF
This slide showcases marketing channels instrument board. The purpose of this template is evaluate progress and improve decision making. It includes elements such as marketing channel type digital marketing, free marketing, paid marketing and traditional marketing, main KPIS, click revenue. Pitch your topic with ease and precision using this Multi Channel Marketing Strategy Dashboard Slides PDF. This layout presents information on Bounce Rate, Conversion Rate, Marketing Channel Type. It is also available for immediate download and adjustment. So, changes can be made in the color, design, graphics or any other component to create a unique layout.
Implementing Client Onboarding Process Customer Reviews And Ratings For Product Evaluation Icons PDF
This slide provides glimpse about client reviews about the product offered by the brand so the customers can check reviews of products users and realize the products value. It includes multiple KPIs such as quality, effectiveness, fragrance, etc. If you are looking for a format to display your unique thoughts, then the professionally designed Implementing Client Onboarding Process Customer Reviews And Ratings For Product Evaluation Icons PDF is the one for you. You can use it as a Google Slides template or a PowerPoint template. Incorporate impressive visuals, symbols, images, and other charts. Modify or reorganize the text boxes as you desire. Experiment with shade schemes and font pairings. Alter, share or cooperate with other people on your work. Download Implementing Client Onboarding Process Customer Reviews And Ratings For Product Evaluation Icons PDF and find out how to give a successful presentation. Present a perfect display to your team and make your presentation unforgettable.

Implementing Client Onboarding Process Dashboard To Evaluate Consumer Adoption In Organization Diagrams PDF
This slide showcases the KPIs that would help our business organization to evaluate improvements in the consumer adoption process. It includes repeat purchase ratio per purchase frequency, conversions over time, customer adoption rate, customer churn rate, etc. Do you have an important presentation coming up Are you looking for something that will make your presentation stand out from the rest Look no further than Implementing Client Onboarding Process Dashboard To Evaluate Consumer Adoption In Organization Diagrams PDF. With our professional designs, you can trust that your presentation will pop and make delivering it a smooth process. And with Slidegeeks, you can trust that your presentation will be unique and memorable. So why wait Grab Implementing Client Onboarding Process Dashboard To Evaluate Consumer Adoption In Organization Diagrams PDF today and make your presentation stand out from the rest.

Business Survey Analysis Dashboard Based On Demographics Data Microsoft PDF
The purpose of this template is to explain the analysis of business survey conduct based on demographics. The slide provides information about support team, respondents and product preference. Pitch your topic with ease and precision using this Business Survey Analysis Dashboard Based On Demographics Data Microsoft PDF. This layout presents information on Support, Team Performance, Product Preference It is also available for immediate download and adjustment. So, changes can be made in the color, design, graphics or any other component to create a unique layout.

KPI Dashboard To Assess Deals In Mergers And Acquisitions Strategy Rules PDF
Following slide showcases dashboard for mergers and acquisitions to measure effects of milestones to confirm integration plan accordingly. It presents information related to deals by types, country, etc. Pitch your topic with ease and precision using this KPI Dashboard To Assess Deals In Mergers And Acquisitions Strategy Rules PDF. This layout presents information on Status, Strategy, Minority Equity Stake. It is also available for immediate download and adjustment. So, changes can be made in the color, design, graphics or any other component to create a unique layout.
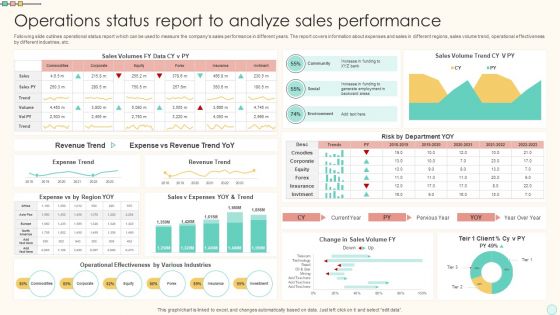
Operations Status Report To Analyze Sales Performance Portrait PDF
Following slide outlines operational status report which can be used to measure the companys sales performance in different years. The report covers information about expenses and sales in different regions, sales volume trend, operational effectiveness by different industries, etc. Showcasing this set of slides titled Operations Status Report To Analyze Sales Performance Portrait PDF. The topics addressed in these templates are Operations Status Report, Analyze Sales Performance. All the content presented in this PPT design is completely editable. Download it and make adjustments in color, background, font etc. as per your unique business setting.
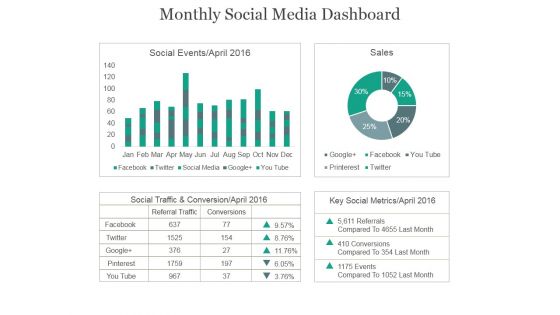
Monthly Social Media Dashboard Ppt PowerPoint Presentation Example 2015
This is a monthly social media dashboard ppt powerpoint presentation example 2015. This is a four stage process. The stages in this process are social events, sales, social traffic, conservation, key social metrics.

Balance Sheet Kpis Ppt PowerPoint Presentation Professional
This is a balance sheet kpis ppt powerpoint presentation professional. This is a four stage process. The stages in this process are current assets, current liabilities, total assets, total liabilities.
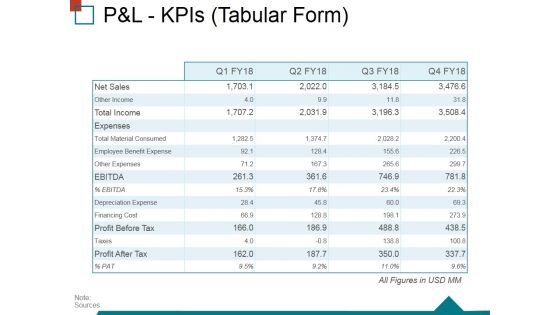
Pandl Kpis Tabular Form Ppt PowerPoint Presentation Ideas Structure
This is a pandl kpis tabular form ppt powerpoint presentation ideas structure. This is a four stage process. The stages in this process are operating profit, revenue, cogs, net profit.
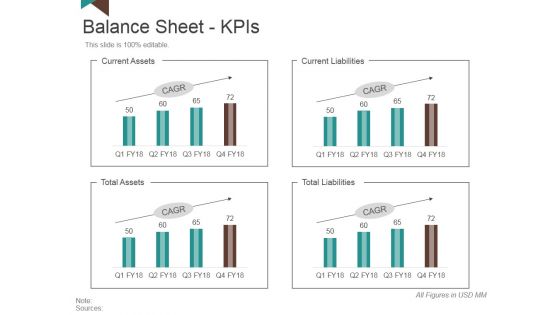
Balance Sheet Kpis Template 3 Ppt PowerPoint Presentation Slides Brochure
This is a balance sheet kpis template 3 ppt powerpoint presentation slides brochure. This is a four stage process. The stages in this process are current assets, current liabilities, total liabilities, total assets.

Cash Flow Statement Kpis Template Ppt PowerPoint Presentation Pictures Diagrams
This is a cash flow statement kpis template ppt powerpoint presentation pictures diagrams. This is a four stage process. The stages in this process are operations, financing activities, investing activities, net increase in cash.
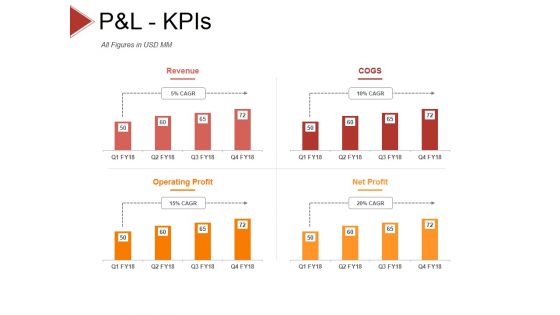
P And L Kpis Template 2 Ppt PowerPoint Presentation Styles Objects
This is a p and l kpis template 2 ppt powerpoint presentation styles objects. This is a four stage process. The stages in this process are revenue, cogs, operating profit, net profit.
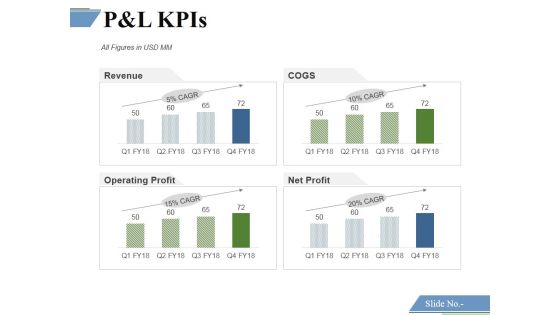
P And L Kpis Template 1 Ppt PowerPoint Presentation Model Inspiration
This is a p and l kpis template 1 ppt powerpoint presentation model inspiration. This is a four stage process. The stages in this process are revenue, cogs, operating profit, net profit.

Cash Flow Statement Kpis Tabular Form Ppt PowerPoint Presentation Gallery Good
This is a cash flow statement kpis tabular form ppt powerpoint presentation gallery good. This is a four stage process. The stages in this process are operations, financing activities, investing activities, net increase in cash.
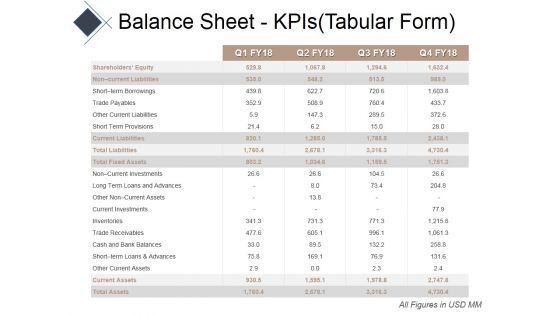
Balance Sheet Kpis Tabular Form Ppt PowerPoint Presentation Show Example Introduction
This is a balance sheet kpis tabular form ppt powerpoint presentation show example introduction. This is a four stage process. The stages in this process are current assets, current liabilities, total assets, total liabilities.
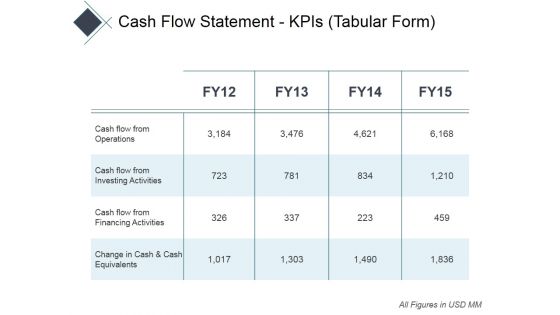
Cash Flow Statement Kpis Tabular Form Ppt PowerPoint Presentation Infographics Professional
This is a cash flow statement kpis tabular form ppt powerpoint presentation infographics professional. This is a four stage process. The stages in this process are operations, financing activities, investing activities, net increase in cash.
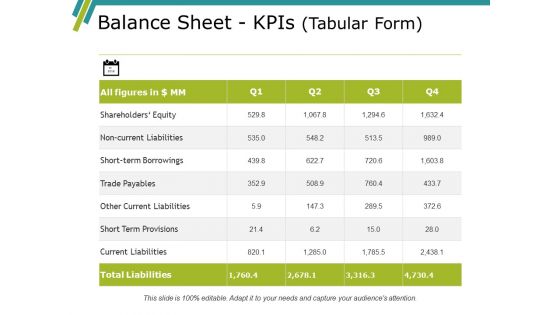
Balance Sheet Kpis Template 1 Ppt PowerPoint Presentation Professional Graphics Download
This is a balance sheet kpis template 1 ppt powerpoint presentation professional graphics download. This is a four stage process. The stages in this process are current assets, current liabilities, total assets, total liabilities.
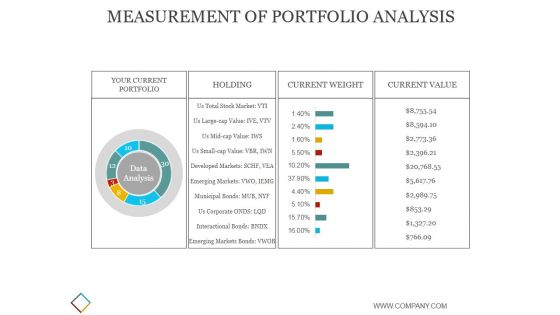
Measurement Of Portfolio Analysis Ppt PowerPoint Presentation Ideas
This is a measurement of portfolio analysis ppt powerpoint presentation ideas. This is a four stage process. The stages in this process are your current portfolio, holding, current weight, current value.

Return On Capital Employed Product Performance Chart Ppt PowerPoint Presentation Portfolio Visuals
This is a return on capital employed product performance chart ppt powerpoint presentation portfolio visuals. This is a three stage process. The stages in this process are accounting ratio, roce, return on capital employed.

Utilizing Cyber Technology For Change Process Measuring ROI Of Digital Healthcare Formats PDF
What changes do you wish to see after digital transformation List out the performance indicators. This is a utilizing cyber technology for change process measuring roi of digital healthcare formats pdf template with various stages. Focus and dispense information on eight stages using this creative set, that comes with editable features. It contains large content boxes to add your information on topics like profit, consumer centricity, consumer satisfaction, savings with early detection of health issues, prodctivity, innovation, employee turnover, early diagnosis of life-threatening diseases. You can also showcase facts, figures, and other relevant content using this PPT layout. Grab it now.
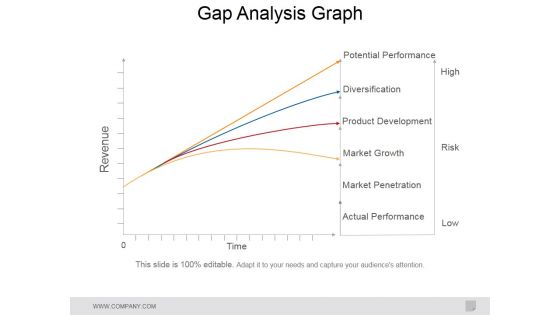
Gap Analysis Graph Ppt PowerPoint Presentation Portfolio Topics
This is a gap analysis graph ppt powerpoint presentation portfolio topics. This is a four stage process. The stages in this process are potential performance, diversification, product development, market growth, market penetration, actual performance.
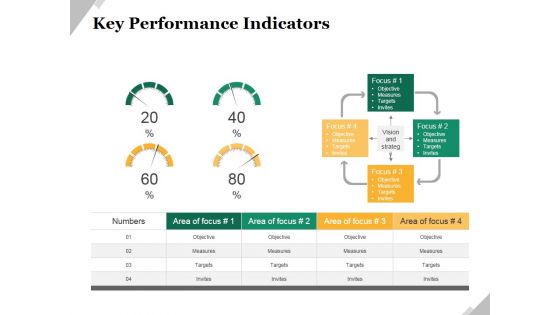
Key Performance Indicators Template 2 Ppt PowerPoint Presentation Model Example
This is a key performance indicators template 2 ppt powerpoint presentation model example. This is a four stage process. The stages in this process are objective, measures, targets, invites, indicators.

Key Performance Indicators Template 2 Ppt PowerPoint Presentation Layouts Portfolio
This is a key performance indicators template 2 ppt powerpoint presentation layouts portfolio. This is a four stage process. The stages in this process are objective, measures, targets, invites.

Biotech Firm Investor Funding Determine Addressable Market Size Opportunity For Biotech Platform Graphics PDF
This slide caters details about addressable market size as revenue opportunity by introducing unconventional product in biotech market. Presenting biotech firm investor funding determine addressable market size opportunity for biotech platform graphics pdf to provide visual cues and insights. Share and navigate important information on three stages that need your due attention. This template can be used to pitch topics like average percentage, overall estimated, significant number, required to perform, cost reduction. In addtion, this PPT design contains high resolution images, graphics, etc, that are easily editable and available for immediate download.
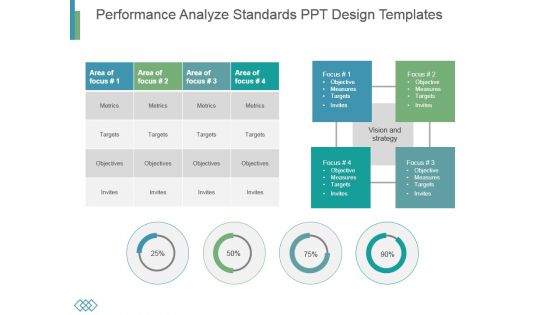
Performance Analyze Standards Ppt Design Templates
This is a performance analyze standards ppt design templates. This is a four stage process. The stages in this process are metrics, targets, objectives, invites.

Pandl Kpis Tabular Form Ppt PowerPoint Presentation Visual Aids
This is a pandl kpis tabular form ppt powerpoint presentation visual aids. This is a four stage process. The stages in this process are revenue, cogs, operating profit, net profit.
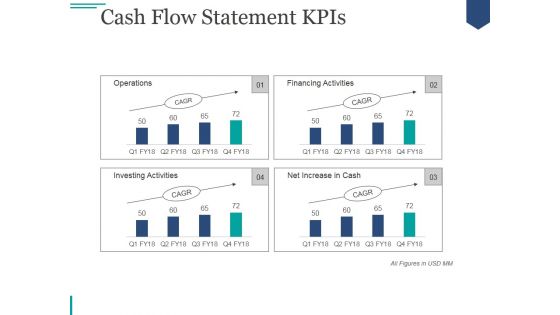
Cash Flow Statement Kpis Ppt PowerPoint Presentation Deck
This is a cash flow statement kpis ppt powerpoint presentation deck. This is a four stage process. The stages in this process are operations, financing activities, investing activities, net increase in cash.

Balance Sheet Kpis Tabular Form Ppt PowerPoint Presentation Professional Display
This is a balance sheet kpis tabular form ppt powerpoint presentation professional display. This is a four stage process. The stages in this process are current assets, current liabilities, total assets, total liabilities.

Cash Flow Statement Kpis Tabular Form Ppt PowerPoint Presentation Infographics File Formats
This is a cash flow statement kpis tabular form ppt powerpoint presentation infographics file formats. This is a four stage process. The stages in this process are operations, investing activities, financing activities, net increase in cash.

P And L Kpis Template 1 Ppt PowerPoint Presentation Slides Show
This is a p and l kpis template 1 ppt powerpoint presentation slides show. This is a four stage process. The stages in this process are other income, total income, expenses, other expenses, depreciation expense.
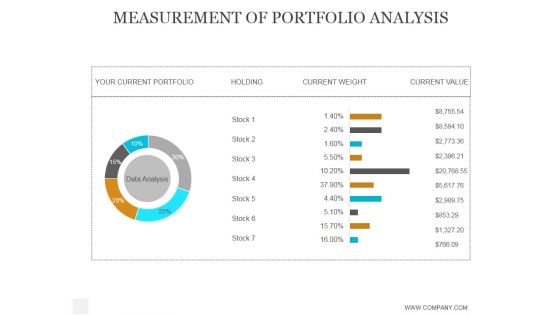
Measurement Of Portfolio Analysis Ppt PowerPoint Presentation Inspiration
This is a measurement of portfolio analysis ppt powerpoint presentation inspiration. This is a seven stage process. The stages in this process are business, strategy, marketing, analysis, success, finance.
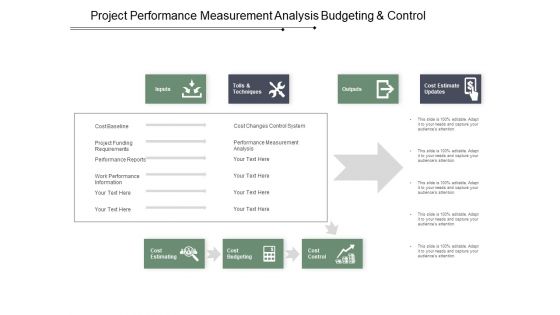
Project Performance Measurement Analysis Budgeting And Control Ppt PowerPoint Presentation Outline Format
This is a project performance measurement analysis budgeting and control ppt powerpoint presentation outline format. This is a three stage process. The stages in this process are cost control, money control, price control.

Portfolio Management Process Ppt PowerPoint Presentation Backgrounds
This is a portfolio management process ppt powerpoint presentation backgrounds. This is a five stage process. The stages in this process are define, analyze, control, improve, measure.

Comparison Ppt PowerPoint Presentation Inspiration Structure
This is a comparison ppt powerpoint presentation inspiration structure. This is a two stage process. The stages in this process are compare, measure, finance, percentage, business.
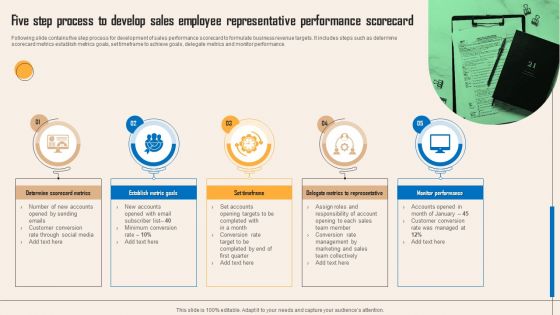
Five Step Process To Develop Sales Employee Representative Performance Scorecard Rules PDF
Following slide contains five step process for development of sales performance scorecard to formulate business revenue targets. It includes steps such as determine scorecard metrics establish metrics goals, set timeframe to achieve goals, delegate metrics and monitor performance. Presenting Five Step Process To Develop Sales Employee Representative Performance Scorecard Rules PDF to dispense important information. This template comprises five stages. It also presents valuable insights into the topics including Determine Scorecard Metrics, Establish Metric Goals, Set Timeframe, Delegate Metrics To Representative, Monitor Performance. This is a completely customizable PowerPoint theme that can be put to use immediately. So, download it and address the topic impactfully.

Crm Dashboard Kpis Ppt PowerPoint Presentation Rules
This is a crm dashboard kpis ppt powerpoint presentation rules. This is a three stage process. The stages in this process are revenue, acquisition, active subscribers.

Process Capability Measurement Ppt PowerPoint Presentation Rules
This is a process capability measurement ppt powerpoint presentation rules. This is a nine stage process. The stages in this process are business, strategy, marketing, success, bar graph, growth strategy.
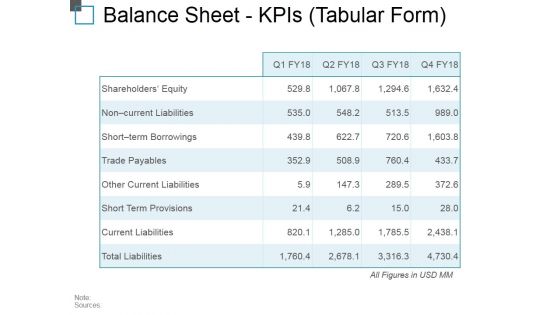
Balance Sheet Kpis Tabular Form Ppt PowerPoint Presentation Outline Background Image
This is a balance sheet kpis tabular form ppt powerpoint presentation outline background image. This is a four stage process. The stages in this process are current assets, current liabilities, total assets, total liabilities.

Balance Sheet Kpis Template 1 Ppt PowerPoint Presentation Layouts Design Ideas
This is a balance sheet kpis template 1 ppt powerpoint presentation layouts design ideas. This is a four stage process. The stages in this process are current assets, current liabilities, total assets, total liabilities.

Process Capability Measurement Tamplate 2 Ppt PowerPoint Presentation Shapes
This is a process capability measurement tamplate 2 ppt powerpoint presentation shapes. This is a eight stage process. The stages in this process are too much variation, good, great, specification.
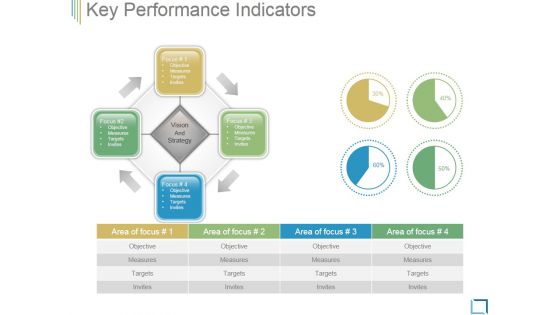
Key Performance Indicators Template 3 Ppt PowerPoint Presentation Samples
This is a key performance indicators template 3 ppt powerpoint presentation samples. This is a four stage process. The stages in this process are objective, measures, targets, invites.
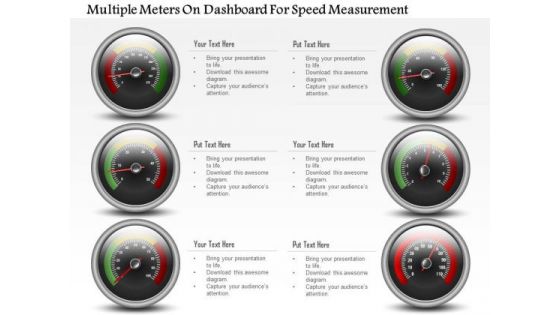
Business Diagram Multiple Meters On Dashboard For Speed Measurement PowerPoint Slide
This business diagram has been designed with multiple meters on dashboard. This slide can be used for business planning and progress. Use this diagram for your business and success milestones related presentations.
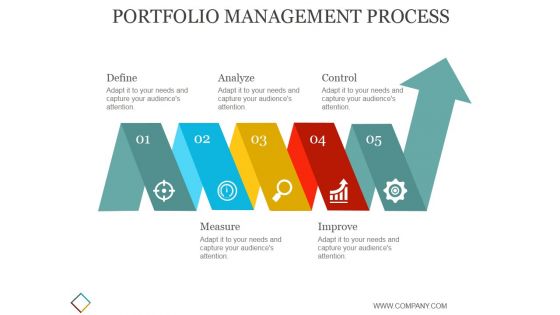
Portfolio Management Process Ppt PowerPoint Presentation Layout
This is a portfolio management process ppt powerpoint presentation layout. This is a five stage process. The stages in this process are define, analyze, control, measure, improve.

Crm Dashboard Kpis Ppt PowerPoint Presentation Infographic Template Designs
This is a crm dashboard kpis ppt powerpoint presentation infographic template designs. This is a three stage process. The stages in this process are active subscribers, acquisition, revenue.

Product Wise Performance Ppt PowerPoint Presentation Visual Aids Outline
This is a product wise performance ppt powerpoint presentation visual aids outline. This is a two stage process. The stages in this process are product wise performance, business, marketing, success.

Key Indicator Cheat Sheet To Evaluate Business Event Return On Investment Template Pdf
The slide displays an indicator cheat sheet that assists event organisers and marketers in calculating event ROI so that they can understand the companys actual cost and return. The elements are the metrics used, i.e., hard metrics and soft metrics, business goals, key indicators, tangible value, etc. Showcasing this set of slides titled Key Indicator Cheat Sheet To Evaluate Business Event Return On Investment Template Pdf The topics addressed in these templates are Business Goal, Metric Category, Revenue KPIS All the content presented in this PPT design is completely editable. Download it and make adjustments in color, background, font etc. as per your unique business setting.

Stakeholder Engagement Assessment For Project Management Services Graphics PDF
The following slide exhibits key metrics for evaluating service supply chain performance which can be used to track processes and fulfil company objectives.It covers assessment areas, criteria and performance metrics. Showcasing this set of slides titled Stakeholder Engagement Assessment For Project Management Services Graphics PDF. The topics addressed in these templates are Communications, Financial Administration, Employment. All the content presented in this PPT design is completely editable. Download it and make adjustments in color, background, font etc. as per your unique business setting.

Chart With Magnifying Glass For Business Research Ppt PowerPoint Presentation Inspiration Shapes
This is a chart with magnifying glass for business research ppt powerpoint presentation inspiration shapes. This is a two stage process. The stages in this process are metrics icon, kpis icon, statistics icon.
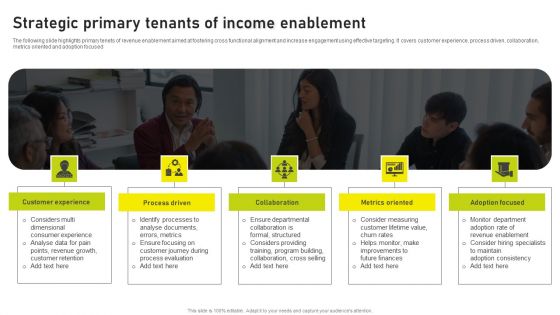
Strategic Primary Tenants Of Income Enablement Background PDF
The following slide highlights primary tenets of revenue enablement aimed at fostering cross functional alignment and increase engagement using effective targeting. It covers customer experience, process driven, collaboration, metrics oriented and adoption focused. Persuade your audience using this Strategic Primary Tenants Of Income Enablement Background PDF. This PPT design covers five stages, thus making it a great tool to use. It also caters to a variety of topics including Process Driven, Collaboration, Metrics Oriented. Download this PPT design now to present a convincing pitch that not only emphasizes the topic but also showcases your presentation skills.
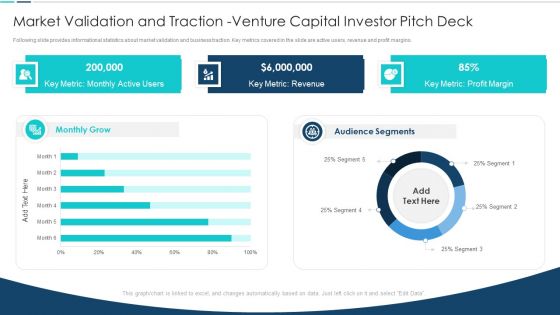
Market Validation And Traction Venture Capital Investor Pitch Deck Microsoft PDF
Following slide provides informational statistics about market validation and business traction. Key metrics covered in the slide are active users, revenue and profit margins. Deliver an awe inspiring pitch with this creative Market Validation And Traction Venture Capital Investor Pitch Deck Microsoft PDF bundle. Topics like Monthly Grow Segment, Audience Segments Monthly, Key Metric Revenue, Key Metric Profit can be discussed with this completely editable template. It is available for immediate download depending on the needs and requirements of the user.

Market Validation And Traction Private Equity Funding Ppt Portfolio Smartart PDF
Following slide provides informational statistics about market validation and business traction. Key metrics covered in the slide are active users, revenue and profit margins. Deliver an awe inspiring pitch with this creative alidation And Traction Private Equity Funding Ppt Portfolio Smartart PDF bundle. Topics like Monthly Grow Segment, Audience Segments Monthly, Key Metric Revenue, Key Metric Profit can be discussed with this completely editable template. It is available for immediate download depending on the needs and requirements of the user.
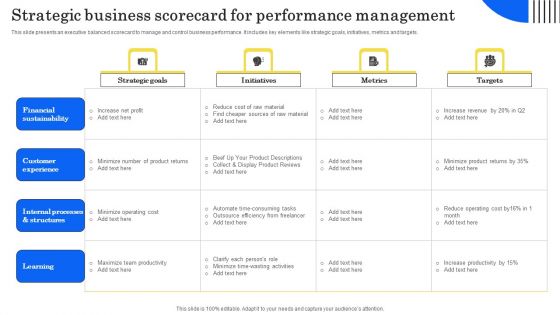
Strategic Business Scorecard For Performance Management Infographics PDF
This slide presents an executive balanced scorecard to manage and control business performance. It includes key elements like strategic goals, initiatives, metrics and targets. Showcasing this set of slides titled Strategic Business Scorecard For Performance Management Infographics PDF.Q The topics addressed in these templates are Financial Sustainability, Customer Experience, Internal Processes Structures. All the content presented in this PPT design is completely editable. Download it and make adjustments in color, background, font etc. as per your unique business setting.
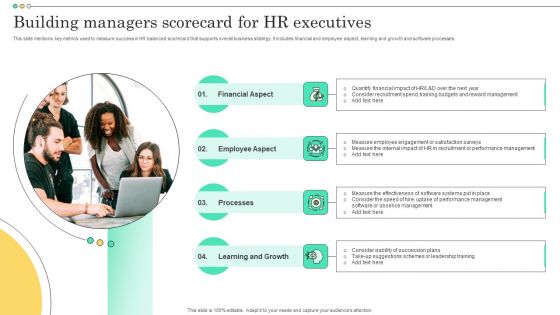
Building Managers Scorecard For HR Executives Ideas PDF
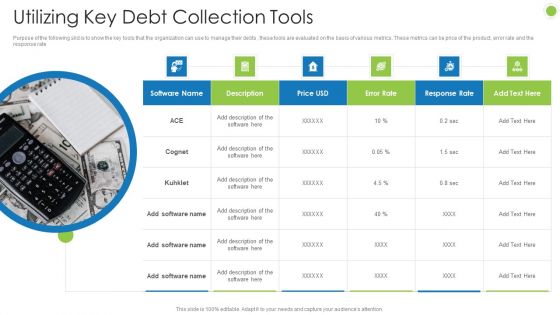
Debt Retrieval Techniques Utilizing Key Debt Collection Tools Ppt Model Graphics Template PDF
Purpose of the following slid is to show the key tools that the organization can use to manage their debts , these tools are evaluated on the basis of various metrics. These metrics can be price of the product, error rate and the response rate This is a debt retrieval techniques utilizing key debt collection tools ppt model graphics template pdf template with various stages. Focus and dispense information on six stages using this creative set, that comes with editable features. It contains large content boxes to add your information on topics like utilizing key debt collection tools. You can also showcase facts, figures, and other relevant content using this PPT layout. Grab it now.
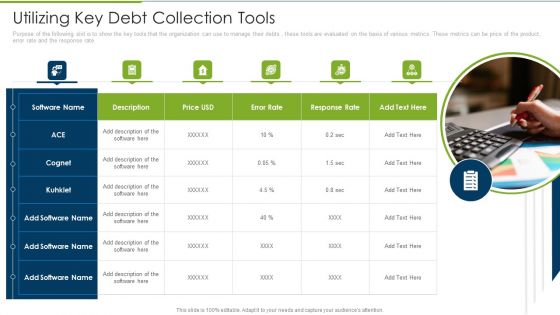
Debt Collection Improvement Plan Utilizing Key Debt Collection Tools Introduction PDF
Purpose of the following slid is to show the key tools that the organization can use to manage their debts , these tools are evaluated on the basis of various metrics. These metrics can be price of the product, error rate and the response rate. This is a debt collection improvement plan utilizing key debt collection tools introduction pdf template with various stages. Focus and dispense information on six stages using this creative set, that comes with editable features. It contains large content boxes to add your information on topics like price usd, error rate, response rate. You can also showcase facts, figures, and other relevant content using this PPT layout. Grab it now.

Corporate Organization Playbook Purpose Of Corporate Organization Playbook Ppt Ideas PDF
Presenting corporate organization playbook purpose of corporate organization playbook ppt ideas pdf to provide visual cues and insights. Share and navigate important information on five stages that need your due attention. This template can be used to pitch topics like basic structure, organization and define, roles and responsibilities, business metrics and measure. In addtion, this PPT design contains high resolution images, graphics, etc, that are easily editable and available for immediate download.

Cyber Network Simulation Platform Capital Funding Pitch Deck Why Invest In Our Product Ideas PDF
For any pith deck , defining key metrics that provide a clear overview of the business is a crucial point, thus in this slide we have provided you with such key metrics that compel the investor to provide funds, these metrics are high demand, aggressive growth, stable and growing economics and exclusive content Deliver an awe inspiring pitch with this creative cyber network simulation platform capital funding pitch deck why invest in our product ideas pdf bundle. Topics like exclusive content, stable and growing economics, aggressive growth can be discussed with this completely editable template. It is available for immediate download depending on the needs and requirements of the user.

Computer Mediated Reality Investor Funding Elevator Why Invest In Our Product Download PDF
For any pith deck , defining key metrics that provide a clear overview of the business is a crucial point, thus in this slide we have provided you with such key metrics that compel the investor to provide funds, these metrics are high demand, aggressive growth, stable and growing economics and exclusive content. Deliver an awe inspiring pitch with this creative computer mediated reality investor funding elevator why invest in our product download pdf bundle. Topics like high demand, stable and growing economics, exclusive content, aggressive growth can be discussed with this completely editable template. It is available for immediate download depending on the needs and requirements of the user.

Cyberspace Simulation Platform Fundraising Elevator Why Invest In Our Product Demonstration PDF
For any pith deck, defining key metrics that provide a clear overview of the business is a crucial point, thus in this slide we have provided you with such key metrics that compel the investor to provide funds, these metrics are high demand, aggressive growth, stable and growing economics and exclusive content. Deliver an awe inspiring pitch with this creative cyberspace simulation platform fundraising elevator why invest in our product demonstration pdf bundle. Topics like exclusive content, stable and growing economics, aggressive growth can be discussed with this completely editable template. It is available for immediate download depending on the needs and requirements of the user.

Artificial Intelligence Gaming Industry Fund Raising Elevator Why Invest In Our Product Growing Demonstration PDF
For any pith deck , defining key metrics that provide a clear overview of the business is a crucial point, thus in this slide we have provided you with such key metrics that compel the investor to provide funds, these metrics are high demand, aggressive growth, stable and growing economics and exclusive content Deliver an awe inspiring pitch with this creative artificial intelligence gaming industry fund raising elevator why invest in our product growing demonstration pdf bundle. Topics like why invest in our product can be discussed with this completely editable template. It is available for immediate download depending on the needs and requirements of the user.
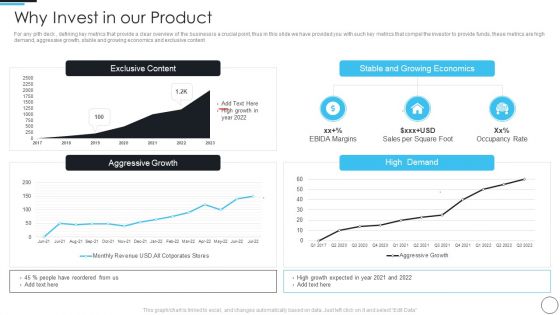
Artificial Intelligence Gaming Industry Fund Raising Elevator Why Invest In Our Product Diagrams PDF
For any pith deck , defining key metrics that provide a clear overview of the business is a crucial point, thus in this slide we have provided you with such key metrics that compel the investor to provide funds, these metrics are high demand, aggressive growth, stable and growing economics and exclusive content Deliver and pitch your topic in the best possible manner with this artificial intelligence gaming industry fund raising elevator why invest in our product diagrams pdf. Use them to share invaluable insights on why invest in our product and impress your audience. This template can be altered and modified as per your expectations. So, grab it now.

Weekly Marketing Investment Report Dashboard Ideas PDF
This slide illustrates the overview of advertising expenditure weekly performance metrics. It incorporate total budget spent and estimated for advertising, estimated and actual registration, revenue, conversion metrics rates etc. Showcasing this set of slides titled Weekly Marketing Investment Report Dashboard Ideas PDF. The topics addressed in these templates are Conversion Metrics, Quality Of Traffic, Quality Of Transaction. All the content presented in this PPT design is completely editable. Download it and make adjustments in color, background, font etc. as per your unique business setting.
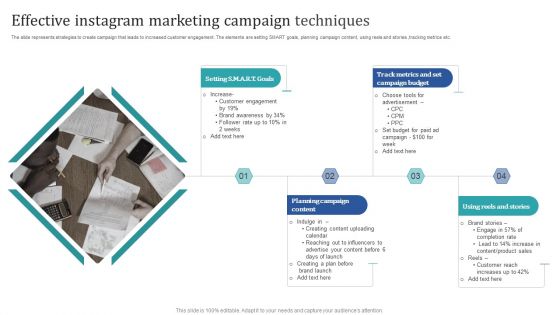
Effective Instagram Marketing Campaign Techniques Designs PDF
The slide represents strategies to create campaign that leads to increased customer engagement. The elements are setting SMART goals, planning campaign content, using reels and stories, tracking metrics etc. Persuade your audience using this Effective Instagram Marketing Campaign Techniques Designs PDF. This PPT design covers Four stages, thus making it a great tool to use. It also caters to a variety of topics including Planning Campaign Content, Using Reels And Stories. Download this PPT design now to present a convincing pitch that not only emphasizes the topic but also showcases your presentation skills.
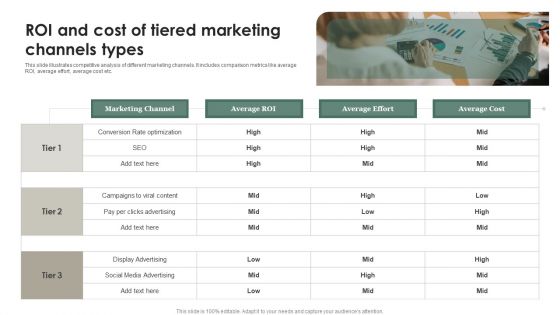
ROI And Cost Of Tiered Marketing Channels Types Professional PDF
This slide illustrates competitive analysis of different marketing channels. It includes comparison metrics like average ROI, average effort, average cost etc. Persuade your audience using this ROI And Cost Of Tiered Marketing Channels Types Professional PDF. This PPT design covers four stages, thus making it a great tool to use. It also caters to a variety of topics including Marketing Channel, Average ROI, Average Effort. Download this PPT design now to present a convincing pitch that not only emphasizes the topic but also showcases your presentation skills.
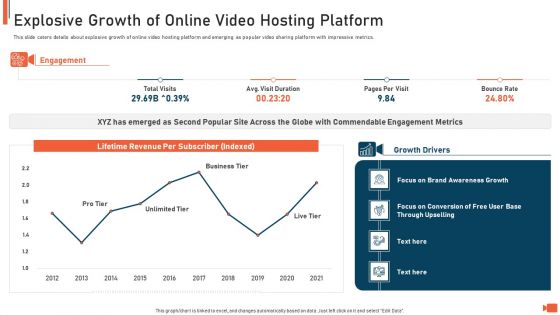
Online Video Streaming Site Capital Raising Elevator Explosive Growth Of Online Video Hosting Platform Topics PDF
This slide caters details about explosive growth of online video hosting platform and emerging as popular video sharing platform with impressive metrics. Deliver an awe inspiring pitch with this creative online video streaming site capital raising elevator explosive growth of online video hosting platform topics pdf bundle. Topics like awareness, growth, revenue, metrics can be discussed with this completely editable template. It is available for immediate download depending on the needs and requirements of the user.
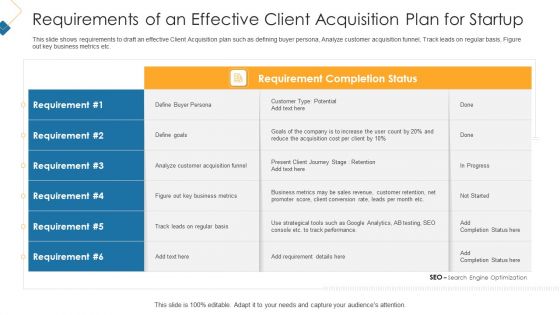
Requirements Of An Effective Client Acquisition Plan For Startup Inspiration PDF
This slide shows requirements to draft an effective Client Acquisition plan such as defining buyer persona, Analyze customer acquisition funnel, Track leads on regular basis, Figure out key business metrics etc. Deliver an awe inspiring pitch with this creative requirements of an effective client acquisition plan for startup inspiration pdf bundle. Topics like sales, revenue, business, metrics, customer can be discussed with this completely editable template. It is available for immediate download depending on the needs and requirements of the user.
Professional Scrum Master Training IT Risk Monitoring Dashboard For Software Development Projects Icons PDF
Following slide displays risk monitoring KPI dashboard that can be used by a firm to track multiple risk events. Metrics covered in the dashboard are residual risk by period and category by total risk rating. Deliver an awe inspiring pitch with this creative professional scrum master training it risk monitoring dashboard for software development projects icons pdf bundle. Topics like financial risk, people risk, governance risk, competitive risk, system or technology can be discussed with this completely editable template. It is available for immediate download depending on the needs and requirements of the user.

KPI Dashboard To Track Security Risk Events Ppt Pictures Deck PDF
This slide displays KPI dashboard that company will use to track multiple risk events. Metrics covered in the dashboard are residual risks by period and risk category by total risk rating. Deliver and pitch your topic in the best possible manner with this kpi dashboard to track security risk events ppt pictures deck pdf. Use them to share invaluable insights on technology risk, system, financial risk and impress your audience. This template can be altered and modified as per your expectations. So, grab it now.
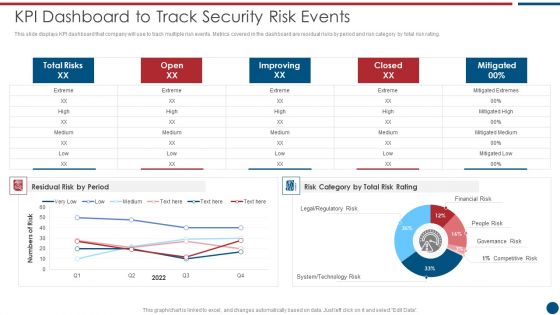
Risk Based Procedures To IT Security KPI Dashboard To Track Security Risk Events Designs PDF

Vendor Performance Analysis And Administration Supplier Assessment Criteria To Optimize Procurement Performance Themes PDF
The following slide highlights various KPI metrics to evaluate vendor performance for enhancing procurement process. It provides details about criteria such as quality, price cost, performance delivery, service, financial strength and lead time. From laying roadmaps to briefing everything in detail, our templates are perfect for you. You can set the stage with your presentation slides. All you have to do is download these easy to edit and customizable templates. Vendor Performance Analysis And Administration Supplier Assessment Criteria To Optimize Procurement Performance Themes PDF will help you deliver an outstanding performance that everyone would remember and praise you for. Do download this presentation today.

Industry Wise Email Marketing Performance Statistics Analysis Graphics PDF
This slide includes email marketing benchmarks and statistics for the year 2022 based on various industries. It includes email metrics such as open rate, CTR, unsubscribes rate in industries like automobile, finance, retail, food, legal services, etc. Pitch your topic with ease and precision using this Industry Wise Email Marketing Performance Statistics Analysis Graphics PDF. This layout presents information on Automobile, Financial Service, Legal Services. It is also available for immediate download and adjustment. So, changes can be made in the color, design, graphics or any other component to create a unique layout.
Consumer Lead Generation Process Enhanced Lead Performance Tracking Dashboard Portrait PDF
This slide covers the KPI dashboard for tracking improved lead management system performance. It includes metrics such as visitors, social media followers, email subscribers, organic leads, etc. Slidegeeks is here to make your presentations a breeze with Consumer Lead Generation Process Enhanced Lead Performance Tracking Dashboard Portrait PDF With our easy-to-use and customizable templates, you can focus on delivering your ideas rather than worrying about formatting. With a variety of designs to choose from, youre sure to find one that suits your needs. And with animations and unique photos, illustrations, and fonts, you can make your presentation pop. So whether youre giving a sales pitch or presenting to the board, make sure to check out Slidegeeks first.

 Home
Home