Financial Literacy

Lower Costs Powerpoint Show
This is a lower costs powerpoint show. This is a six stage process. The stages in this process are learning and growth perspective, lower costs, product offering, financial perspective, customer perspective, business process perspective.
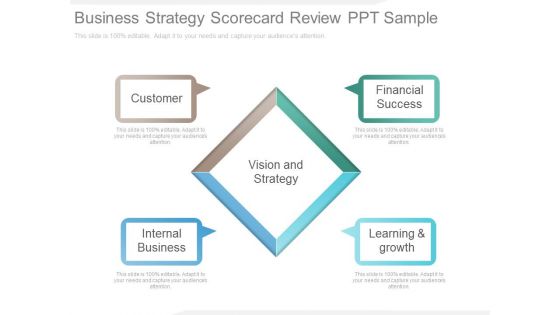
Business Strategy Scorecard Review Ppt Sample
This is a business strategy scorecard review ppt sample. This is a five stage process. The stages in this process are customer, internal business, vision and strategy, financial success, learning and growth.

Clear Point Community Dashboard Example Ppt Slide
This is a clear point community dashboard example ppt slide. This is a four stage process. The stages in this process are internal perspective, learning and growth, financial perspective, customer perspective.

Cost Management System Diagram Ppt Slide Show
This is a cost management system diagram ppt slide show. This is a seven stage process. The stages in this process are research and development, quality control, marketing, financial accounting, production reporting, inventory management, production planning and scheduling, cost accounting.

Economic Empowerment And Enforcement Example Ppt Slides
This is a economic empowerment and enforcement example ppt slides. This is a four stage process. The stages in this process are education and training, financial assistance, career planning, mentors networking.

Business Diagram Mobile Applications Vector Illustration Concept Presentation Template
As mobile have become an indispensible part of our daily lives. This amazing mobile application icons will also add great value to your ideas and presentations in the fields of telecommunications, travelling, banks and financial institutions, e-Learning etc.

Customer Relationship Powerpoint Slide Background Designs
This is a customer relationship powerpoint slide background designs. This is a five stage process. The stages in this process are internal processes, financial measures, learning and growth, traditional strategic management, customer relationship.

Business Process Perspective Powerpoint Show
This is a business process perspective powerpoint show. This is a six stage process. The stages in this process are learning and growth perspective, lower costs, product offering, financial perspective, customer perspective, business process perspective.

Clear Point Strategy Dashboard Ppt Presentation
This is a clear point strategy dashboard ppt presentation. This is a four stage process. The stages in this process are financial perspective, internal processes perspective, learning and growth perspective, customer perspective.
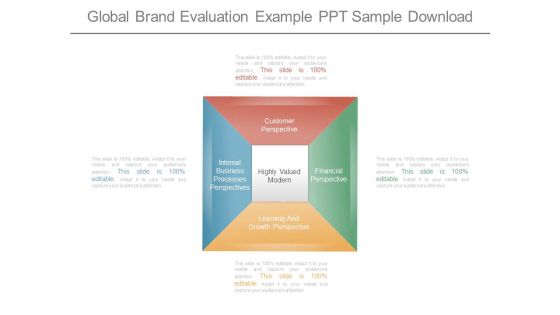
Global Brand Evaluation Example Ppt Sample Download
This is a global brand evaluation example ppt sample download. This is a four stage process. The stages in this process are customer perspective, internal business processes perspectives, highly valued modern, financial perspective, learning and growth perspective.
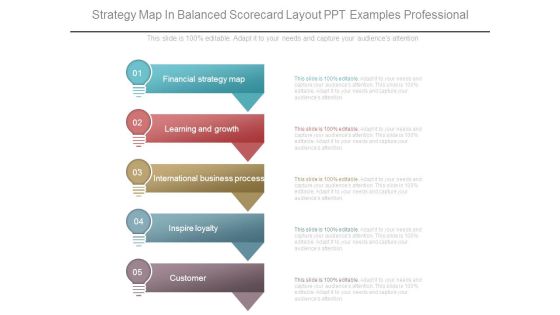
Strategy Map In Balanced Scorecard Layout Ppt Examples Professional
This is a strategy map in balanced scorecard layout ppt examples professional. This is a five stage process. The stages in this process are financial strategy map, learning and growth, international business process, inspire loyalty, customer.

Balanced Scorecard Perspectives Diagram Powerpoint Slide Ideas
This is a balanced scorecard perspectives diagram powerpoint slide ideas. This is a four stage process. The stages in this process are financial perspective, customer perspective, internal perspective, learning and growth perspective.

Balanced Scorecard Perspectives Example Presentation Graphics
This is a balanced scorecard perspectives example presentation graphics. This is a five stage process. The stages in this process are financial perspective, customer perspective, internal process perspective, finance, learning and growth.

Balanced Scorecard Strategy Map Template Example Of Ppt
This is a balanced scorecard strategy map template example of ppt. This is a four stage process. The stages in this process are financial perspective, customer perspective, internal perspective, learning and growth perspective.

Goals And Objectives Of Strategic Planning Ppt Slides
This is a goals and objectives of strategic planning ppt slides. This is a five stage process. The stages in this process are strategic goals, mission, customer perspective, learning and growth perspective, financial perspective.

Benefits Of Internet Ppt Example Ppt Presentation
This is a benefits of internet ppt example ppt presentation. This is a five stage process. The stages in this process are financial transaction, for updates, education, research, communication.
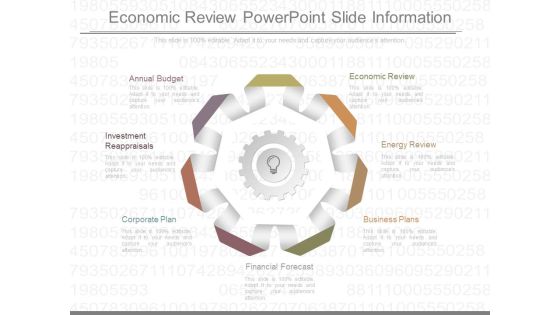
Economic Review Powerpoint Slide Information
This is a economic review powerpoint slide information. This is a seven stage process. The stages in this process are annual budget, investment reappraisals, corporate plan, economic review, energy review, business plans, financial forecast.
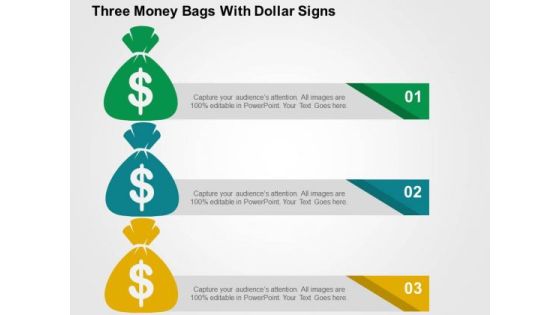
Three Money Bags With Dollar Signs PowerPoint Templates
This unique template displays diagram of three money bags with dollar symbol. This professional slide helps to represent financial planning and execution. This graphic slide is an effective tool to make your clients understand the topic.

Budget Report Template Powerpoint Slide Design Ideas
This is a budget report template powerpoint slide design ideas. This is a four stage process. The stages in this process are expenses, income, financial statements, equity, balance sheet.

Business Diagram Line Graph For Dollar Growth Presentation Template
Graphic of dollar symbol and growth arrow has been used to design this power point template. This diagram contains the concept of financial result analysis. Use this business diagram for finance related presentations
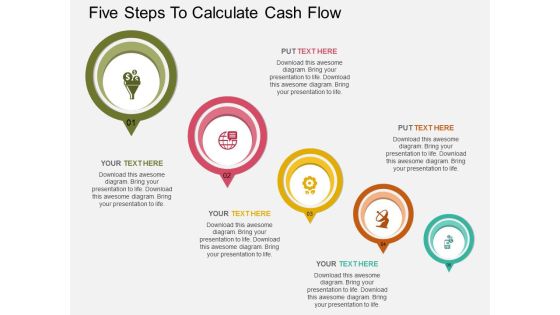
Five Steps To Calculate Cash Flow Powerpoint Template
This PPT slide has been designed with circles and financial icons. This template is designed to display finance and investment related topics. This professional slide helps in making an instant impact on viewers.
Dollar Euro Pound And Yen Currency Symbols With Finance Icons Powerpoint Template
Our above PowerPoint template diagram provides infographic layout to display financial planning. This diagram provides an effective way of displaying information you can edit text, color, shade and style as per you need.

0814 Bargraph Of Dollars Bundles With Arrow Graphic Image Graphics For PowerPoint
This unique image has backdrop of bar graph of dollars bundles with growth arrow. This image displays the concept of financial growth. Define the business growth with this suitable image. Use this image to make outstanding presentations

0814 Global Success Concept Globe And Golden Coins Graphic Image Graphics For PowerPoint
Explain the concept of global success with our exclusive image. This image contains increasing stack of coins with globe. Download this image for business and sales presentations where you have to focus on financial growth.

Stock Photo Red Growth Arrow With Percentage Symbol PowerPoint Slide
This image has been designed with red growth arrow with percentage symbol. This Image clearly relates to concept of financial growth. Use our image to drive the point to your audience and constantly attract their attention.
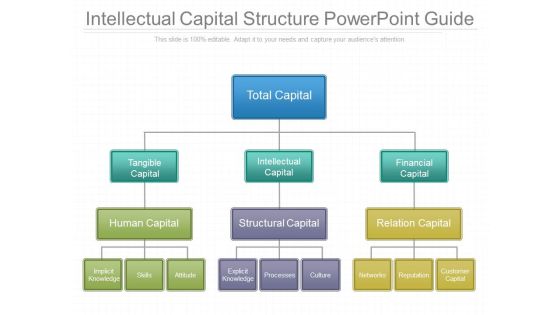
Intellectual Capital Structure Powerpoint Guide
This is a intellectual capital structure powerpoint guide. This is a one stage process. The stages in this process are total capital, tangible capital, intellectual capital, financial capital, human capital, structural capital, relation capital.
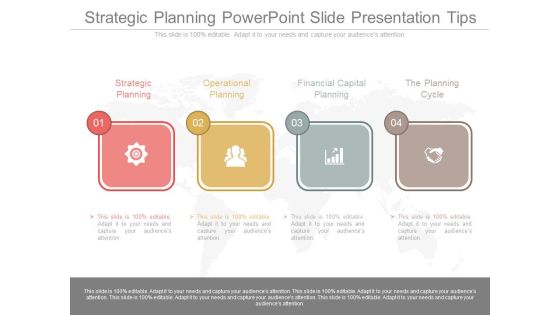
Strategic Planning Powerpoint Slide Presentation Tips
This is a strategic planning powerpoint slide presentation tips. This is a four stage process. The stages in this process are strategic planning, operational planning, financial capital planning, the planning cycle.

Stock Photo Graphics Of Padlock With Us Dollar Pwerpoint Slide
This business image has been designed with graphic of padlock with US dollar. This image contains the concept of finance and security. Make a quality presentation for financial security.
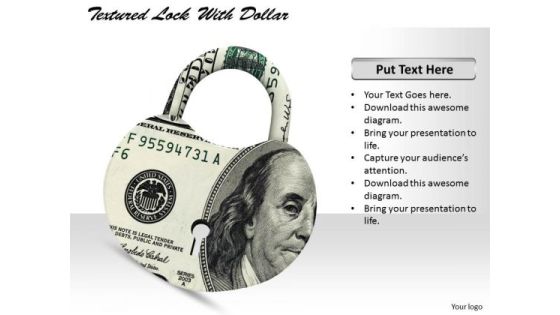
Stock Photo Textured Lock With Us Dollar Pwerpoint Slide
This business image has been designed with graphic of textured lock with US dollar. This image contains the concept of finance and security. Make a quality presentation for financial security.

Laptop Globe Bar Graph Dollar Coins Ppt Slides Graphics
Icons of laptop, globe and bar graph with dollar coins have been used to design this icon PPT slide. Download these icons to display concepts of technology and financial growth. Use this slide to build an exclusive presentation.
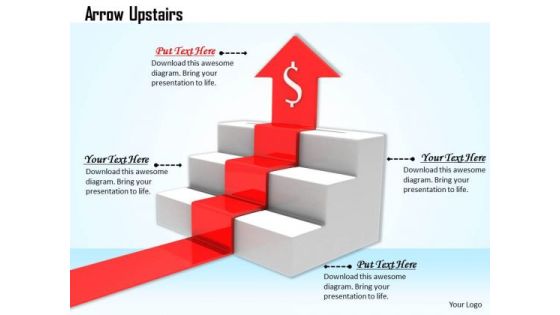
Stock Photo Red Arrow Moving Upwards In Stairs PowerPoint Slide
This image has been designed with red arrow moving upward on stairs with dollar symbol. This Image clearly relates to concept of financial growth. Use our image to drive the point to your audience and constantly attract their attention.
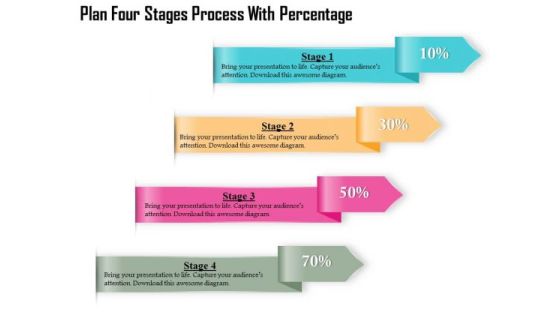
Business Diagram Four Stages Process With Percentage Presentation Template
Four multicolored tags in vertical order has been used to decorate this business diagram. This diagram contains the concept of financial data display with percent values. This diagram can be used for management and finance related presentations.

Business Diagram Three Stages Process Percentage Presentation Template
Three multicolored tags in vertical order has been used to decorate this business diagram. This diagram contains the concept of financial data display with percent values. This diagram can be used for management and finance related presentations.
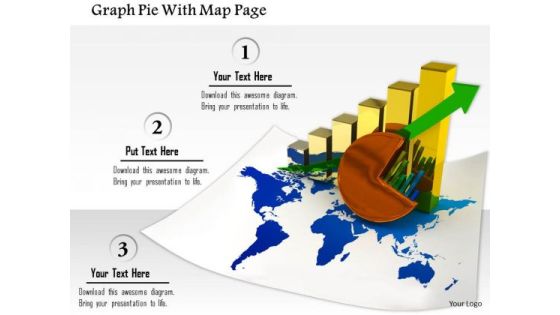
Stock Photo Graph Pie With Map Page PowerPoint Slide
This image slide contains business charts on world map. This image is designed with bar graph and pie chart on world map depicting global economy. Use this image slide to represent financial growth in any business presentation.

Stock Photo Green Numbers Of 2015 On Dollars PowerPoint Slide
Green numbers of 2015 year and dollars has been used to decorate this power point template slide. This image slide contains the concept of year based financial planning. Display planning in your finance and business related presentations.
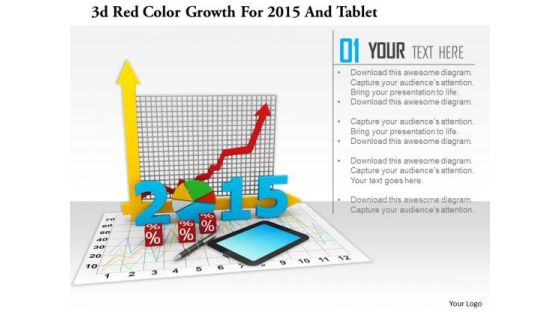
Stock Photo 3d Red Color Growth For 2015 And Tablet PowerPoint Slide
This image slide has graphics of financial charts and reports. This contains bar graph and pie chart to present business reports. Build an innovative presentation using this professional image slide.
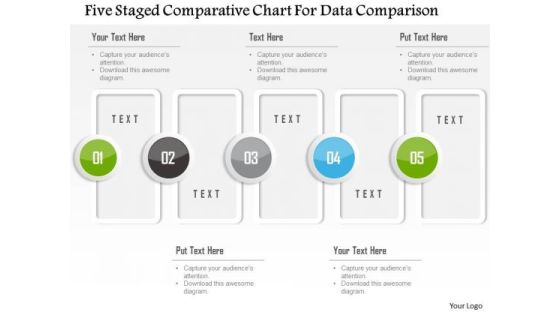
Business Diagram Five Staged Comparative Chart For Data Comparison Presentation Template
Five staged comparative chart has been used to design this power point template. This PPT contains the concept of data comparison. Use this PPT for your business and finance based data comparison in any financial presentation.
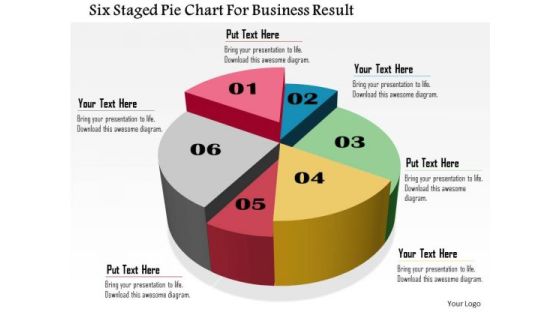
Business Daigram Six Staged Pie Chart For Business Result Presentation Templets
Six staged pie chart is used to design this business slide. Download this diagram to make business and financial reports. Use our above diagram to express information in a visual way.
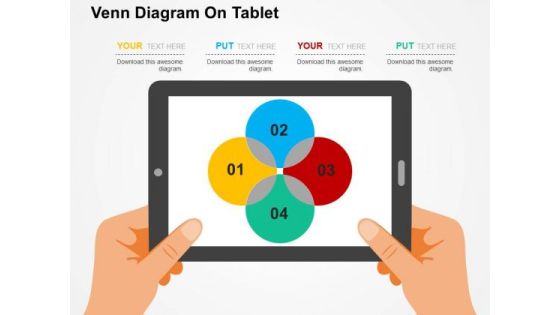
Venn Diagram On Tablet PowerPoint Template
Adjust the above image into your Presentations to visually support your content. This slide has been professionally designed with Venn diagram. This template offers an excellent background to display financial analysis.

Circular Flow Of Income Chart Ppt Presentation
This is a circular flow of income chart ppt presentation. This is a four stage process. The stages in this process are real estate, government, financial institutions, export import, firms.

Benefits Of Big Data Cloud Services Ppt Slides
This is a benefits of big data cloud services ppt slides. This is a seven stage process. The stages in this process are industry data, financial data, weather data, commodities data, edw, erp, crm, cloud based big data.
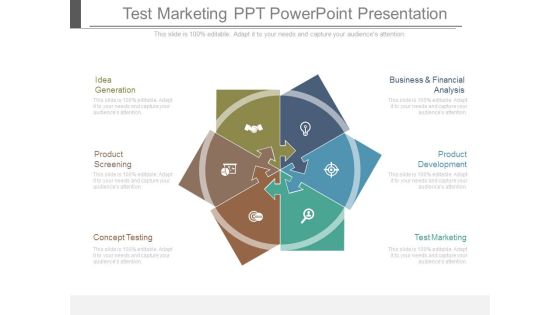
Test Marketing Ppt Powerpoint Presentation
This is a test marketing ppt powerpoint presentation. This is a six stage process. The stages in this process are idea generation, product screening, concept testing, business and financial analysis, product development, test marketing.
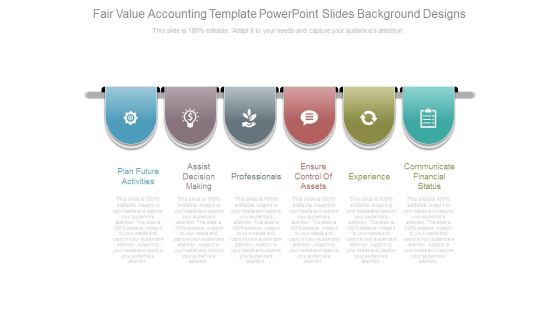
Fair Value Accounting Template Powerpoint Slides Background Designs
This is a fair value accounting template powerpoint slides background designs. This is a six stage process. The stages in this process are plan future activities, assist decision making, professionals, ensure control of assets, experience, communicate financial status.
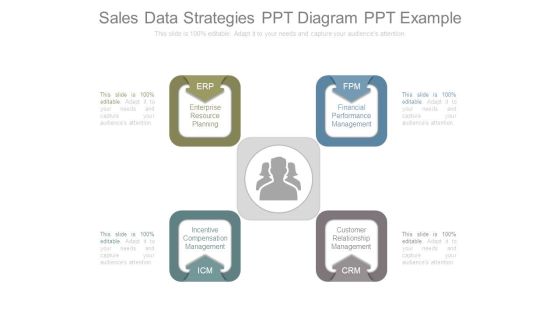
Sales Data Strategies Ppt Diagram Ppt Example
This is a sales data strategies ppt diagram ppt example. This is a four stage process. The stages in this process are enterprise resource planning, financial performance management, incentive compensation management, customer relationship management.
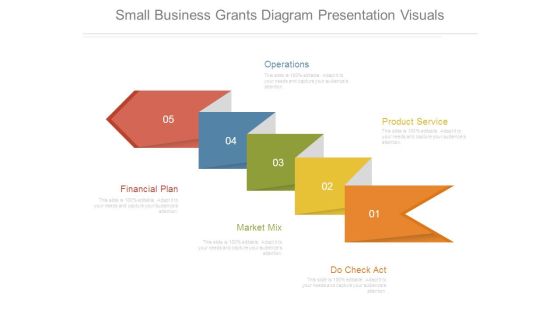
Small Business Grants Diagram Presentation Visuals
This is a small business grants diagram presentation visuals. This is a five stage process. The stages in this process are operations, product service, financial plan, market mix, do check act.

Corporate Balanced Scorecard Diagram Ppt Diagrams
This is a corporate balanced scorecard diagram ppt diagrams. This is a five stage process. The stages in this process are financial perspective, customer perspective, internal processes, growth, internal metrics, balanced scorecard.

Short Term Vs Long Term Objectives Ppt PowerPoint Presentation Graphics
This is a short term vs long term objectives ppt powerpoint presentation graphics. This is a two stage process. The stages in this process are long term objectives, financial plan.

Consulting Slides 3 Stages Of Business Process Business Presentation
This Linear Flow diagram is a powerful tool for financial systems as well as business processed and marketing. Lay down the fundamentals to build upon and lead the way to spread good cheer to one and all.

3d Man On The Top Of Puzzle Bar Graph
This PPT has been designed with graphic of 3d man and puzzle are graph. This PPT displays the concept of result analysis and financial growth. Use this PPT for your business and finance related presentations.
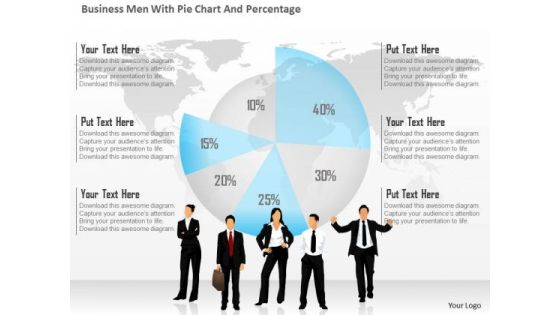
Business Diagram Business Men With Pie Chart And Percentage Presentation Template
This business diagram has been designed with graphic of business people and pie chart with percentage. This diagram is designed to depict team meeting on financial matter. This diagram offers a way for your audience to visually conceptualize the process.
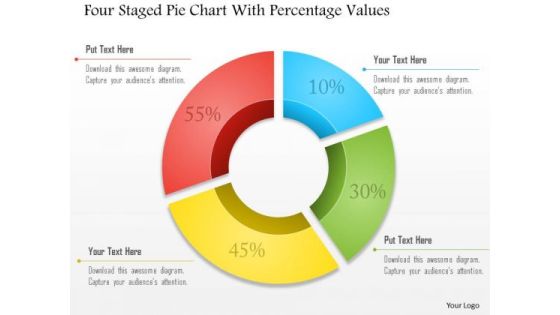
Business Diagram Four Staged Pie Chart With Percentage Values Presentation Template
Four staged pie chart and percentage values are used to design this business slide. Download this diagram to make business and financial reports. Use our above diagram to express information in a visual way.
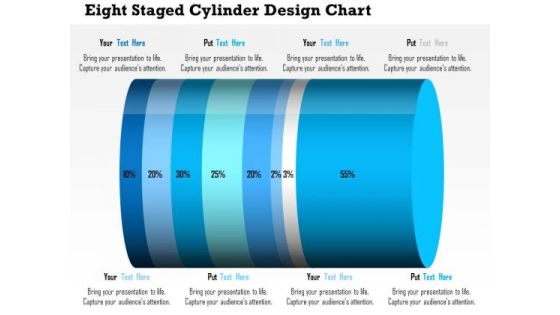
Business Daigram Eight Staged Cylinder Design Chart Presentation Templets
This business diagram contains eight staged cylinder design chart with percentage ratio. Download this diagram to display financial analysis. Use this diagram to make business and marketing related presentations.
Four Icons In Vertical Order PowerPoint Template
Concept of financial planning can be explained with this diagram. It contains graphics of four icons in vertical order. You can use this design to complement your business presentation.

Growth Graph With Design Elements PowerPoint Templates
The above template displays growth bar graph. This PowerPoint template signifies the concept of business and financial planning. Adjust the above diagram in your business presentations to visually support your content.
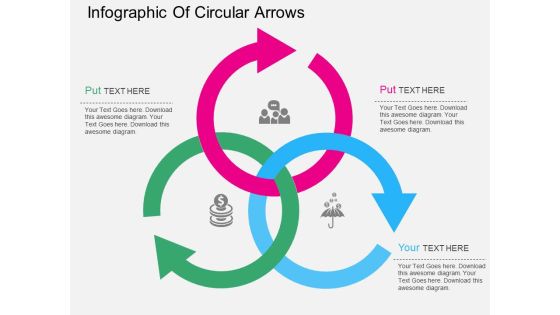
Infographic Of Circular Arrows Powerpoint Templates
This PPT slide has been designed with intersecting circular arrows. This PowerPoint template is suitable to present financial strategy for business. This professional slide helps in making an instant impact on viewers.

Four Directional Arrows Road Infographics Powerpoint Template
Download this exclusive business diagram to present four steps of financial reporting. This slide contains the four directional arrows road infographic. This PPT diagram slide is useful for business presentations.
Four Twisted Arrows With Creative Icons Powerpoint Template
This PowerPoint template has been designed with four twisted arrows and creative icons. This business diagram helps to exhibit financial accounting systems. Use this diagram to build an exclusive presentation.
Roadmap With Year Based Timeline And Icons Powerpoint Slides
This infographic roadmap template can be used for multiple purposes including financial planning, new milestones and tasks. It contains year based timeline diagram. Download this PowerPoint timeline template to make impressive presentations.

Three Human Faces In Question Mark Shape Powerpoint Templates
Adjust the above image into your Presentations to visually support your content. This slide has been professionally designed to financial targets. This template offers an excellent background to build impressive presentation.

Three Text Tags With Alphabets Powerpoint Templates
The above template displays a diagram of circular arrows with icons. This diagram has been professionally designed to display steps of financial planning. Capture the attention of your audience.
 Home
Home