AI PPT Maker
Templates
PPT Bundles
Design Services
Business PPTs
Business Plan
Management
Strategy
Introduction PPT
Roadmap
Self Introduction
Timelines
Process
Marketing
Agenda
Technology
Medical
Startup Business Plan
Cyber Security
Dashboards
SWOT
Proposals
Education
Pitch Deck
Digital Marketing
KPIs
Project Management
Product Management
Artificial Intelligence
Target Market
Communication
Supply Chain
Google Slides
Research Services
 One Pagers
All Categories
-
Home
- Customer Favorites
- Financial Kpi
Financial Kpi

Conducting Monetary Inclusion With Mobile Financial Services Branch Scoreboard Dashboard Sample PDF
This slide portrays branch scoreboard dashboard covering metrics such as accounts opened and closed, deposits to goal, accounts by type, expense to budget and referrals by product. Deliver an awe inspiring pitch with this creative Conducting Monetary Inclusion With Mobile Financial Services Branch Scoreboard Dashboard Sample PDF bundle. Topics like Expense Budget, Referrals Product, Deposits To Goal can be discussed with this completely editable template. It is available for immediate download depending on the needs and requirements of the user.

Data Security Financial Services Ppt PowerPoint Presentation Styles Design Templates Cpb Pdf
Presenting this set of slides with name data security financial services ppt powerpoint presentation styles design templates cpb pdf. This is an editable Powerpoint four stages graphic that deals with topics like data metrics inside application to help convey your message better graphically. This product is a premium product available for immediate download and is 100 percent editable in Powerpoint. Download this now and use it in your presentations to impress your audience.
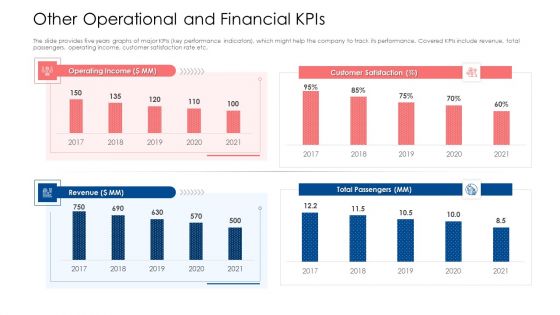
Building Brand Image Of A Railway Firm Other Operational And Financial Kpis Structure PDF
The slide provides five years graphs of major KPIs key performance indicators, which might help the company to track its performance. Covered KPIs include revenue, total passengers, operating income, customer satisfaction rate etc. Deliver and pitch your topic in the best possible manner with this building brand image of a railway firm other operational and financial kpis structure pdf. Use them to share invaluable insights on operating income, customer satisfaction, revenue and impress your audience. This template can be altered and modified as per your expectations. So, grab it now.

Post Implementation Other Operation And Financial Kpis Ppt Infographic Template PDF
The slide provides five years graphs 2020F-2024F forecasted number of major KPIs key performance indicators, that might help to track the performance of ABC Railway. Covered KPIs include Revenue, Total Passengers, operating income, customer satisfaction rate etc. Deliver an awe inspiring pitch with this creative post implementation other operation and financial kpis ppt infographic template pdf bundle. Topics like operating income, revenue, customer satisfaction can be discussed with this completely editable template. It is available for immediate download depending on the needs and requirements of the user.

Business Financial Metrics Data Analysis Ppt PowerPoint Presentation Complete Deck With Slides
Improve your presentation delivery using this business financial metrics data analysis ppt powerpoint presentation complete deck with slides. Support your business vision and objectives using this well-structured PPT deck. This template offers a great starting point for delivering beautifully designed presentations on the topic of your choice. Comprising twenty nine this professionally designed template is all you need to host discussion and meetings with collaborators. Each slide is self-explanatory and equipped with high-quality graphics that can be adjusted to your needs. Therefore, you will face no difficulty in portraying your desired content using this PPT slideshow. This PowerPoint slideshow contains every important element that you need for a great pitch. It is not only editable but also available for immediate download and utilization. The color, font size, background, shapes everything can be modified to create your unique presentation layout. Therefore, download it now.
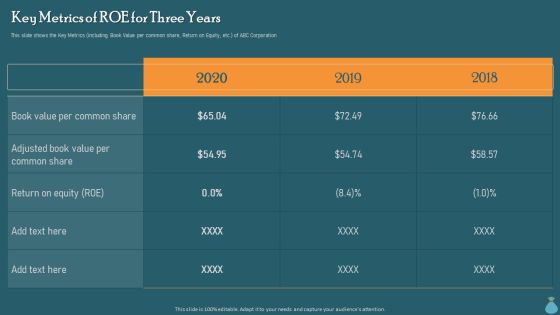
Financial Data Revelation To Varied Stakeholders Key Metrics Of Roe For Three Years Diagrams PDF
This slide shows the Key Metrics including Book Value per common share, Return on Equity, etc. of ABC Corporation. Coming up with a presentation necessitates that the majority of the effort goes into the content and the message you intend to convey. The visuals of a PowerPoint presentation can only be effective if it supplements and supports the story that is being told. Keeping this in mind our experts created Financial Data Revelation To Varied Stakeholders Key Metrics Of Roe For Three Years Diagrams PDF to reduce the time that goes into designing the presentation. This way, you can concentrate on the message while our designers take care of providing you with the right template for the situation.

Financial Forecast And Essential Metrics Ppt PowerPoint Presentation Complete Deck With Slides
Boost your confidence and team morale with this well-structured Financial Forecast And Essential Metrics Ppt PowerPoint Presentation Complete Deck With Slides. This prefabricated set gives a voice to your presentation because of its well-researched content and graphics. Our experts have added all the components very carefully, thus helping you deliver great presentations with a single click. Not only that, it contains a set of twelve slides that are designed using the right visuals, graphics, etc. Various topics can be discussed, and effective brainstorming sessions can be conducted using the wide variety of slides added in this complete deck. Apart from this, our PPT design contains clear instructions to help you restructure your presentations and create multiple variations. The color, format, design anything can be modified as deemed fit by the user. Not only this, it is available for immediate download. So, grab it now.

Financial Deprivation Decline Metrics Ppt PowerPoint Presentation Complete Deck With Slides
Boost your confidence and team morale with this well-structured financial deprivation decline metrics ppt powerpoint presentation complete deck with slides. This prefabricated set gives a voice to your presentation because of its well-researched content and graphics. Our experts have added all the components very carefully, thus helping you deliver great presentations with a single click. Not only that, it contains a set of twelve slides that are designed using the right visuals, graphics, etc. Various topics can be discussed, and effective brainstorming sessions can be conducted using the wide variety of slides added in this complete deck. Apart from this, our PPT design contains clear instructions to help you restructure your presentations and create multiple variations. The color, format, design anything can be modified as deemed fit by the user. Not only this, it is available for immediate download. So, grab it now.

Financial Banking PPT Valuation Summary Along With Stock Price Performance Ideas PDF
The slide provides the target companys valuation summary along with stock price performance 9in comparison with index, key valuation metrics and share price estimates by the brokers for Dec 2021. Deliver and pitch your topic in the best possible manner with this financial banking ppt valuation summary along with stock price performance ideas pdf. Use them to share invaluable insights on target, revenues, valuation metrics and impress your audience. This template can be altered and modified as per your expectations. So, grab it now.
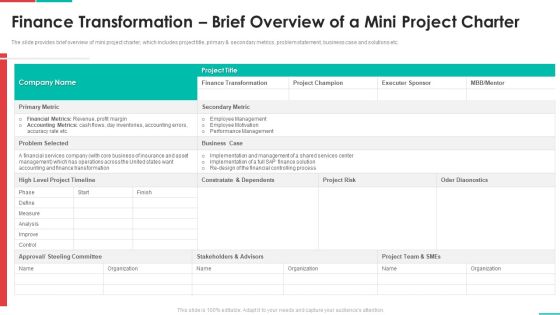
Roadmap For Financial Accounting Transformation Finance Transformation Brief Overview Of A Mini Project Charter Structure PDF
The slide provides brief overview of mini project charter, which includes project title, primary and secondary metrics, problem statement, business case and solutions etc. Deliver and pitch your topic in the best possible manner with this roadmap for financial accounting transformation finance transformation brief overview of a mini project charter structure pdf. Use them to share invaluable insights on finance, executer, organization, business case, primary metric and impress your audience. This template can be altered and modified as per your expectations. So, grab it now.

Financial Transformation Program Work Stream Role Digital Transformation Toolkit Accounting Finance Mockup PDF
This slide shows the work stream program starting from organizational design to planning, metrics and reporting and ending at implementing the data strategy. This is a financial transformation program work stream role digital transformation toolkit accounting finance mockup pdf template with various stages. Focus and dispense information on six stages using this creative set, that comes with editable features. It contains large content boxes to add your information on topics like organizational design, planning, investment, optimization process, metrics and reporting. You can also showcase facts, figures, and other relevant content using this PPT layout. Grab it now.

Consumption Based Pricing Model Our Financial Performance Over The Year Elements PDF
The purpose of the following slide is to analyze the financial performance of the organization. The provided graph highlight the revenues, gross profit and net profit margin of the organization for the year 2016,17,18 and 19. This Consumption Based Pricing Model Key Metrices For Forecasting In Recurring Revenue Model Clipart PDF is perfect for any presentation, be it in front of clients or colleagues. It is a versatile and stylish solution for organizing your meetings. The Consumption Based Pricing Model Key Metrices For Forecasting In Recurring Revenue Model Clipart PDF features a modern design for your presentation meetings. The adjustable and customizable slides provide unlimited possibilities for acing up your presentation. Slidegeeks has done all the homework before launching the product for you. So, do not wait, grab the presentation templates today
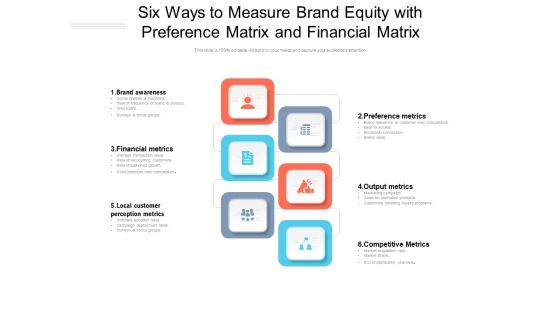
Six Ways To Measure Brand Equity With Preference Matrix And Financial Matrix Ppt PowerPoint Presentation Outline Mockup PDF
Presenting this set of slides with name six ways to measure brand equity with preference matrix and financial matrix ppt powerpoint presentation outline mockup pdf. This is a six stage process. The stages in this process are brand awareness, financial metrics, local customer perception metrics, preference metrics, output metrics, competitive metrics. This is a completely editable PowerPoint presentation and is available for immediate download. Download now and impress your audience.
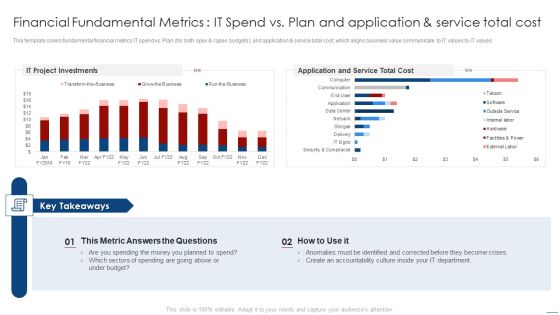
How To Evaluate And Develop The Organizational Value Of IT Service Financial Fundamental Metrics It Spend Structure PDF
This template covers fundamental financial metrics IT spend vs Plan for both opex and capex budgets, and application and service total cost, which aligns business value communicate to IT values to IT values. Deliver an awe inspiring pitch with this creative how to evaluate and develop the organizational value of it service financial fundamental metrics it spend structure pdf bundle. Topics like it project investments, application and service total cost can be discussed with this completely editable template. It is available for immediate download depending on the needs and requirements of the user.

Financial Fundamental Metrics IT Spend Vs Plan And Application And Service Total Cost Ppt Inspiration Good PDF
Deliver an awe inspiring pitch with this creative financial fundamental metrics it spend vs plan and application and service total cost ppt inspiration good pdf bundle. Topics like application, service, cost, accountability, budget can be discussed with this completely editable template. It is available for immediate download depending on the needs and requirements of the user.
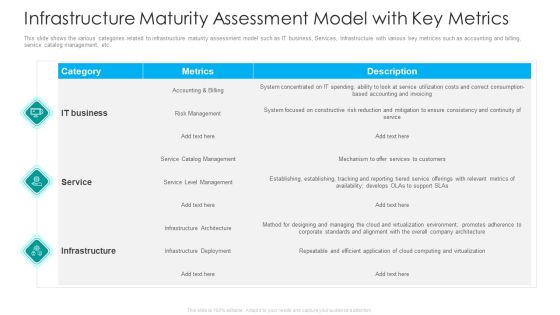
IT Facilities Maturity Framework For Strong Business Financial Position Infrastructure Maturity Assessment Model With Key Metrics Download PDF
This slide shows the various categories related to infrastructure maturity assessment model such as IT business, Services, Infrastructure with various key metrices such as accounting and billing, service catalog management, etc. Deliver an awe inspiring pitch with this creative it facilities maturity framework for strong business financial position infrastructure maturity assessment model with key metrics download pdf bundle. Topics like it business, service, infrastructure, risk management, deployment can be discussed with this completely editable template. It is available for immediate download depending on the needs and requirements of the user.

Security Information And Event Management Strategies For Financial Audit And Compliance Log Management Services Slide2 Structure PDF
This is a security information and event management strategies for financial audit and compliance log management services slide2 structure pdf template with various stages. Focus and dispense information on eight stages using this creative set, that comes with editable features. It contains large content boxes to add your information on topics like log management, configurations, metrics, databases, net working. You can also showcase facts, figures, and other relevant content using this PPT layout. Grab it now.

Company Financials Performance Tracking Dashboard Brochure PDF
This slide illustrates KPI dashboard that can be used by organizations to track their financial performance on company basis. Kpis covered in the slide are contract status, revenue, cost of goods, overdue and task status. Showcasing this set of slides titled Company Financials Performance Tracking Dashboard Brochure PDF. The topics addressed in these templates are Report Shortcut, Revenue Cost, Overdue Task. All the content presented in this PPT design is completely editable. Download it and make adjustments in color, background, font etc. as per your unique business setting.
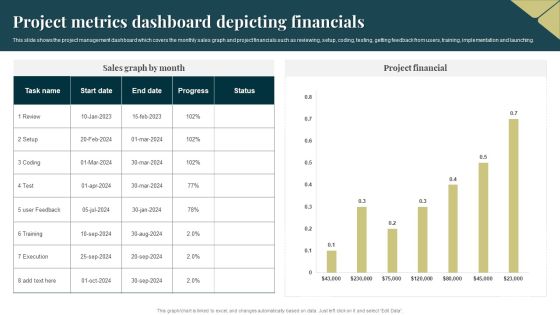
Project Metrics Dashboard Depicting Financials Pictures PDF
This slide shows the project management dashboard which covers the monthly sales graph and project financials such as reviewing, setup, coding, testing, getting feedback from users, training, implementation and launching. Pitch your topic with ease and precision using this Project Metrics Dashboard Depicting Financials Pictures PDF. This layout presents information on Execution, Project Financial. It is also available for immediate download and adjustment. So, changes can be made in the color, design, graphics or any other component to create a unique layout.

Dashboards Related To The Zoo Financials And Operations Guidelines PDF
This slide shows the dashboard or KPI related to the ABC Zoo which includes the forecasted revenue, competitors details, visitors attractions, capital expenditure and many more. Deliver an awe inspiring pitch with this creative dashboards related to the zoo financials and operations guidelines pdf bundle. Topics like dashboards related to the zoo financials and operations can be discussed with this completely editable template. It is available for immediate download depending on the needs and requirements of the user.

Dashboards Related To The Zoo Financials And Operations Diagrams PDF
This slide shows the dashboard or KPI related to the ABC Zoo which includes the forecasted revenue, competitors details, visitors attractions, capital expenditure and many kore. Deliver and pitch your topic in the best possible manner with this dashboards related to the zoo financials and operations diagrams pdf. Use them to share invaluable insights on capital expenditure, revenue and impress your audience. This template can be altered and modified as per your expectations. So, grab it now.
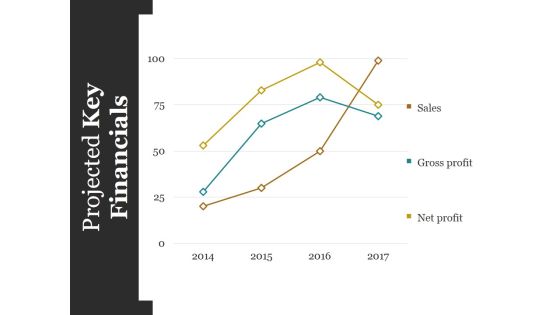
Projected Key Financials Template Ppt PowerPoint Presentation Styles Graphics Design
This is a projected key financials template ppt powerpoint presentation styles graphics design. This is a four stage process. The stages in this process are sales, gross profit, net profit.

Financials Base Plan Table Chart Ppt Slide Templates
This is a financials base plan table chart ppt slide templates. This is a five stage process. The stages in this process are kpi, revenue, cost of sales, gross profit, customer acquisition cost, other operating cost expense, operating profit, change in cash, ending cash, employees ftes.

Financials Base Plan For Company Targets Powerpoint Slide Deck Samples
This is a financials base plan for company targets powerpoint slide deck samples. This is a five stage process. The stages in this process are revenue, cost of sales, gross profit, customer acquisition cost, other operating expense, change in cash, change in cash, ending cash, employees ftes, kpi.

Monthly Financials Metrics With Revenue And Gross Profit Professional PDF
This slide displays P and L variance analysis to closely monitor key financial parameters of the company. It includes details about sales, discounts allowed, freight income, customer finance charges, etc. Showcasing this set of slides titled Monthly Financials Metrics With Revenue And Gross Profit Professional PDF. The topics addressed in these templates are Amount, Current Month, Profit. All the content presented in this PPT design is completely editable. Download it and make adjustments in color, background, font etc. as per your unique business setting.

Other Operational And Financials Kpis Key Performance Indicators Clipart PDF
The slide shows the graph of companys key KPIs key performance indicators from 2017 to 2021. Major KPIs include RPAS Revenue per available seat, total passengers, number of flights, number of fatality etc. Deliver an awe inspiring pitch with this creative other operational and financials kpis key performance indicators clipart pdf bundle. Topics like other operational and financials kpis key performance indicators can be discussed with this completely editable template. It is available for immediate download depending on the needs and requirements of the user.
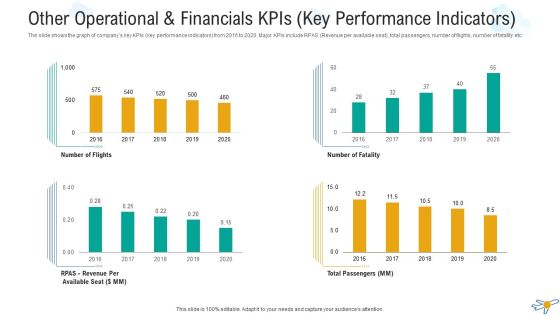
Other Operational And Financials Kpis Key Performance Indicators Professional PDF
The slide shows the graph of companys key KPIs key performance indicators from 2016 to 2020. Major KPIs include RPAS Revenue per available seat, total passengers, number of flights, number of fatality etc. Deliver an awe-inspiring pitch with this creative other operational and financials kpis key performance indicators professional pdf bundle. Topics like other operational and financials kpis key performance indicators can be discussed with this completely editable template. It is available for immediate download depending on the needs and requirements of the user.
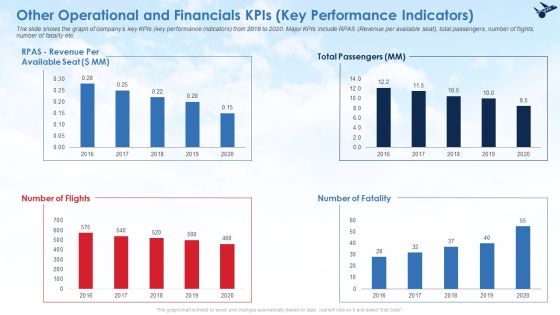
Other Operational And Financials Kpis Key Performance Indicators Ideas PDF
The slide shows the graph of companys key KPIs key performance indicators from 2016 to 2020. Major KPIs include RPAS Revenue per available seat, total passengers, number of flights, number of fatality etc. Deliver an awe inspiring pitch with this creative other operational and financials kpis key performance indicators ideas pdf bundle. Topics like other operational and financials kpis key performance indicators can be discussed with this completely editable template. It is available for immediate download depending on the needs and requirements of the user.

Key Company Financials Business Intelligence Dashboard Graphics PDF
This slide showcases business intelligence dashboard to analyze key financial metrics for the organization. It includes information such as current working capital, vendor payment error rate, quick stats, budget variance, etc. Showcasing this set of slides titled Key Company Financials Business Intelligence Dashboard Graphics PDF. The topics addressed in these templates are Key Company Financials, Business Intelligence Dashboard. All the content presented in this PPT design is completely editable. Download it and make adjustments in color, background, font etc. as per your unique business setting.
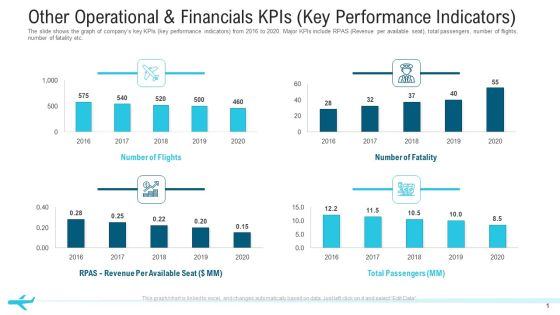
Other Operational And Financials Kpis Key Performance Indicators Structure PDF
The slide shows the graph of companys key KPIs key performance indicators from 2016 to 2020. Major KPIs include RPAS Revenue per available seat, total passengers, number of flights, number of fatality etc.Deliver an awe-inspiring pitch with this creative other operational and financials KPIs key performance indicators structure pdf. bundle. Topics like total passengers, number of flights,2016 to 2020 can be discussed with this completely editable template. It is available for immediate download depending on the needs and requirements of the user.

Restaurant Business Monthly Financials Metrics With Total Income Demonstration PDF
This following slide displays key accounting details to analyze overall profit and loss status of the company. It includes details about income, cost of goods sold, other revenue, etc. Pitch your topic with ease and precision using this Restaurant Business Monthly Financials Metrics With Total Income Demonstration PDF. This layout presents information on Period, Key Takeaways, Total Income. It is also available for immediate download and adjustment. So, changes can be made in the color, design, graphics or any other component to create a unique layout.

Monthly Analysis For Actual And Budget Financials Metrics Professional PDF
The following slide shows review report to compare difference in actually spend and planned budget for cost planning in future. It further includes details about maintenance and repairs, supplies, rent, mortgage, etc. Pitch your topic with ease and precision using this Monthly Analysis For Actual And Budget Financials Metrics Professional PDF. This layout presents information on Budget Totals, Expenses, Budget Overview. It is also available for immediate download and adjustment. So, changes can be made in the color, design, graphics or any other component to create a unique layout.

Monthly Financials Metrics Ppt PowerPoint Presentation Complete Deck With Slides
Share a great deal of information on the topic by deploying this Monthly Financials Metrics Ppt PowerPoint Presentation Complete Deck With Slides. Support your ideas and thought process with this prefabricated set. It includes a set of twelve slides, all fully modifiable and editable. Each slide can be restructured and induced with the information and content of your choice. You can add or remove large content boxes as well, to make this PPT slideshow more personalized. Its high-quality graphics and visuals help in presenting a well-coordinated pitch. This PPT template is also a resourceful tool to take visual cues from and implement the best ideas to help your business grow and expand. The main attraction of this well-formulated deck is that everything is editable, giving you the freedom to adjust it to your liking and choice. Changes can be made in the background and theme as well to deliver an outstanding pitch. Therefore, click on the download button now to gain full access to this multifunctional set.

Dashboards Related To The Zoo Financials And Operations Ppt Portfolio Graphics Example PDF
This slide shows the dashboard KPI related to the ABC Zoo which includes the forecasted revenue, competitors details, visitors attractions, capital expenditure and many more.Deliver and pitch your topic in the best possible manner with this dashboards related to the zoo financials and operations ppt portfolio graphics example pdf. Use them to share invaluable insights on capital expenditure, visitors attraction, forecasted revenue and impress your audience. This template can be altered and modified as per your expectations. So, grab it now.

Dashboards Related To The Zoo Financials And Operations Ppt Outline Portfolio PDF
This slide shows the dashboard or KPI related to the ABC Zoo which includes the forecasted revenue, competitors details, visitors attractions, capital expenditure and many more. Deliver an awe-inspiring pitch with this creative dashboards related to the zoo financials and operations ppt outline portfolio pdf. bundle. Topics like forecasted revenue, visitors attraction, capital expenditure, advertising and marketing can be discussed with this completely editable template. It is available for immediate download depending on the needs and requirements of the user.

Dashboards Related To The Zoo Financials And Operations Ppt Icon Professional PDF
This slide shows the dashboard KPI related to the ABC Zoo which includes the forecasted revenue, competitors details, visitors attractions, capital expenditure and many more. Deliver and pitch your topic in the best possible manner with this dashboards related to the zoo financials and operations ppt icon professional pdf. Use them to share invaluable insights on forecasted revenue, visitors attraction and impress your audience. This template can be altered and modified as per your expectations. So, grab it now.
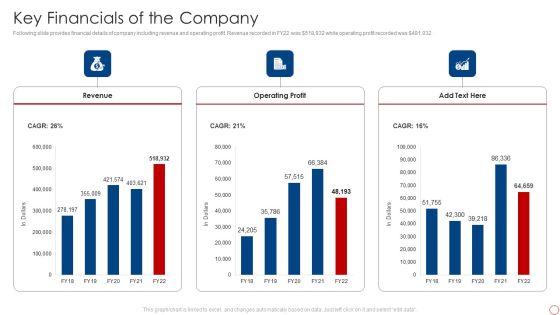
Kpis For Evaluating Business Sustainability Key Financials Of The Company Rules PDF
Following slide provides financial details of company including revenue and operating profit. Revenue recorded in FY22 was dollar 518,932 while operating profit recorded was dollar 481,932. Deliver and pitch your topic in the best possible manner with this Kpis For Evaluating Business Sustainability Financial Performance Indicator Dashboard Demonstration PDF. Use them to share invaluable insights on Revenue, Operating Profit and impress your audience. This template can be altered and modified as per your expectations. So, grab it now.

Metrics To Measure Business Performance Key Financials Of The Company Elements PDF
Following slide provides financial details of company including revenue and operating profit. Revenue recorded in FY22 was dollar 518,932 while operating profit recorded was dollar 481,932. Deliver an awe inspiring pitch with this creative Metrics To Measure Business Performance Key Financials Of The Company Elements PDF bundle. Topics like Revenue, Operating Profit can be discussed with this completely editable template. It is available for immediate download depending on the needs and requirements of the user.
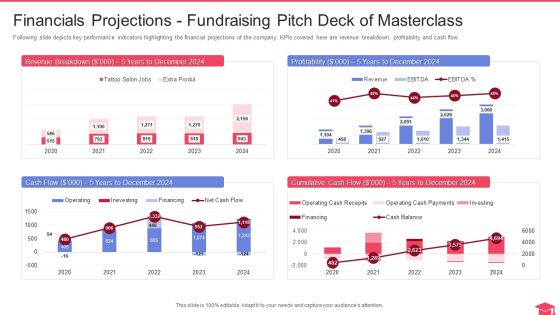
Fundraising Pitch Deck Of Masterclass Financials Projections Fundraising Pitch Deck Of Masterclass Elements PDF
Following slide depicts key performance indicators highlighting the financial projections of the company. KPIs covered here are revenue breakdown, profitability and cash flow. Deliver and pitch your topic in the best possible manner with this fundraising pitch deck of masterclass financials projections fundraising pitch deck of masterclass elements pdf. Use them to share invaluable insights on financials projections fundraising pitch deck of masterclass and impress your audience. This template can be altered and modified as per your expectations. So, grab it now.

Enterprise Sustainability Performance Metrics Key Financials Of The Company Rules PDF
Following slide provides financial details of company including revenue and operating profit. Revenue recorded in FY22 was dollar518,932 while operating profit recorded was dollar481,932.Deliver an awe inspiring pitch with this creative Enterprise Sustainability Performance Metrics Key Financials Of The Company Rules PDF bundle. Topics like Operating, Profit, Revenue can be discussed with this completely editable template. It is available for immediate download depending on the needs and requirements of the user.
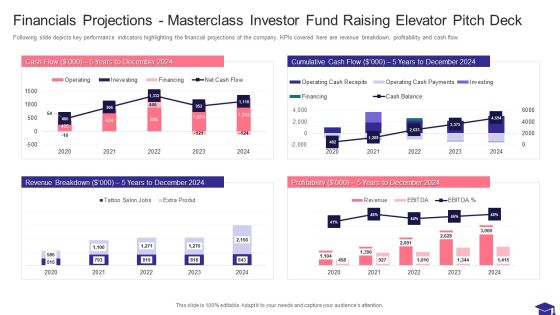
Financials Projections Masterclass Investor Fund Raising Elevator Pitch Deck Mockup PDF
Following slide depicts key performance indicators highlighting the financial projections of the company. KPIs covered here are revenue breakdown, profitability and cash flow.Deliver an awe inspiring pitch with this creative Financials Projections Masterclass Investor Fund Raising Elevator Pitch Deck Mockup PDF bundle. Topics like Cumulative Cash, Profitability, Revenue Breakdown can be discussed with this completely editable template. It is available for immediate download depending on the needs and requirements of the user.

Business Overview Of A Technology Firm Companys Long Term Financials Goals Demonstration PDF
The slide provides the long term financial goals revenue, EBITDA, and technology spend of the company for the year 2022 2 years goal, 2024 4 years goal, and 2026 6 years goal. Deliver an awe inspiring pitch with this creative Business Overview Of A Technology Firm Companys Long Term Financials Goals Demonstration PDF bundle. Topics like Revenue, Metrics, Technology Spend can be discussed with this completely editable template. It is available for immediate download depending on the needs and requirements of the user.
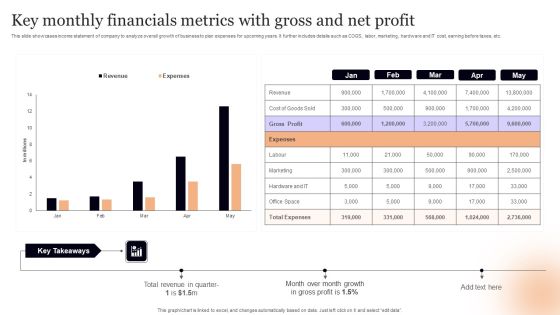
Key Monthly Financials Metrics With Gross And Net Profit Guidelines PDF
This slide showcases income statement of company to analyze overall growth of business to plan expenses for upcoming years. It further includes details such as COGS, labor, marketing, hardware and IT cost, earning before taxes, etc. Showcasing this set of slides titled Key Monthly Financials Metrics With Gross And Net Profit Guidelines PDF. The topics addressed in these templates are Key Takeaways, Total Revenue, Profit. All the content presented in this PPT design is completely editable. Download it and make adjustments in color, background, font etc. as per your unique business setting.
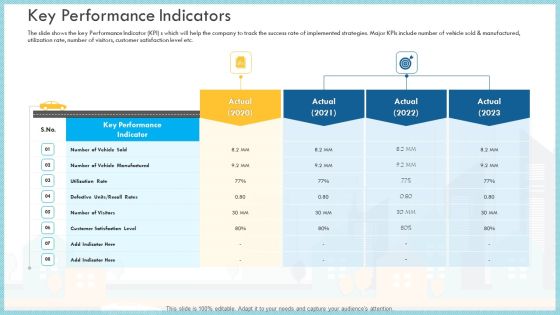
Loss Of Income And Financials Decline In An Automobile Organization Case Study Key Performance Indicators Brochure PDF
The slide shows the key Performance Indicator KPI s which will help the company to track the success rate of implemented strategies. Major KPIs include number of vehicle sold and manufactured, utilization rate, number of visitors, customer satisfaction level etc.Deliver an awe inspiring pitch with this creative loss of income and financials decline in an automobile organization case study key performance indicators brochure pdf bundle. Topics like key performance indicator, utilization rate, customer satisfaction level can be discussed with this completely editable template. It is available for immediate download depending on the needs and requirements of the user
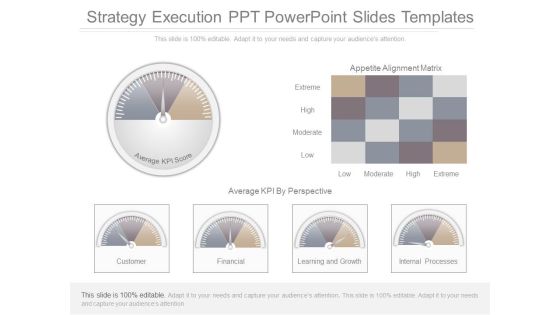
Strategy Execution Ppt Powerpoint Slides Templates
This is a strategy execution ppt powerpoint slides templates. This is a six stage process. The stages in this process are appetite alignment matrix, extreme, high, moderate, low, average kpi by prospective, customer, financial, learning and growth, internal processes, average kpi score.
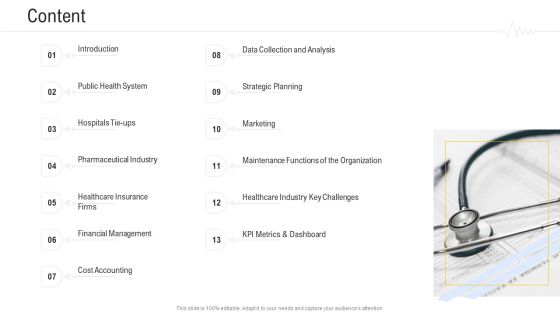
Hospital Management System Content Summary PDF
Deliver an awe inspiring pitch with this creative hospital management system content summary pdf bundle. Topics like strategic planning marketing, financial management, cost accounting, kpi metrics and dashboard can be discussed with this completely editable template. It is available for immediate download depending on the needs and requirements of the user.

Call Center Metrics Dashboard With Average Queue Time Topics PDF
Mentioned slide outlines call center KPI dashboard which gives insights into customer agent performance. The KPI covered in the slide are total voicemail, average talk time, queue time, average quality rate, agent performance, etc. Pitch your topic with ease and precision using this Call Center Metrics Dashboard With Average Queue Time Topics PDF. This layout presents information on Efficiency, Quality, Activity. It is also available for immediate download and adjustment. So, changes can be made in the color, design, graphics or any other component to create a unique layout.

Call Center Metrics Ppt PowerPoint Presentation Complete Deck With Slides
If designing a presentation takes a lot of your time and resources and you are looking for a better alternative, then this Call Center Metrics Ppt PowerPoint Presentation Complete Deck With Slides is the right fit for you. This is a prefabricated set that can help you deliver a great presentation on the topic. All the thirteen slides included in this sample template can be used to present a birds eye view of the topic. These slides are also fully editable, giving you enough freedom to add specific details to make this layout more suited to your business setting. Apart from the content, all other elements like color, design, theme are also replaceable and editable. This helps in designing a variety of presentations with a single layout. Not only this, you can use this PPT design in formats like PDF, PNG, and JPG once downloaded. Therefore, without any further ado, download and utilize this sample presentation as per your liking.

Metrics Dashboard Depicting Call Center Performance Pictures PDF
Mentioned slide outlines key performance indicator KPI dashboard which can be used by call center to optimize the agents performance. The major metrics covered in the template are total calls, average speed of answer, abandon rate, service level agreement SLA limit etc. Pitch your topic with ease and precision using this Metrics Dashboard Depicting Call Center Performance Pictures PDF. This layout presents information on Overall Satisfaction Score, Satisfaction Score, Performance. It is also available for immediate download and adjustment. So, changes can be made in the color, design, graphics or any other component to create a unique layout.

Call Center Metrics Dashboard To Measure Customer Satisfaction Level Slides PDF
Mentioned slide outlines call center KPI dashboard which will assist various call centers to evaluate the customer satisfaction level. The critical KPIs mentioned in the template are total revenue earned, cost per support, average time taken to solve an issue etc. Showcasing this set of slides titled Call Center Metrics Dashboard To Measure Customer Satisfaction Level Slides PDF. The topics addressed in these templates are Total Revenue, Support Costs, Customer Satisfaction. All the content presented in this PPT design is completely editable. Download it and make adjustments in color, background, font etc. as per your unique business setting.

Call Center Metrics And Metrics Dashboard With Tickets Raised Graphics PDF
Mentioned slide outlines a KPI dashboard showcasing the call center performance. The metrics covered in the slide are total dropped calls, waiting calls, total calls, team performance, recurring calls, tickets raised. Showcasing this set of slides titled Call Center Metrics And Metrics Dashboard With Tickets Raised Graphics PDF. The topics addressed in these templates are Call Management Data, Monthly Statics, Performance Records. All the content presented in this PPT design is completely editable. Download it and make adjustments in color, background, font etc. as per your unique business setting.

Call Center Metrics Dashboard With Cost Per Contact Rules PDF
Mentioned slide outlines KPI dashboard which allows the business to monitor the efficiency of call center. The metrics covered in the slide are first call resolution, average speed of answer, customer satisfaction, cost per contact etc. Pitch your topic with ease and precision using this Call Center Metrics Dashboard With Cost Per Contact Rules PDF. This layout presents information on Cost Per Contract, Key Metrics, Customer Satisfaction. It is also available for immediate download and adjustment. So, changes can be made in the color, design, graphics or any other component to create a unique layout.

Call Center Metrics Dashboard With Average Response Time Inspiration PDF
Mentioned slide outlines KPI dashboard which can be used by call center to measure the performance of their agents. The key metrics highlighted in the dashboard are first call resolution, daily abandonment rate, total number of calls by topic, top performing call agents etc. Showcasing this set of slides titled Call Center Metrics Dashboard With Average Response Time Inspiration PDF. The topics addressed in these templates are Efficiency, Quality, Activity, Daily Average Response, Daily Average Transfer. All the content presented in this PPT design is completely editable. Download it and make adjustments in color, background, font etc. as per your unique business setting.

Call Center Metrics Dashboard With Customer Satisfaction Score Ideas PDF
Mentioned slide outlines a comprehensive call center KPI dashboard which can be used for those customers who are seeking technical support. It provides detailed information about metrics such as ticket status, ticket by channels and type, overall customer satisfaction score, etc. Showcasing this set of slides titled Call Center Metrics Dashboard With Customer Satisfaction Score Ideas PDF. The topics addressed in these templates are Customer Satisfaction, Score Ticket Status, Satisfaction Score. All the content presented in this PPT design is completely editable. Download it and make adjustments in color, background, font etc. as per your unique business setting.

Metrics Dashboard To Measure Call Center Success Themes PDF
Mentioned slide outlines a comprehensive KPI dashboard used to measure the call center performance. The dashboard monitors the status of key metrics such as call abandonment levels, current service level, average call length, total calls attended, calls waiting etc. Showcasing this set of slides titled Metrics Dashboard To Measure Call Center Success Themes PDF. The topics addressed in these templates are Center Success, Call Center Status, Call Monitor. All the content presented in this PPT design is completely editable. Download it and make adjustments in color, background, font etc. as per your unique business setting.

Call Center Metrics Dashboard Highlighting Service Level Infographics PDF
Mentioned slide outlines comprehensive call center KPI dashboard. Information covered in this slide is related to various metrics such as queue calls, support and billing service level, inbound volume, outbound volume etc. Pitch your topic with ease and precision using this Call Center Metrics Dashboard Highlighting Service Level Infographics PDF. This layout presents information on All Agents, Queue Calls, Billing Service Level. It is also available for immediate download and adjustment. So, changes can be made in the color, design, graphics or any other component to create a unique layout.

Call Center Metrics Dashboard With First Response Time Background PDF
Mentioned slide outlines a KPI dashboard which can be used by call centers for the ticket system. Tickets created, unassigned, open, solved, escalated, tickets solved by agents, first response and full resolution time are the key metrics highlighted in the slide. Pitch your topic with ease and precision using this Call Center Metrics Dashboard With First Response Time Background PDF. This layout presents information on First Response Time, First Resolution Time, Response Time. It is also available for immediate download and adjustment. So, changes can be made in the color, design, graphics or any other component to create a unique layout.
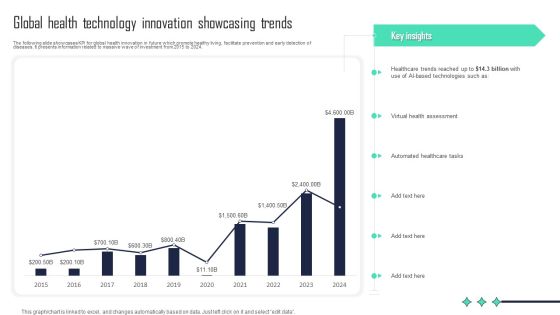
Global Health Technology Innovation Showcasing Trends Formats PDF
The following slide showcases KPI for global health innovation in future which promote healthy living, facilitate prevention and early detection of diseases. It presents information related to massive wave of investment from 2015 to 2024. Showcasing this set of slides titled Global Health Technology Innovation Showcasing Trends Formats PDF. The topics addressed in these templates are Virtual Health Assessment, Automated Healthcare Tasks, Key Insights. All the content presented in this PPT design is completely editable. Download it and make adjustments in color, background, font etc. as per your unique business setting.

Recruitment Strategy And Human Resource Employee Skill Assessment Scorecard Background PDF
The following slide showcases HR scorecard and strategy map. It includes employee growth, financial and process, KPI, current score and target. This is a Recruitment Strategy And Human Resource Employee Skill Assessment Scorecard Background PDF template with various stages. Focus and dispense information on two stages using this creative set, that comes with editable features. It contains large content boxes to add your information on topics like Recruitment Strategy Management, HR Scorecard, KPI, Strategy. You can also showcase facts, figures, and other relevant content using this PPT layout. Grab it now.

Process Optimization Through Product Life Process Management Techniques Company Brochure PDF
This slide highlights KPI dashboard exhibiting overall improvement in the financial performance of company as the consequences of program implementation. Deliver and pitch your topic in the best possible manner with this process optimization through product life process management techniques company brochure pdf Use them to share invaluable insights on showing increase, average purchase value, quarterly scorecard and impress your audience. This template can be altered and modified as per your expectations. So, grab it now.

Digital Transformation Purpose And Key Performance Indicators Formats PDF
The slide shows a pie chart presenting objectives of conducting digital advancement in organization with KPIs. It includes KPIs like user satisfaction, economic, productive, trader control metrics, risk metrics, saving goals and advancements. Pitch your topic with ease and precision using this Digital Transformation Purpose And Key Performance Indicators Formats PDF. This layout presents information on Key Performance Indicators, Digital Transformation, Minimize Costs. It is also available for immediate download and adjustment. So, changes can be made in the color, design, graphics or any other component to create a unique layout.

Advanced Human Resource Value Chain With Kpis Icons PDF
This slide shows advanced HR value chain with KPIs to demonstrate its role in achieving goals. It includes aspects such as HR enablers, activities, outcomes, strategic focus , and KPI for financial, process and customer. Showcasing this set of slides titled Advanced Human Resource Value Chain With Kpis Icons PDF. The topics addressed in these templates are Strategic Focus, Process Kpis, Customer Kpis. All the content presented in this PPT design is completely editable. Download it and make adjustments in color, background, font etc. as per your unique business setting.
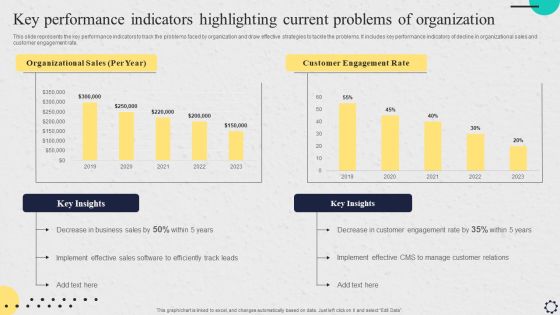
Software Implementation Strategy Key Performance Indicators Highlighting Current Problems Of Organization Professional PDF
This slide represents the key performance indicators to track the problems faced by organization and draw effective strategies to tackle the problems. It includes key performance indicators of decline in organizational sales and customer engagement rate. Make sure to capture your audiences attention in your business displays with our gratis customizable Software Implementation Strategy Key Performance Indicators Highlighting Current Problems Of Organization Professional PDF. These are great for business strategies, office conferences, capital raising or task suggestions. If you desire to acquire more customers for your tech business and ensure they stay satisfied, create your own sales presentation with these plain slides.

Call Center Metrics Dashboard With Key Metrics Information PDF
Mentioned slide outlines various call center KPIs dashboard. Call resolution in the current and previous month, agents schedule adherence today, currently active and waiting calls are some of the key metrics mentioned in the slide. Showcasing this set of slides titled Call Center Metrics Dashboard With Key Metrics Information PDF. The topics addressed in these templates are Currently Active, Call Resolution, Key Metrics. All the content presented in this PPT design is completely editable. Download it and make adjustments in color, background, font etc. as per your unique business setting.
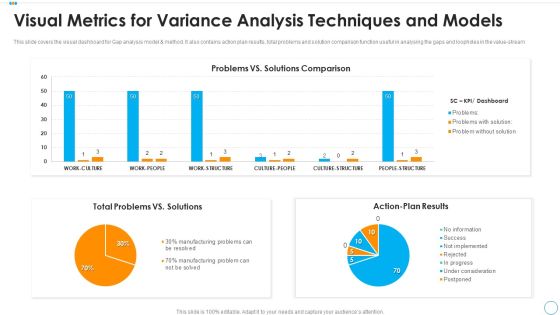
Visual Metrics For Variance Analysis Techniques And Models Mockup PDF
This slide covers the visual dashboard for Gap analysis model and method. It also contains action plan results, total problems and solution comparison function useful in analysing the gaps and loopholes in the value stream. Showcasing this set of slides titled visual metrics for variance analysis techniques and models mockup pdf. The topics addressed in these templates are total problems vs solutions, action plan results, problems vs solutions comparison. All the content presented in this PPT design is completely editable. Download it and make adjustments in color, background, font etc. as per your unique business setting.

Software Implementation Strategy Digital Marketing Software Key Metrics Dashboard Template PDF
This slide represents the dashboard to track and measure the performance and efficiency of digital marketing software. It includes details related to KPIs such as social media followers, Facebook demographics etc. Crafting an eye catching presentation has never been more straightforward. Let your presentation shine with this tasteful yet straightforward Software Implementation Strategy Digital Marketing Software Key Metrics Dashboard Template PDF template. It offers a minimalistic and classy look that is great for making a statement. The colors have been employed intelligently to add a bit of playfulness while still remaining professional. Construct the idealSoftware Implementation Strategy Digital Marketing Software Key Metrics Dashboard Template PDF that effortlessly grabs the attention of your audience Begin now and be certain to wow your customers.

Dashboard To Track Energy Efficiency After Campaign Implementation Pictures PDF
This slide consists of a Dashboard which can be used to track energy saving which will be used by managers to track effectiveness of program implementation. The key performance indicators include electric vs gas allocation, equipment activity, changes in costs, budget load etc. Showcasing this set of slides titled Dashboard To Track Energy Efficiency After Campaign Implementation Pictures PDF. The topics addressed in these templates are Equipment Activity, Budget Load, Cost Projection. All the content presented in this PPT design is completely editable. Download it and make adjustments in color, background, font etc. as per your unique business setting.

Energy Efficiency Dashboard To Track Campaign Effectiveness Pictures PDF
This slide consists of a dashboard which presents an energy saving dashboard which can be used to track effectiveness of energy saving program. The key performance indicators relate to energy sources, energy consumption by sectors, energy consumption by sectors etc. Pitch your topic with ease and precision using this Energy Efficiency Dashboard To Track Campaign Effectiveness Pictures PDF. This layout presents information on Energy Sources, Energy Usage, Trend Analysis. It is also available for immediate download and adjustment. So, changes can be made in the color, design, graphics or any other component to create a unique layout.

Digital Transition Plan For Managing Business Dashboard Depicting Kpis To Track Sales Performance Guidelines PDF
This slide covers the dashboard that depicts metrics to track company sales performance that focuses on number of sales, cost breakdown, accumulated revenues, incremental sales, etc. Are you in need of a template that can accommodate all of your creative concepts This one is crafted professionally and can be altered to fit any style. Use it with Google Slides or PowerPoint. Include striking photographs, symbols, depictions, and other visuals. Fill, move around, or remove text boxes as desired. Test out color palettes and font mixtures. Edit and save your work, or work with colleagues. Download Digital Transition Plan For Managing Business Dashboard Depicting Kpis To Track Sales Performance Guidelines PDF and observe how to make your presentation outstanding. Give an impeccable presentation to your group and make your presentation unforgettable.

Competitive Edge Performance Representation For Variance Analysis Techniques And Models Ideas PDF
This slide covers the graphical representation for gap analyzation process. It also covers the important factors such as, sales metrics, time frame, potential and performance. Showcasing this set of slides titled competitive edge performance representation for variance analysis techniques and models ideas pdf. The topics addressed in these templates are competitive edge performance representation for variance analysis techniques and models. All the content presented in this PPT design is completely editable. Download it and make adjustments in color, background, font etc. as per your unique business setting.

Customer Satisfaction Data Insights Dashboard Ideas PDF
The following slide highlights the key metrics of the customer satisfaction survey conducted to measure and enhance the user experience. It includes satisfaction, recommendation rate, customers professional background and reviews. Showcasing this set of slides titled Customer Satisfaction Data Insights Dashboard Ideas PDF. The topics addressed in these templates are Recommendation Rate, Customer Satisfaction Rate, Customer Professional Background. All the content presented in this PPT design is completely editable. Download it and make adjustments in color, background, font etc. as per your unique business setting.
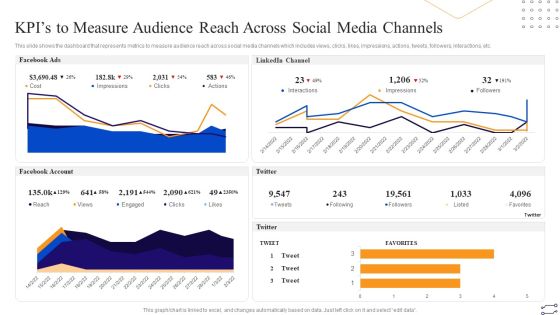
Online Marketing Tactics To Enhance Sales Kpis To Measure Audience Reach Across Social Media Professional PDF
This slide shows the dashboard that represents metrics to measure audience reach across social media channels which includes views, clicks, likes, impressions, actions, tweets, followers, interactions, etc. Deliver an awe inspiring pitch with this creative Online Marketing Tactics To Enhance Sales Kpis To Measure Audience Reach Across Social Media Professional PDF bundle. Topics like LinkedIn Channel, Facebook Account, Twitter, Facebook Ads can be discussed with this completely editable template. It is available for immediate download depending on the needs and requirements of the user.
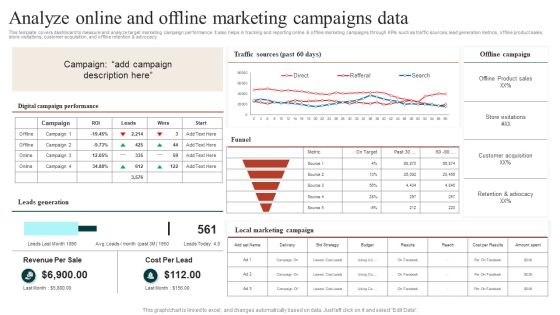
Target Marketing Techniques Analyze Online And Offline Marketing Campaigns Data Ideas PDF
This template covers dashboard to measure and analyze target marketing campaign performance. It also helps in tracking and reporting online and offline marketing campaigns through KPIs such as traffic sources, lead generation metrics, offline product sales, store visitations, customer acquisition, and offline retention and advocacy Find a pre designed and impeccable Target Marketing Techniques Evaluating Growth Rate For Target Marketing Slides PDF. The templates can ace your presentation without additional effort. You can download these easy to edit presentation templates to make your presentation stand out from others. So, what are you waiting for Download the template from Slidegeeks today and give a unique touch to your presentation.

Implementing Client Onboarding Process Consumer Adoption Challenges Faced By Organization Graphics PDF
This slide provides glimpse about problems faced by our organization that can provide metrics to target and develop strategies to increase our customer base. It includes issues such as customer churn rate, customer adoption rate, etc. Slidegeeks is here to make your presentations a breeze with Implementing Client Onboarding Process Consumer Adoption Challenges Faced By Organization Graphics PDF With our easy to use and customizable templates, you can focus on delivering your ideas rather than worrying about formatting. With a variety of designs to choose from, you are sure to find one that suits your needs. And with animations and unique photos, illustrations, and fonts, you can make your presentation pop. So whether you are giving a sales pitch or presenting to the board, make sure to check out Slidegeeks first.

Key Performance Indicators Template 2 Ppt PowerPoint Presentation Model Example
This is a key performance indicators template 2 ppt powerpoint presentation model example. This is a four stage process. The stages in this process are objective, measures, targets, invites, indicators.
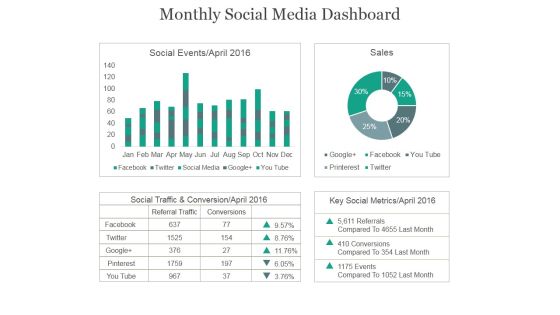
Monthly Social Media Dashboard Ppt PowerPoint Presentation Example 2015
This is a monthly social media dashboard ppt powerpoint presentation example 2015. This is a four stage process. The stages in this process are social events, sales, social traffic, conservation, key social metrics.
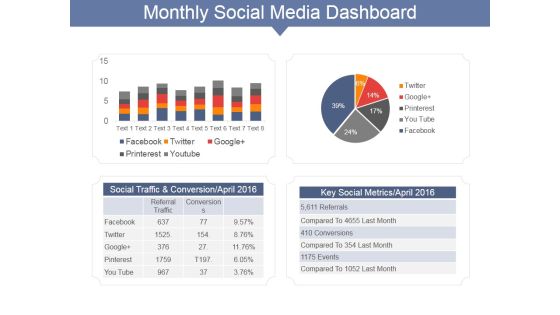
Monthly Social Media Dashboard Ppt PowerPoint Presentation Gallery Show
This is a monthly social media dashboard ppt powerpoint presentation gallery show. This is a two stage process. The stages in this process are social traffic and conversion april, key social metrics april, facebook, twitter.
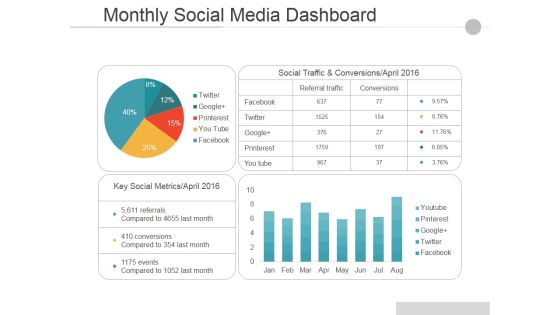
Monthly Social Media Dashboard Ppt PowerPoint Presentation Pictures Guide
This is a monthly social media dashboard ppt powerpoint presentation pictures guide. This is a two stage process. The stages in this process are social traffic and conversions april, key social metrics april, facebook, twitter, google.
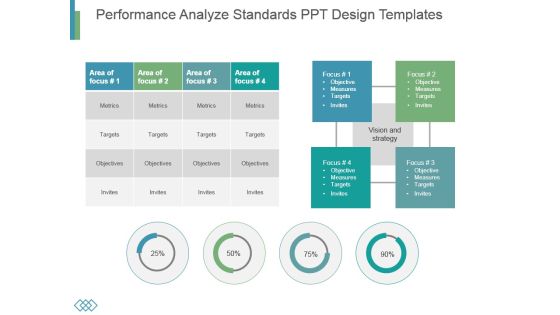
Performance Analyze Standards Ppt Design Templates
This is a performance analyze standards ppt design templates. This is a four stage process. The stages in this process are metrics, targets, objectives, invites.
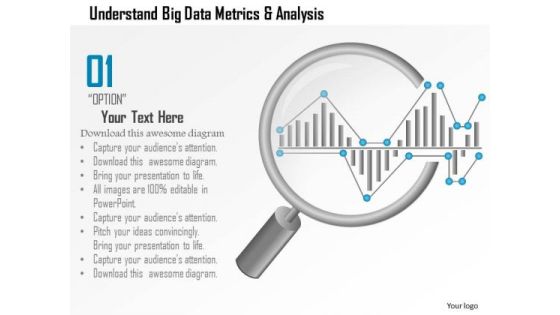
Business Diagram Understand Big Data Metrics And Analysis Showing By Magnifying Glass Ppt Slide
This PPT slide has been designed with big data metrics and magnifying glass. This diagram helps to portray concept of data analysis and data search. Download this diagram to make professional presentations.
Key Evaluation Metrics Ppt PowerPoint Presentation Portfolio
This is a key evaluation metrics ppt powerpoint presentation portfolio. This is a five stage process. The stages in this process are business, strategy, marketing, analysis, success, icons.

Key Metrics Ppt PowerPoint Presentation Rules
This is a key metrics ppt powerpoint presentation rules. This is a four stage process. The stages in this process are business, strategy, marketing, success, analysis, finance.

Key Evaluation Metrics Ppt PowerPoint Presentation Example File
This is a key evaluation metrics ppt powerpoint presentation example file. This is a five stage process. The stages in this process are business, strategy, marketing, analysis, finance.

Key Performance Indicators Template 3 Ppt PowerPoint Presentation Samples
This is a key performance indicators template 3 ppt powerpoint presentation samples. This is a four stage process. The stages in this process are objective, measures, targets, invites.

Key Performance Indicators Template 2 Ppt PowerPoint Presentation Layouts Portfolio
This is a key performance indicators template 2 ppt powerpoint presentation layouts portfolio. This is a four stage process. The stages in this process are objective, measures, targets, invites.

Key Performance Indicator Analytics Dashboard Ppt PowerPoint Presentation Model Example Topics
This is a key performance indicator analytics dashboard ppt powerpoint presentation model example topics. This is a five stage process. The stages in this process are kpi proposal, kpi plan, kpi scheme.
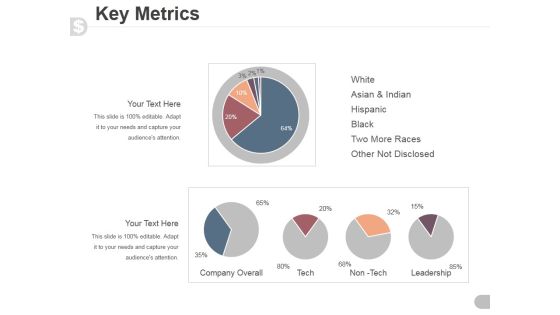
Key Metrics Ppt PowerPoint Presentation Visual Aids
This is a key metrics ppt powerpoint presentation visual aids. This is a five stage process. The stages in this process are white, asian and indian, hispanic, black, two more races, other not disclosed.
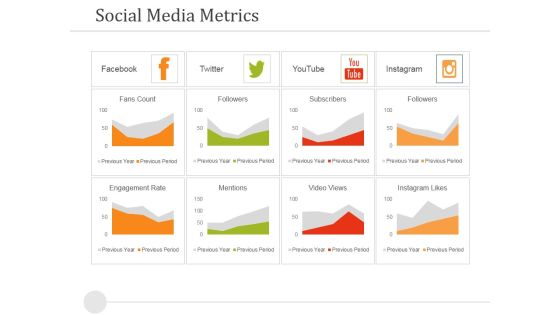
Social Media Metrics Ppt PowerPoint Presentation Layouts Designs Download
This is a social media metrics ppt powerpoint presentation layouts designs download. This is a eight stage process. The stages in this process are facebook, twitter, youtube, instagram.
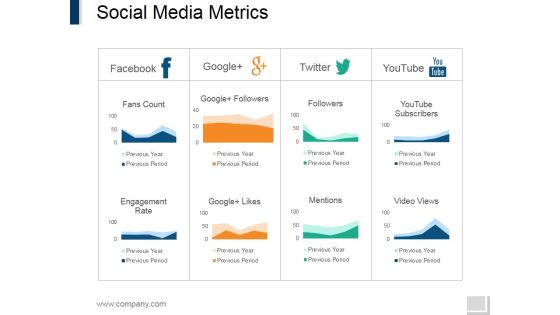
Social Media Metrics Ppt PowerPoint Presentation File Design Inspiration
This is a social media metrics ppt powerpoint presentation file design inspiration. This is a four stage process. The stages in this process are facebook, google, twitter, youtube.
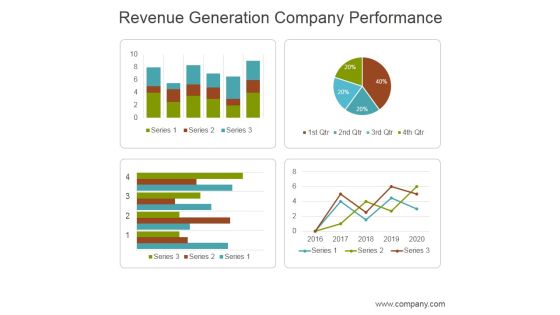
Revenue Generation Company Performance Ppt PowerPoint Presentation Layouts
This is a revenue generation company performance ppt powerpoint presentation layouts. This is a four stage process. The stages in this process are business, marketing, management, revenue, performance.
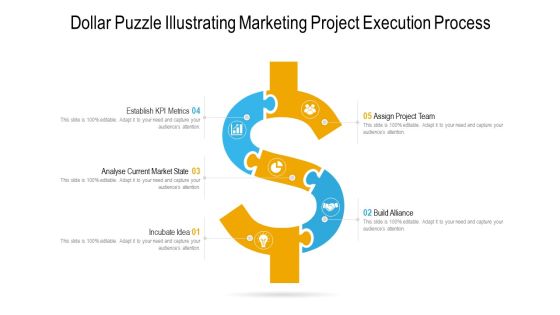
Dollar Puzzle Illustrating Marketing Project Execution Process Ppt PowerPoint Presentation Gallery Ideas PDF
Presenting dollar puzzle illustrating marketing project execution process ppt powerpoint presentation gallery ideas pdf. to dispense important information. This template comprises five stages. It also presents valuable insights into the topics including establish kpi metrics, analyse current market state, incubate idea. This is a completely customizable PowerPoint theme that can be put to use immediately. So, download it and address the topic impactfully.

Key Evaluation Metrics Ppt Slides
This is a key evaluation metrics ppt slides. This is a five stage process. The stages in this process are business, finance, marketing, symbol.
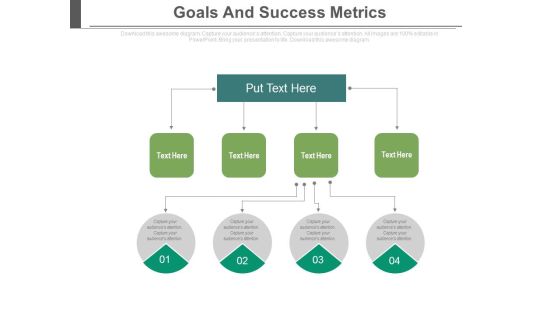
Goals And Success Metrics Ppt Slides
This is a goals and success metrics ppt slides. This is a four stage process. The stages in this process are process and flows, success, business.
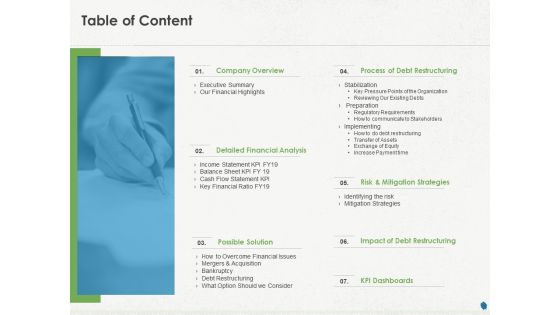
Distressed Debt Refinancing For Organizaton Table Of Content Ppt PowerPoint Presentation Professional Graphics Pictures PDF
Presenting this set of slides with name distressed debt refinancing for organizaton table of content ppt powerpoint presentation professional graphics pictures pdf. This is a seven stage process. The stages in this process are company overview, detailed financial analysis, possible solution, process of debt restructuring, risk and mitigation strategies, impact of debt restructuring, kpi dashboards . This is a completely editable PowerPoint presentation and is available for immediate download. Download now and impress your audience.

Commodity Up Selling Table Of Content Ppt Show Ideas PDF
Presenting this set of slides with name commodity up selling table of content ppt show ideas pdf. This is a ten stage process. The stages in this process are problem statement, financial highlights, product and services, industry scenario, training, sales projection, challenges and solutions, kpi dashboard. This is a completely editable PowerPoint presentation and is available for immediate download. Download now and impress your audience.

Debt Retrieval Techniques Our Key Performance Indicators For Balance Sheet Ppt Pictures Gallery PDF
Purpose of the following side is to display the major KPI for the balance sheet as it highlight the key components such as current asset, current liabilities, total assets and total liability of the organization for the financial year 2020 2021 Deliver and pitch your topic in the best possible manner with this debt retrieval techniques our key performance indicators for balance sheet ppt pictures gallery pdf. Use them to share invaluable insights on current assets, current liabilities, total assets, total liabilities and impress your audience. This template can be altered and modified as per your expectations. So, grab it now.

Debt Collection Improvement Plan Our Key Performance Indicators For Balance Sheet Professional PDF
Purpose of the following side is to display the major KPI for the balance sheet as it highlight the key components such as current asset, current liabilities, total assets and total liability of the organization for the financial year 2021 to 2022. Deliver and pitch your topic in the best possible manner with this debt collection improvement plan our key performance indicators for balance sheet professional pdf. Use them to share invaluable insights on current assets, current liabilities, total assets, total liabilities and impress your audience. This template can be altered and modified as per your expectations. So, grab it now.
Mortgage Recovery Strategy For Finance Companies Our Key Performance Indicators For Balance Sheet Inspiration PDF
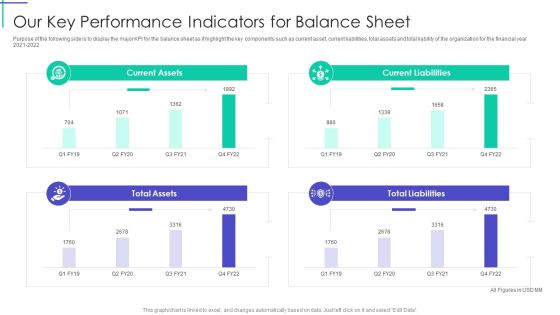
Purpose of the following side is to display the major KPI for the balance sheet as it highlight the key components such as current asset, current liabilities, total assets and total liability of the organization for the financial year 2021 to 2022. Deliver an awe inspiring pitch with this creative Mortgage Recovery Strategy For Finance Companies Our Key Performance Indicators For Balance Sheet Inspiration PDF bundle. Topics like Current Assets, Current Liabilities, Total Liabilities can be discussed with this completely editable template. It is available for immediate download depending on the needs and requirements of the user.
Professional Scrum Master Training IT Risk Monitoring Dashboard For Software Development Projects Icons PDF
Following slide displays risk monitoring KPI dashboard that can be used by a firm to track multiple risk events. Metrics covered in the dashboard are residual risk by period and category by total risk rating. Deliver an awe inspiring pitch with this creative professional scrum master training it risk monitoring dashboard for software development projects icons pdf bundle. Topics like financial risk, people risk, governance risk, competitive risk, system or technology can be discussed with this completely editable template. It is available for immediate download depending on the needs and requirements of the user.
Vendor Performance Analysis And Administration Supplier Assessment Criteria To Optimize Procurement Performance Themes PDF
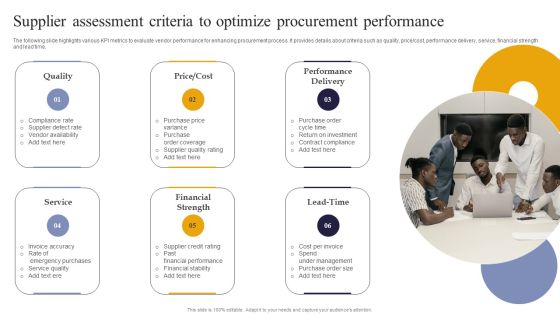
The following slide highlights various KPI metrics to evaluate vendor performance for enhancing procurement process. It provides details about criteria such as quality, price cost, performance delivery, service, financial strength and lead time. From laying roadmaps to briefing everything in detail, our templates are perfect for you. You can set the stage with your presentation slides. All you have to do is download these easy to edit and customizable templates. Vendor Performance Analysis And Administration Supplier Assessment Criteria To Optimize Procurement Performance Themes PDF will help you deliver an outstanding performance that everyone would remember and praise you for. Do download this presentation today.
Sales Performance Ppt PowerPoint Presentation Summary Influencers
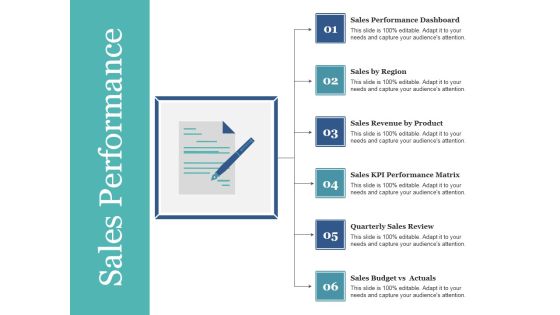
This is a sales performance ppt powerpoint presentation summary influencers. This is a six stage process. The stages in this process are sales performance dashboard, sales by region, sales revenue by product, sales kpi performance matrix, quarterly sales review.
Sales Performance Ppt PowerPoint Presentation Infographics Visuals
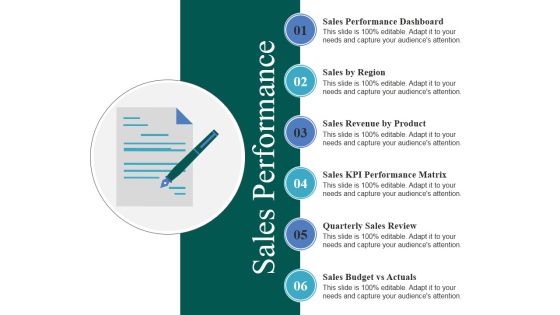
This is a sales performance ppt powerpoint presentation infographics visuals. This is a six stage process. The stages in this process are sales by region, sales revenue by product, sales kpi performance matrix, quarterly sales review, sales budget vs actuals.

Consumer Lead Generation Process Enhanced Lead Performance Tracking Dashboard Portrait PDF
This slide covers the KPI dashboard for tracking improved lead management system performance. It includes metrics such as visitors, social media followers, email subscribers, organic leads, etc. Slidegeeks is here to make your presentations a breeze with Consumer Lead Generation Process Enhanced Lead Performance Tracking Dashboard Portrait PDF With our easy-to-use and customizable templates, you can focus on delivering your ideas rather than worrying about formatting. With a variety of designs to choose from, youre sure to find one that suits your needs. And with animations and unique photos, illustrations, and fonts, you can make your presentation pop. So whether youre giving a sales pitch or presenting to the board, make sure to check out Slidegeeks first.
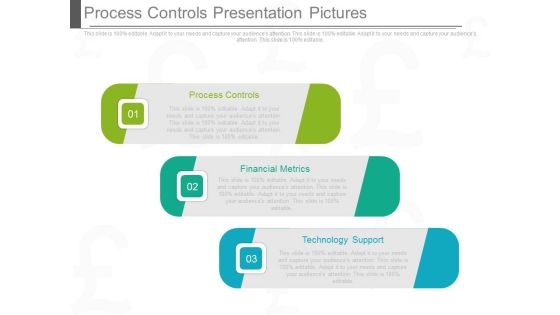
Process Controls Presentation Pictures
This is a process controls presentation pictures. This is a three stage process. The stages in this process are process controls, financial metrics, technology support.
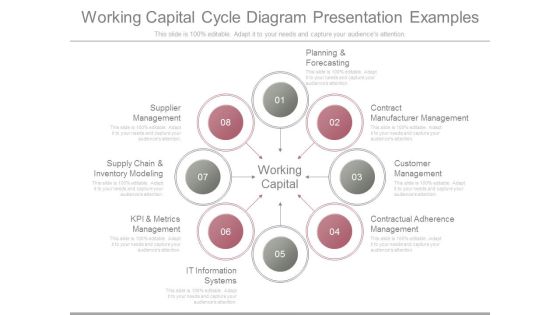
Working Capital Cycle Diagram Presentation Examples
This is a working capital cycle diagram presentation examples. This is a eight stage process. The stages in this process are planning and forecasting, contract manufacturer management, customer management, contractual adherence management, it information systems, kpi and metrics management, supply chain and inventory modeling, supplier management.

Business Activities Assessment Examples Content Professional PDF
Deliver an awe inspiring pitch with this creative business activities assessment examples content professional pdf bundle. Topics like contract and workflow management, commissioning new facilities, capital budgeting, kpi metrics and dashboard, asset management process can be discussed with this completely editable template. It is available for immediate download depending on the needs and requirements of the user.
Online Business Promotion Performance Analysis To Fulfill Business Objectives Ppt PowerPoint Presentation Summary Icon PDF
Pitch your topic with ease and precision using this online business promotion performance analysis to fulfill business objectives ppt powerpoint presentation summary icon pdf. This layout presents information on KPI performance metric, advertiser revenue, sell products. It is also available for immediate download and adjustment. So, changes can be made in the color, design, graphics or any other component to create a unique layout.
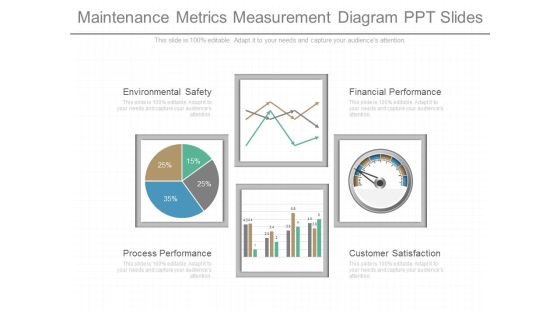
Maintenance Metrics Measurement Diagram Ppt Slides
This is a maintenance metrics measurement diagram ppt slides. This is a four stage process. The stages in this process are environmental safety, process performance, financial performance, customer satisfaction.

Project Management Key Performance Indicators Balanced Scorecard Introduction PDF
This slide shows key performance indicators scorecard for the project management of the organization. It includes financial status, consumer satisfaction, business growth and internal objectives. Pitch your topic with ease and precision using this Project Management Key Performance Indicators Balanced Scorecard Introduction PDF. This layout presents information on Financial Status, Business Growth, Consumer Satisfaction. It is also available for immediate download and adjustment. So, changes can be made in the color, design, graphics or any other component to create a unique layout.
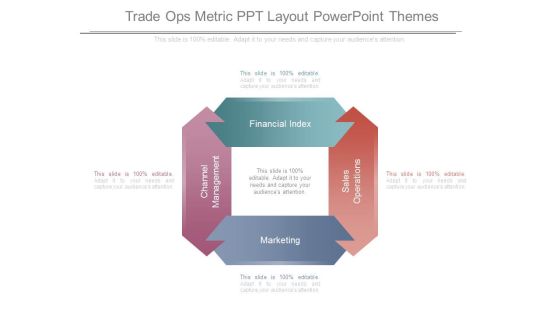
Trade Ops Metric Ppt Layout Powerpoint Themes
This is a trade ops metric ppt layout powerpoint themes. This is a four stage process. The stages in this process are channel management, marketing, sales operations, financial index.

Corporate Earnings And Risk Metrics Dashboard Guidelines PDF
This slide illustrates graphical representation of risk key performance indicators. It includes financial risks, operational risk and risk expenditure etc. Pitch your topic with ease and precision using this Corporate Earnings And Risk Metrics Dashboard Guidelines PDF. This layout presents information on Financial Risk, Operational Risk Expenditure. It is also available for immediate download and adjustment. So, changes can be made in the color, design, graphics or any other component to create a unique layout.

Advanced Email Metrics And Analysis Services Diagram Slide
This is a advanced email metrics and analysis services diagram slide. This is a four stage process. The stages in this process are analytics data warehouse, data mining, financial modeling.
Service Business Plan Example Powerpoint Ideas
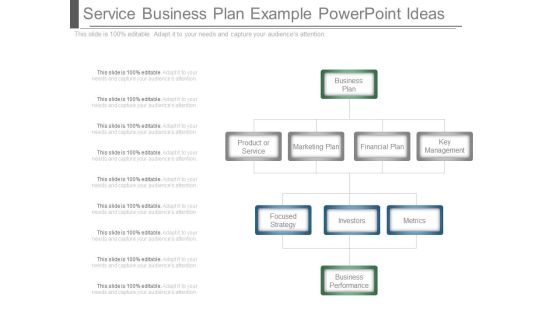
This is a service business plan example powerpoint ideas. This is a nine stage process. The stages in this process are business plan, product or service, marketing plan, financial plan, key management, focused strategy, investors, metrics.
Supply Chain Management Operational Metrics Performance Measures Designs PDF
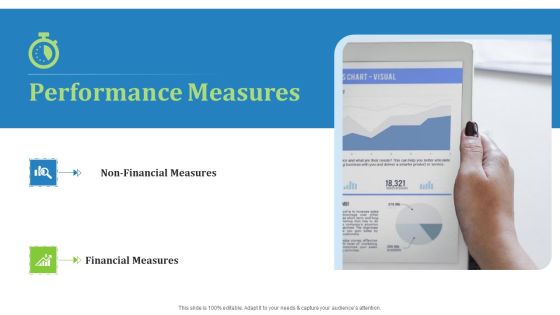
This is a supply chain management operational metrics performance measures designs pdf. template with various stages. Focus and dispense information on two stages using this creative set, that comes with editable features. It contains large content boxes to add your information on topics like NON financial measures, financial measures. You can also showcase facts, figures, and other relevant content using this PPT layout. Grab it now.

Scorecard Management Diagram Ppt Samples Download
This is a scorecard management diagram ppt samples download. This is a five stage process. The stages in this process are financial goals, growth, customer metrics, budget finance, internal metrics.

Inventory Kpis Ppt PowerPoint Presentation Infographic Template Display
This is a inventory kpis ppt powerpoint presentation infographic template display. This is a three stage process. The stages in this process are supply chain metrics, financial metrics, percent margins, return on assets, inventory turnover.

Packaging And Delivering Dashboard With Monthly Key Performance Metrics Microsoft PDF
The following slide showcases dashboard of supply chain with order status key metrics. Main KPIs covered are volume today, global financial performance and inventory. Pitch your topic with ease and precision using this Packaging And Delivering Dashboard With Monthly Key Performance Metrics Microsoft PDF. This layout presents information on Customer, Global Financial Performance, Inventory Distribution. It is also available for immediate download and adjustment. So, changes can be made in the color, design, graphics or any other component to create a unique layout.

Corporate Balanced Scorecard Diagram Ppt Diagrams
This is a corporate balanced scorecard diagram ppt diagrams. This is a five stage process. The stages in this process are financial perspective, customer perspective, internal processes, growth, internal metrics, balanced scorecard.
Organizational Alignment Ppt Infographic Template
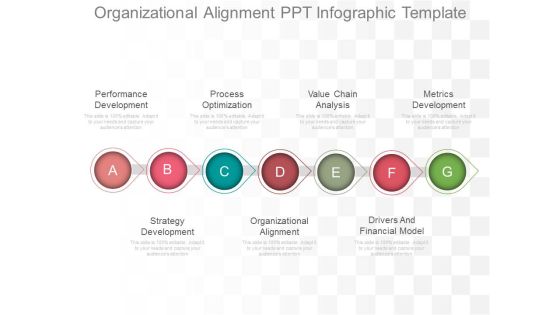
This is a organizational alignment ppt infographic template. This is a seven stage process. The stages in this process are performance development, process optimization, value chain analysis, metrics development, strategy development, organizational alignment, drivers and financial model.

Knowledge Management Process Model Ppt Slides
This is a knowledge management process model ppt slides. This is a six stage process. The stages in this process are knowledge manager, reports dashboard, metrics manager, financial tracker, resource manager, project tracker, result, strategy, execution.
