AI PPT Maker
Templates
PPT Bundles
Design Services
Business PPTs
Business Plan
Management
Strategy
Introduction PPT
Roadmap
Self Introduction
Timelines
Process
Marketing
Agenda
Technology
Medical
Startup Business Plan
Cyber Security
Dashboards
SWOT
Proposals
Education
Pitch Deck
Digital Marketing
KPIs
Project Management
Product Management
Artificial Intelligence
Target Market
Communication
Supply Chain
Google Slides
Research Services
 One Pagers
All Categories
-
Home
- Customer Favorites
- Financial Icons
Financial Icons

Bubble Chart Ppt PowerPoint Presentation Inspiration Gridlines
This is a bubble chart ppt powerpoint presentation inspiration gridlines. This is a two stage process. The stages in this process are bubble chart, finance, business, marketing, planning.

Bubble Chart Ppt PowerPoint Presentation Show Microsoft
This is a bubble chart ppt powerpoint presentation show microsoft. This is a two stage process. The stages in this process are bubble chart, product, business, management, marketing.

Area Chart Finanace Ppt PowerPoint Presentation Ideas
This is a area chart finanace ppt powerpoint presentation ideas. This is a two stage process. The stages in this process are area chart, finance, marketing, management, investment.
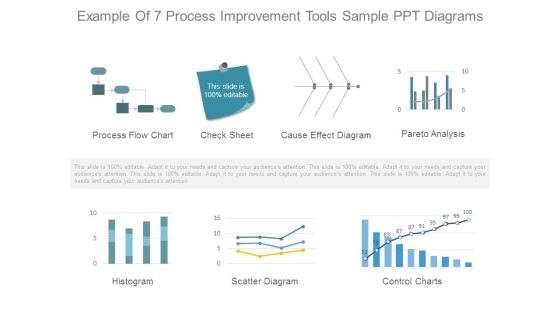
Example Of 7 Process Improvement Tools Sample Ppt Diagrams
This is a example of 7 process improvement tools sample ppt diagrams. This is a seven stage process. The stages in this process are process flow chart, check sheet, cause effect diagram, pareto analysis, histogram, scatter diagram, control charts.

Scatter Bubble Chart Ppt PowerPoint Presentation Backgrounds
This is a scatter bubble chart ppt powerpoint presentation backgrounds. This is a one stage process. The stages in this process are bubble chart, finance, marketing, analysis, strategy, business.

Combo Chart Ppt PowerPoint Presentation Ideas Outfit
This is a combo chart ppt powerpoint presentation ideas outfit. This is a four stage process. The stages in this process are combo chart, finance, analysis, marketing, strategy, business.

Area Chart Ppt PowerPoint Presentation Model Influencers
This is a area chart ppt powerpoint presentation model influencers. This is a two stage process. The stages in this process are sales in percentage, chart, business, marketing, finance.
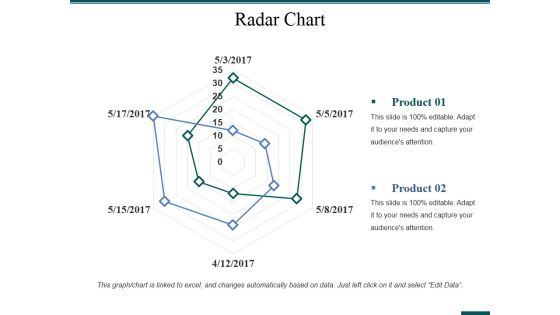
Radar Chart Ppt PowerPoint Presentation Layouts Gallery
This is a radar chart ppt powerpoint presentation layouts gallery. This is a two stage process. The stages in this process are business, analysis, strategy, marketing, radar chart, finance.
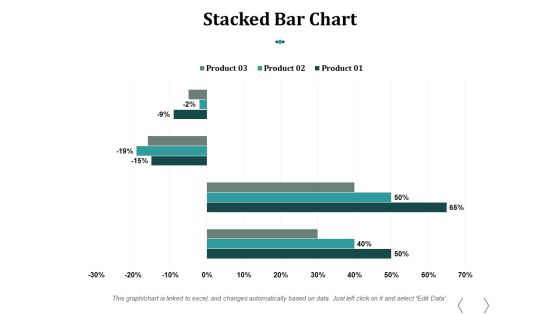
Stacked Bar Chart Ppt PowerPoint Presentation Influencers
This is a stacked bar chart ppt powerpoint presentation influencers. This is a three stage process. The stages in this process are stacked bar chart, product, percentage, finance, business.

Employee Incentive Compensation Ppt PowerPoint Presentation File Themes Cpb
This is a employee incentive compensation ppt powerpoint presentation file themes cpb. This is a four stage process. The stages in this process are employee incentive compensation.

Industry Overview Percentage Chart Ppt Slides
This is a industry overview percentage chart ppt slides. This is a two stage process. The stages in this process are business, marketing.

Market Gap Analysis Chart Ppt Slides
This is a market gap analysis chart ppt slides. This is a one stage process. The stages in this process are business, marketing.
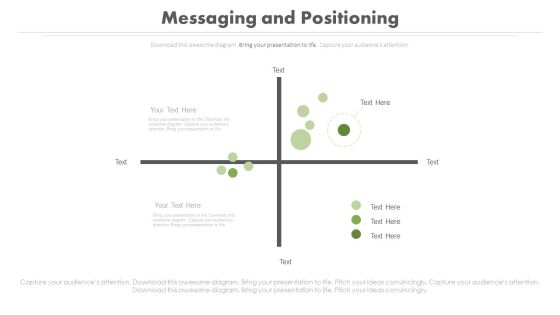
Messaging And Positioning Line Chart Ppt Slides
This is a messaging and positioning line chart ppt slides. This is a two stage process. The stages in this process are business, marketing.
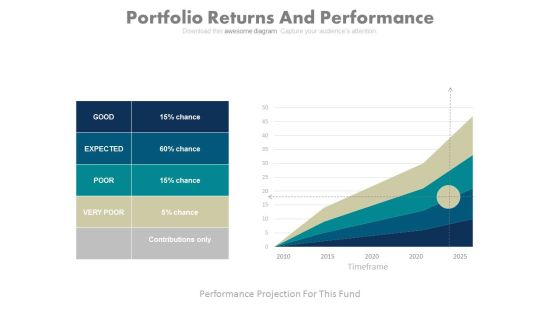
Portfolio Returns And Performance Chart Ppt Slides
This is a portfolio returns and performance chart ppt slides. This is a five stage process. The stages in this process are business, finance, marketing.
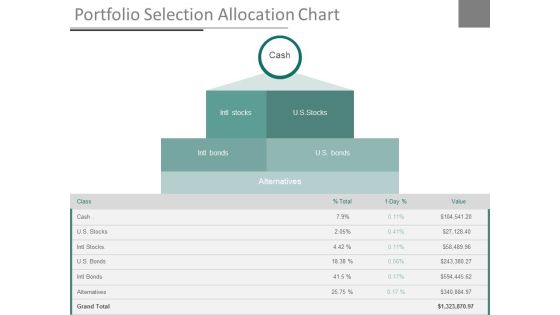
Portfolio Selection Allocation Chart Ppt Slides
This is a portfolio selection allocation chart ppt slides. This is a one stage process. The stages in this process are business, finance, marketing.

Resource Capacity Planning Percentage Chart Ppt Slides
This is a resource capacity planning percentage chart ppt slides. This is a four stage process. The stages in this process are business, finance, marketing.

Customer Service Benchmarking Chart Ppt Slides
This is a customer service benchmarking chart ppt slides. This is a eight stage process. The stages in this process are finance, business, marketing.

Health Scorecard Table Chart Powerpoint Ideas
This is a health scorecard table chart powerpoint ideas. This is a two stage process. The stages in this process are overall score, qualitative aspects, quantitative aspects.

Competitors Mapping Chart Ppt Examples Professional
This is a competitors mapping chart ppt examples professional. This is a six stage process. The stages in this process are competitor, series.

Data Driven Analytics Chart Powerpoint Presentation Templates
This is a data driven analytics chart powerpoint presentation templates. This is a five stage process. The stages in this process are category.
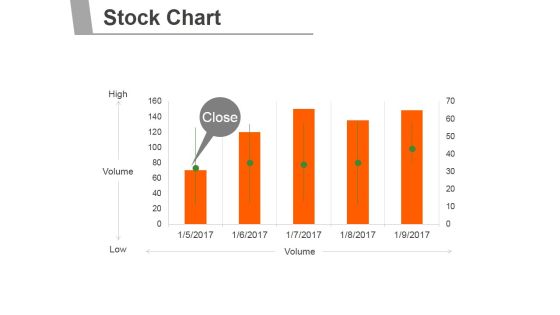
Stock Chart Ppt PowerPoint Presentation Design Templates
This is a stock chart ppt powerpoint presentation design templates. This is a five stage process. The stages in this process are business, marketing, finance, planning, management.

Area Chart Ppt PowerPoint Presentation Images
This is a area chart ppt powerpoint presentation images. This is a two stage process. The stages in this process are business, strategy, marketing, analysis, finance.

Stock Chart Ppt PowerPoint Presentation Infographics
This is a stock chart ppt powerpoint presentation infographics. This is a five stage process. The stages in this process are high, volume, low.

Stock Chart Ppt PowerPoint Presentation Slides
This is a stock chart ppt powerpoint presentation slides. This is a five stage process. The stages in this process are close, volume, high, low.
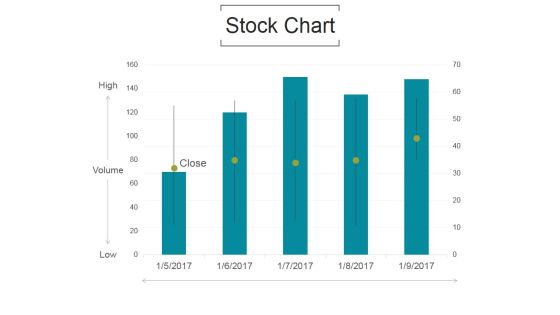
Stock Chart Ppt PowerPoint Presentation Example File
This is a stock chart ppt powerpoint presentation example file. This is a five stage process. The stages in this process are volume, high, low, close.

Stock Chart Ppt PowerPoint Presentation Inspiration
This is a stock chart ppt powerpoint presentation inspiration. This is a five stage process. The stages in this process are high, volume, low, close.
Stock Chart Ppt PowerPoint Presentation Professional
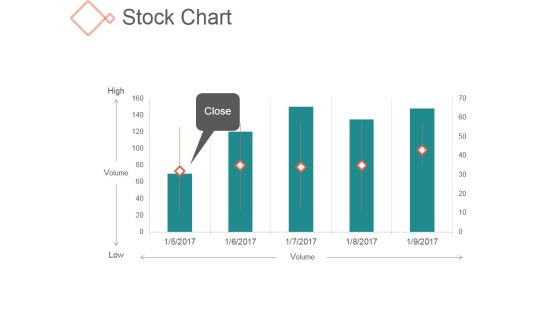
This is a stock chart ppt powerpoint presentation professional. This is a five stage process. The stages in this process are high, volume, low, close.
Stock Chart Ppt PowerPoint Presentation Topics
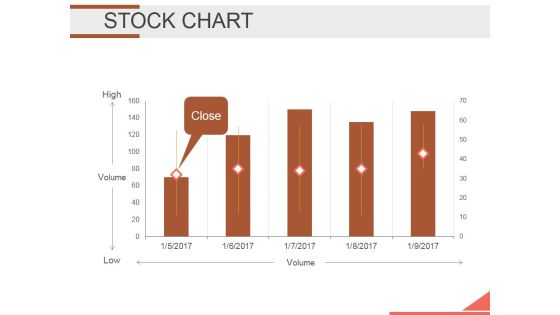
This is a stock chart ppt powerpoint presentation topics. This is a five stage process. The stages in this process are high, volume, low, volume.
Stock Chart Ppt PowerPoint Presentation Show Layout
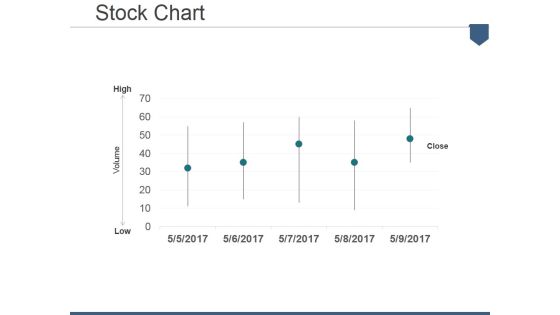
This is a stock chart ppt powerpoint presentation show layout. This is a five stage process. The stages in this process are low, volume, high, close.
Stock Chart Ppt PowerPoint Presentation Ideas Example
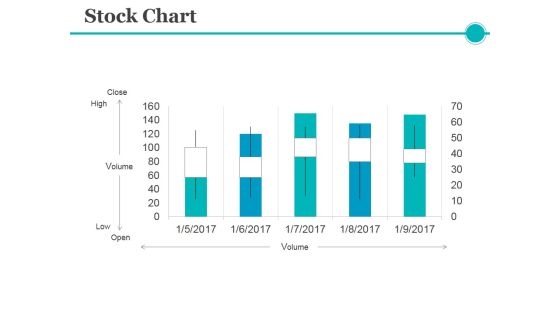
This is a stock chart ppt powerpoint presentation ideas example. This is a five stage process. The stages in this process are volume, close, high, low, open.

Stock Chart Ppt PowerPoint Presentation Ideas Brochure
This is a stock chart ppt powerpoint presentation ideas brochure. This is a five stage process. The stages in this process are high, volume, low, close.

Pie Chart Ppt PowerPoint Presentation Infographics Aids
This is a pie chart ppt powerpoint presentation infographics aids. This is a three stage process. The stages in this process are business, finance, management, strategy, planning.
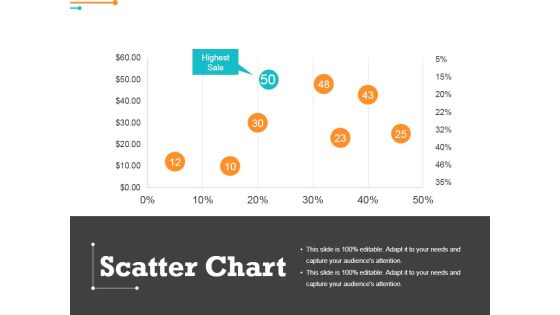
Scatter Chart Ppt PowerPoint Presentation Outline Graphics
This is a scatter chart ppt powerpoint presentation outline graphics. This is a eight stage process. The stages in this process are highest sale, percentage, finance, business.
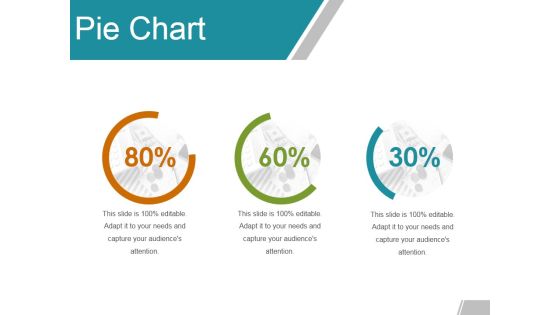
Pie Chart Ppt PowerPoint Presentation Summary Slide
This is a pie chart ppt powerpoint presentation summary slide. This is a three stage process. The stages in this process are percentage, finance, marketing, business.

Stock Chart Ppt PowerPoint Presentation Portfolio Infographics
This is a stock chart ppt powerpoint presentation portfolio infographics. This is a five stage process. The stages in this process are high, volume, low, finance, business.

Area Chart Ppt PowerPoint Presentation Slides Inspiration
This is a area chart ppt powerpoint presentation slides inspiration. This is a two stage process. The stages in this process are business, marketing, finance, growth, management.

Column Chart Ppt PowerPoint Presentation Show Shapes
This is a column chart ppt powerpoint presentation show shapes. This is a two stage process. The stages in this process are sales, product, business, management, finance.
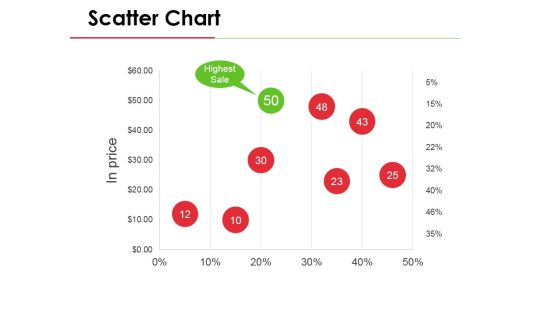
Scatter Chart Ppt PowerPoint Presentation Model Deck
This is a scatter chart ppt powerpoint presentation model deck. This is a eight stage process. The stages in this process are business, marketing, finance, management, strategy.

Line Chart Ppt PowerPoint Presentation Gallery Summary
This is a line chart ppt powerpoint presentation gallery summary. This is a two stage process. The stages in this process are finance, graph, business, management, marketing.

Area Chart Ppt PowerPoint Presentation Slides Gridlines
This is a area chart ppt powerpoint presentation slides gridlines. This is a two stage process. The stages in this process are business, finance, marketing, percentage.

Bar Chart Ppt PowerPoint Presentation Slides Shapes
This is a bar chart ppt powerpoint presentation slides shapes. This is a seven stage process. The stages in this process are bar graph, finance, marketing, strategy, analysis.

Stock Chart Ppt PowerPoint Presentation Gallery Files
This is a stock chart ppt powerpoint presentation gallery files. This is a five stage process. The stages in this process are high, volume, low, close.
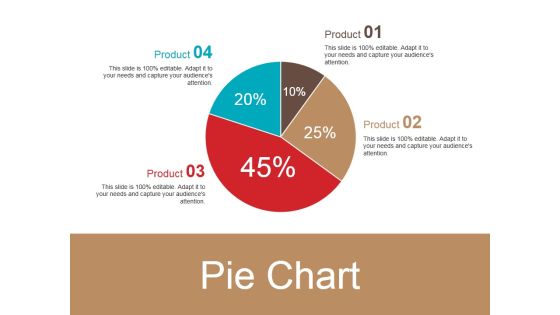
Pie Chart Ppt PowerPoint Presentation Ideas Slideshow
This is a pie chart ppt powerpoint presentation ideas slideshow. This is a four stage process. The stages in this process are pie, process, percentage, finance, business.

Line Chart Ppt PowerPoint Presentation Portfolio Shapes
This is a line chart ppt powerpoint presentation portfolio shapes. This is a two stage process. The stages in this process are profit, product, business, marketing, graph.
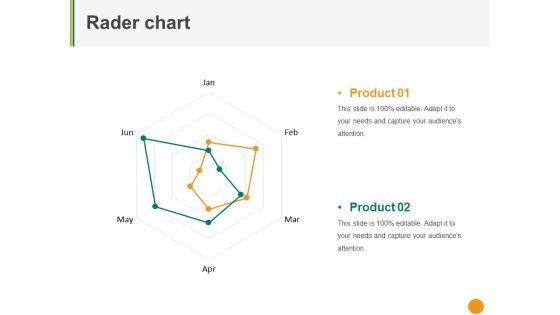
Rader Chart Ppt PowerPoint Presentation Professional Pictures
This is a rader chart ppt powerpoint presentation professional pictures. This is a two stage process. The stages in this process are product, finance, business, marketing.

Bar Chart Ppt PowerPoint Presentation Summary Pictures
This is a bar chart ppt powerpoint presentation summary pictures. This is a four stage process. The stages in this process are product, unit count, finance, percentage, business.
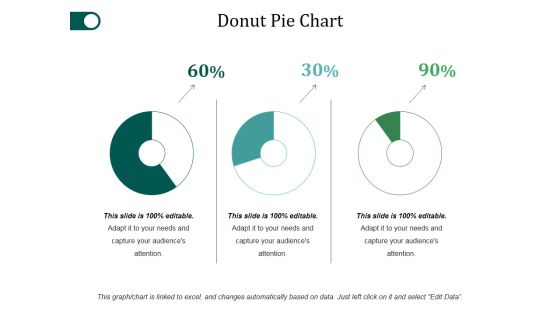
Donut Pie Chart Ppt PowerPoint Presentation Examples
This is a donut pie chart ppt powerpoint presentation examples. This is a three stage process. The stages in this process are percentage, finance, donut, business.

Bubble Chart Ppt PowerPoint Presentation Outline Smartart
This is a bubble chart ppt powerpoint presentation outline smartart. This is a two stage process. The stages in this process are analysis, finance, business, marketing, strategy.

Clustered Chart Ppt PowerPoint Presentation Inspiration Templates
This is a clustered chart ppt powerpoint presentation inspiration templates. This is a three stage process. The stages in this process are finance, marketing, management, investment, analysis.

Column Chart Ppt PowerPoint Presentation Slides Format
This is a column chart ppt powerpoint presentation slides format. This is a two stage process. The stages in this process are finance, marketing, management, investment, analysis.

Column Chart Ppt PowerPoint Presentation Show Outfit
This is a column chart ppt powerpoint presentation show outfit. This is a two stage process. The stages in this process are product, percentage, marketing.

Combo Chart Ppt PowerPoint Presentation Model Grid
This is a combo chart ppt powerpoint presentation model grid. This is a three stage process. The stages in this process are growth, product, percentage, marketing.

Line Chart Ppt PowerPoint Presentation Summary Guidelines
This is a line chart ppt powerpoint presentation summary guidelines. This is a two stage process. The stages in this process are percentage, product, business, management, marketing.

Stock Chart Ppt PowerPoint Presentation Show Pictures
This is a stock chart ppt powerpoint presentation show pictures. This is a five stage process. The stages in this process are product, percentage, management, marketing.

Column Chart Ppt PowerPoint Presentation Gallery Templates
This is a column chart ppt powerpoint presentation gallery templates. This is a two stage process. The stages in this process are management, marketing, business, percentage.

Column Chart Ppt PowerPoint Presentation Ideas Example
This is a column chart ppt powerpoint presentation ideas example. This is a five stage process. The stages in this process are percentage, product, management, marketing.
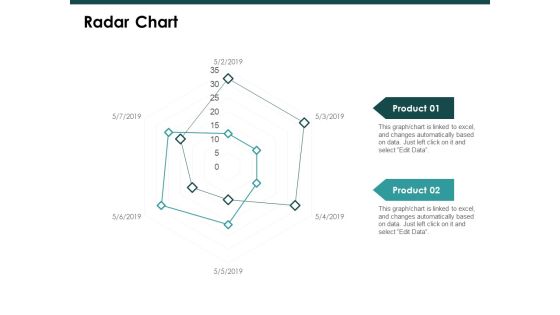
Radar Chart Graph Ppt PowerPoint Presentation Slide
This is a radar chart graph ppt powerpoint presentation slide. This is a two stage process. The stages in this process are finance, marketing, management, investment, analysis.

Pie Chart Finance Ppt Powerpoint Presentation Introduction
This is a pie chart finance ppt powerpoint presentation introduction. This is a three stage process. The stages in this process are finance, marketing, analysis, investment, strategy.

Extreme Programming Methodology Revenue Loss To The Company Themes PDF
This slide shows the revenue loss to the company because of project failures which happen to be around 1.7 trillion. Present like a pro with Extreme Programming Methodology Revenue Loss To The Company Themes PDF Create beautiful presentations together with your team, using our easy to use presentation slides. Share your ideas in real time and make changes on the fly by downloading our templates. So whether you are in the office, on the go, or in a remote location, you can stay in sync with your team and present your ideas with confidence. With Slidegeeks presentation got a whole lot easier. Grab these presentations today.
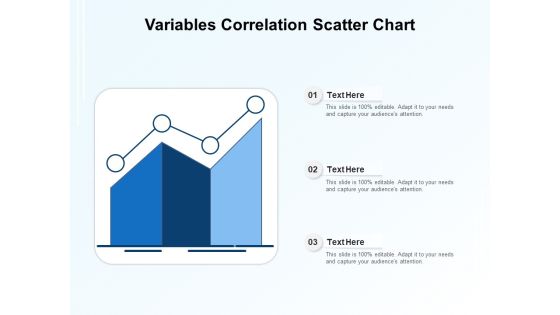
Variables Correlation Scatter Chart Ppt PowerPoint Presentation Model Smartart PDF
Presenting variables correlation scatter chart ppt powerpoint presentation model smartart pdf to dispense important information. This template comprises three stages. It also presents valuable insights into the topics including variables correlation scatter chart. This is a completely customizable PowerPoint theme that can be put to use immediately. So, download it and address the topic impactfully.
Project Portfolio Data Analysis Chart Ppt Ideas Gallery PDF
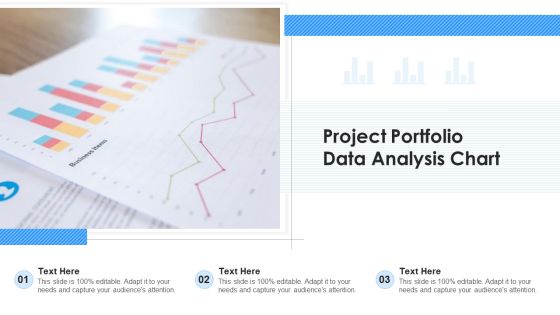
Presenting project portfolio data analysis chart ppt ideas gallery pdf to dispense important information. This template comprises three stages. It also presents valuable insights into the topics including project portfolio data analysis chart. This is a completely customizable PowerPoint theme that can be put to use immediately. So, download it and address the topic impactfully.

Business Objective Presentation Chart Of Provenance Data Download PDF
Presenting business objective presentation chart of provenance data download pdf to dispense important information. This template comprises five stages. It also presents valuable insights into the topics including business objective presentation chart of provenance data. This is a completely customizable PowerPoint theme that can be put to use immediately. So, download it and address the topic impactfully.

Statistical Data Analysis Chart Of Collected Data Formats PDF
Presenting statistical data analysis chart of collected data formats pdf to dispense important information. This template comprises four stages. It also presents valuable insights into the topics including statistical data analysis chart of collected data. This is a completely customizable PowerPoint theme that can be put to use immediately. So, download it and address the topic impactfully.
Sales Activities Dashboard Ppt PowerPoint Presentation Ideas Themes
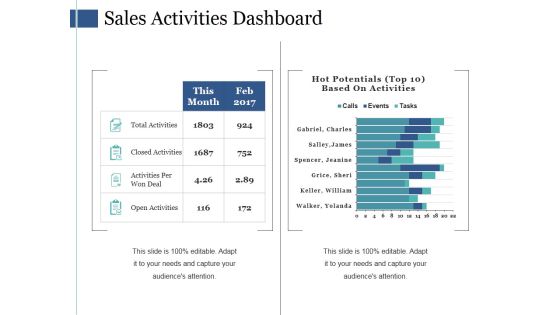
This is a sales activities dashboard ppt powerpoint presentation ideas themes. This is a two stage process. The stages in this process are total activities, closed activities, activities per won deal, open activities.

Cash Flow Statement Kpis Ppt PowerPoint Presentation Styles Themes
This is a cash flow statement kpis ppt powerpoint presentation styles themes. This is a four stage process. The stages in this process are business, operations, operating profit, total liabilities, current liabilities.

Clustered Bar Finance Ppt Powerpoint Presentation Ideas Themes
This is a clustered bar finance ppt powerpoint presentation ideas themes. This is a three stage process. The stages in this process are clustered bar, product, in percentage, years, profit.
Infographic Chart For Marketing Information Powerpoint Slides
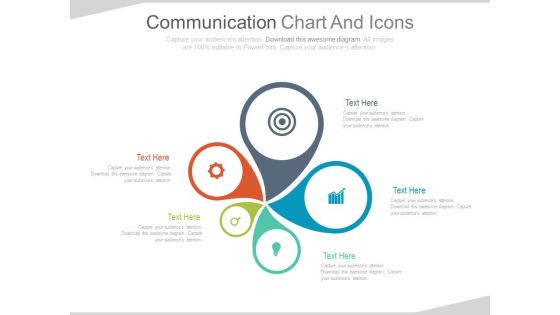
This PowerPoint template contains circular infographic chart. You may download this PPT slide to display marketing information in visual manner. You can easily customize this template to make it more unique as per your need.
Pipeline Percentage Analysis Chart Powerpoint Slides
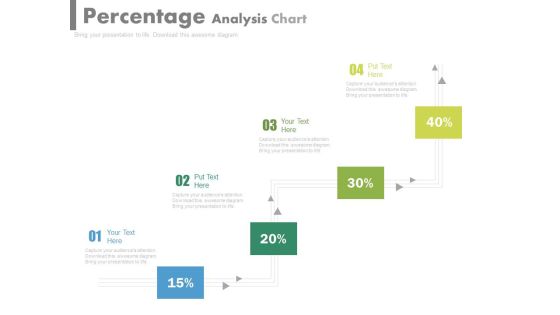
This PowerPoint template has been designed with pipeline percentage analysis chart. This PPT slide can be used to display business strategy plan. You can download finance PowerPoint template to prepare awesome presentations.

Environmental Management Accounting System Chart Ppt Slides
This is a environmental management accounting system chart ppt slides. This is a six stage process. The stages in this process are overheads, environmental cost, direct labour, environmental cost, direct material, environmental cost.
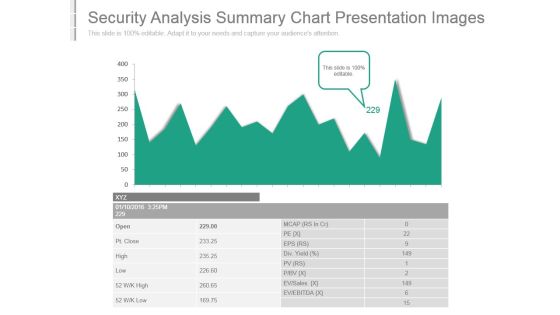
Security Analysis Summary Chart Presentation Images
This is a security analysis summary chart presentation images. This is a one stage process. The stages in this process are ev ebitda, ev sales, div yield, open, pt close, high, low, mcap, eps.

Bar Chart Ppt PowerPoint Presentation Background Designs
This is a bar chart ppt powerpoint presentation background designs. This is a twelve stage process. The stages in this process are bar graph, finance, marketing, strategy, analysis, investment.

Column Chart Ppt PowerPoint Presentation Background Designs
This is a column chart ppt powerpoint presentation background designs. This is a two stage process. The stages in this process are bar graph, finance, marketing, strategy, analysis, business.

Combo Chart Ppt PowerPoint Presentation Infographics Infographics
This is a combo chart ppt powerpoint presentation infographics infographics. This is a three stage process. The stages in this process are bar graph, growth, finance, marketing, strategy, business.

Scatter Chart Ppt PowerPoint Presentation Summary Visuals
This is a scatter chart ppt powerpoint presentation summary visuals. This is a eight stage process. The stages in this process are product, profit in sales, in percentage, finance, business.

Combo Chart Ppt PowerPoint Presentation Gallery Mockup
This is a clustered column ppt powerpoint presentation portfolio good. This is a three stage process. The stages in this process are business, marketing, strategy, finance, planning.
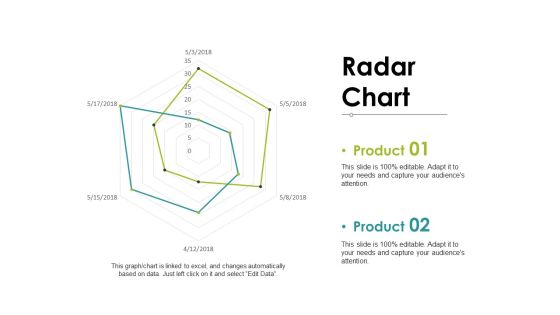
Radar Chart Ppt PowerPoint Presentation Ideas Mockup
This is a stacked column ppt powerpoint presentation pictures layouts. This is a two stage process. The stages in this process are business, marketing, planning, finance, strategy.
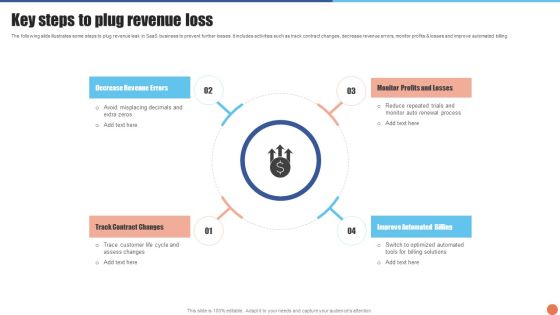
Key Steps To Plug Revenue Loss Diagrams PDF
The following slide illustrates some steps to plug revenue leak in SaaS business to prevent further losses. It includes activities such as track contract changes, decrease revenue errors, monitor profits and losses and improve automated billing. Presenting Key Steps To Plug Revenue Loss Diagrams PDF to dispense important information. This template comprises four stages. It also presents valuable insights into the topics including Decrease Revenue, Track Contract Changes, Improve Automated Billing. This is a completely customizable PowerPoint theme that can be put to use immediately. So, download it and address the topic impactfully.

Bar Diagram Ppt PowerPoint Presentation File Graphics
This is a bar diagram ppt powerpoint presentation file graphics. This is a five stage process. The stages in this process are bar diagram, business, years, marketing, management.
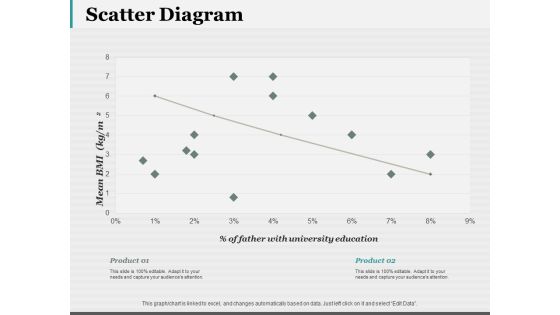
Scatter Diagram Ppt PowerPoint Presentation Model Mockup
This is a scatter diagram ppt powerpoint presentation model mockup. This is a two stage process. The stages in this process are scatter diagram, finance, marketing, strategy, business.

Project Management Gantt Chart Ppt Powerpoint Images
This is a project management gantt chart ppt powerpoint images. This is a seven stage process. The stages in this process are requirement, setup, development, testing, deployment, training, support, project ma, review, coding, integration tests, customer tests, go live, training, support, project management.

Capital Expenditure Details Fy 18 Ppt PowerPoint Presentation Diagram Images
This is a capital expenditure details fy 18 ppt powerpoint presentation diagram images. This is a six stage process. The stages in this process are business, finance, analysis, strategy, marketing.
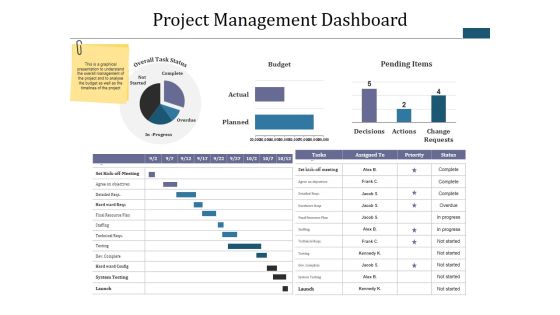
Project Management Dashboard Ppt PowerPoint Presentation Infographic Template Diagrams
This is a project management dashboard ppt powerpoint presentation infographic template diagrams. This is a three stage process. The stages in this process are budget, pending items, complete, overdue, not started.

Business Process Maturity Factors Chart Information PDF
The slide carries a maturity factors for successful execution of business process management function . Various levels included are silo, tactical integration, process orientation, optimized enterprise and intelligent network. Persuade your audience using this Business Process Maturity Factors Chart Information PDF. This PPT design covers one stages, thus making it a great tool to use. It also caters to a variety of topics including Information Technology, Process Management, Employee Management. Download this PPT design now to present a convincing pitch that not only emphasizes the topic but also showcases your presentation skills.

Pipeline Quality Ppt PowerPoint Presentation Portfolio Diagrams
This is a pipeline quality ppt powerpoint presentation portfolio diagrams. This is a five stage process. The stages in this process are business, marketing, finance, graph, plan.

Bar Diagram Ppt PowerPoint Presentation Show Maker
This is a bar diagram ppt powerpoint presentation show maker. This is a seven stage process. The stages in this process are bar graph, finance, marketing, strategy, business.

Bar Diagram Ppt Powerpoint Presentation Styles Outline
This is a bar diagram ppt powerpoint presentation styles outline. This is a three stage process. The stages in this process are business, management, finance, analysis, marketing.

Clustered Column Ppt PowerPoint Presentation Styles Diagrams
This is a clustered column ppt powerpoint presentation styles diagrams. This is a two stage process. The stages in this process are business, marketing, graph, finance, clustered column.

Stacked Bar Ppt PowerPoint Presentation Summary Diagrams
This is a stacked bar ppt powerpoint presentation summary diagrams. This is a four stage process. The stages in this process are business, marketing, strategy, planning, finance.

Clustered Bar Ppt PowerPoint Presentation Diagram Templates
This is a clustered bar ppt powerpoint presentation diagram templates. This is a three stage process. The stages in this process are business, marketing, unit count, finance, strategy.

Control Charts A True Control Chart Ppt PowerPoint Presentation Inspiration Examples
This is a control charts a true control chart ppt powerpoint presentation inspiration examples. This is a five stage process. The stages in this process are product, percentage, marketing, business, management.
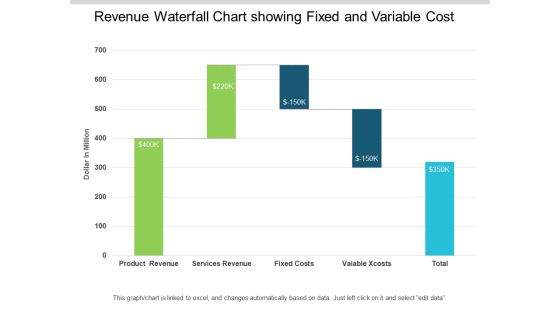
Revenue Waterfall Chart Showing Fixed And Variable Cost Ppt PowerPoint Presentation Infographic Template Images
This is a revenue waterfall chart showing fixed and variable cost ppt powerpoint presentation infographic template images. This is a five stage process. The stages in this process are sales waterfall, waterfall chart, business.

Waterfall Chart With Merchandising Sales Cost And Net Revenue Ppt PowerPoint Presentation Summary Show
This is a waterfall chart with merchandising sales cost and net revenue ppt powerpoint presentation summary show. This is a three stage process. The stages in this process are sales waterfall, waterfall chart, business.

Area Stacked Ppt PowerPoint Presentation Diagram Images
This is a area stacked ppt powerpoint presentation diagram images. This is a two stage process. The stages in this process are sales in percentage, product, business, marketing, finance.

Global Business Sustainability Reporting Statistics Themes PDF
This slide highlights statistical data of global business for sustainability reporting to provide transparency on the companys contribution to sustainable development. It includes key components such as global business, top companies, globally followed corporate practices, etc. If you are looking for a format to display your unique thoughts, then the professionally designed Global Business Sustainability Reporting Statistics Themes PDF is the one for you. You can use it as a Google Slides template or a PowerPoint template. Incorporate impressive visuals, symbols, images, and other charts. Modify or reorganize the text boxes as you desire. Experiment with shade schemes and font pairings. Alter, share or cooperate with other people on your work. Download Global Business Sustainability Reporting Statistics Themes PDF and find out how to give a successful presentation. Present a perfect display to your team and make your presentation unforgettable.

Reasons To Invest In Green Energy Clean And Renewable Energy Ppt PowerPoint Presentation Diagram Graph Charts PDF
This slide illustrates why people, organizations, and governments should invest in green energy by describing the impact of fossil fuels and non-renewable energies.Presenting Reasons To Invest In Green Energy Clean And Renewable Energy Ppt PowerPoint Presentation Diagram Graph Charts PDF to provide visual cues and insights. Share and navigate important information on two stages that need your due attention. This template can be used to pitch topics like Problems Traditional, Energy Sources, Solutions Provided. In addtion, this PPT design contains high resolution images, graphics, etc, that are easily editable and available for immediate download.
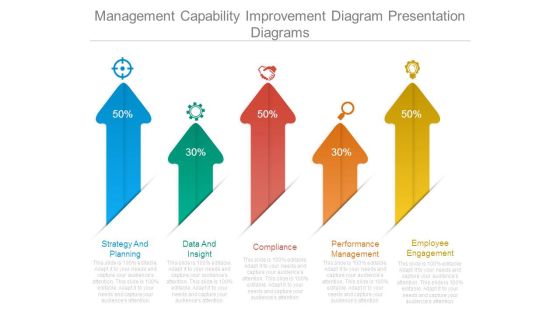
Management Capability Improvement Diagram Presentation Diagrams
This is a management capability improvement diagram presentation diagrams. This is a five stage process. The stages in this process are strategy and planning, data and insight, compliance, performance management, employee engagement.
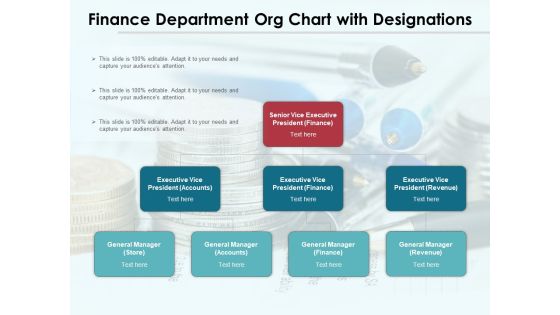
Finance Department Org Chart With Designations Ppt PowerPoint Presentation Professional Show PDF
Presenting finance department org chart with designations ppt powerpoint presentation professional show pdf to dispense important information. This template comprises one stages. It also presents valuable insights into the topics including finance, accounts, revenue, store. This is a completely customizable PowerPoint theme that can be put to use immediately. So, download it and address the topic impactfully.

Cost And Benefits Of New Product Ppt PowerPoint Presentation Inspiration Diagrams
This is a cost and benefits of new product ppt powerpoint presentation inspiration diagrams. This is a three stage process. The stages in this process are recurrent costs, cost decreasing, revenue increasing, benefits, costs.
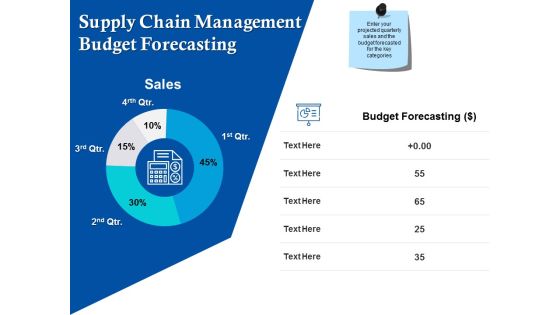
Supply Chain Management Budget Forecasting Ppt Powerpoint Presentation File Themes
This is a supply chain management budget forecasting ppt powerpoint presentation file themes. This is a four stage process. The stages in this process are finance, marketing, management, investment, analysis.

Column Chart Analysis Ppt Powerpoint Presentation Summary Infographics
This is a column chart analysis ppt powerpoint presentation summary infographics. This is a three stage process. The stages in this process are column chart, finance, marketing, management, analysiscolumn chart, finance, marketing, management, analysis.

Radar Chart With Markers Ppt PowerPoint Presentation Portfolio Slides
This is a radar chart with markers ppt powerpoint presentation portfolio slides. This is a three stage process. The stages in this process are radar chart, markers, product.

Filled Radar Chart Ppt PowerPoint Presentation File Information
This is a filled radar chart ppt powerpoint presentation file information. This is a two stage process. The stages in this process are chart, business, marketing, finance, strategy.
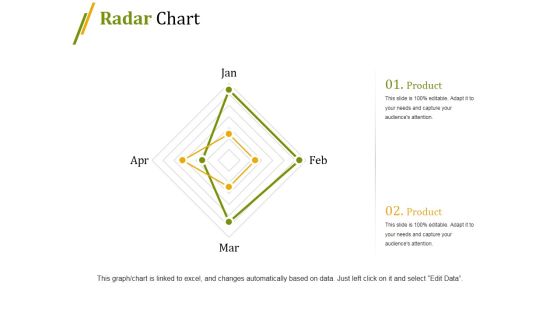
Radar Chart Ppt PowerPoint Presentation Infographic Template Professional
This is a radar chart ppt powerpoint presentation infographic template professional. This is a four stage process. The stages in this process are chart, finance, marketing, business, strategy.

Radar Chart Ppt PowerPoint Presentation Gallery Example File
This is a radar chart ppt powerpoint presentation gallery example file. This is a three stage process. The stages in this process are radar chart, business, marketing, finance.

Radar Chart Ppt PowerPoint Presentation Summary Background Images
This is a radar chart ppt powerpoint presentation summary background images. This is a two stage process. The stages in this process are chart, business, marketing, finance, strategy.
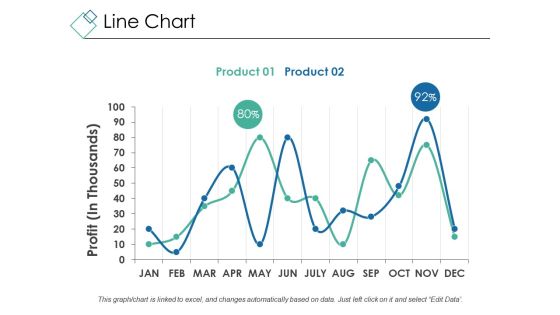
Line Chart Ppt PowerPoint Presentation Outline Design Ideas
This is a line chart ppt powerpoint presentation outline design ideas. This is a two stage process. The stages in this process are profit, percentage, chart, business, marketing.

Bubble Chart Ppt PowerPoint Presentation Styles Example Topics
This is a bubble chart ppt powerpoint presentation styles example topics. This is a two stage process. The stages in this process are profit, chart, business, marketing, finance.
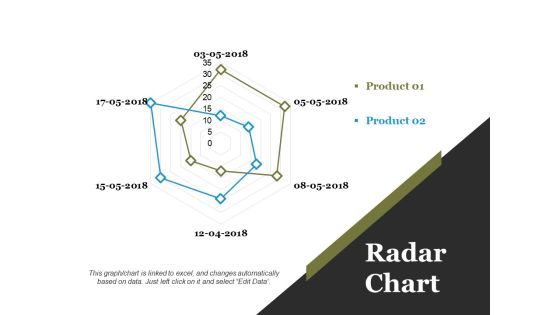
Radar Chart Ppt PowerPoint Presentation Ideas Background Images
This is a radar chart ppt powerpoint presentation ideas background images. This is a two stage process. The stages in this process are chart, business, marketing, finance, strategy.

Bubble Chart Ppt PowerPoint Presentation Summary Graphic Tips
This is a bubble chart ppt powerpoint presentation summary graphic tips. This is a three stage process. The stages in this process are chart, business, marketing, finance, strategy.
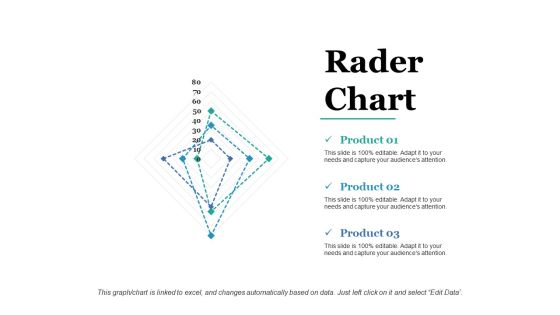
Rader Chart Ppt PowerPoint Presentation Infographic Template Graphics
This is a rader chart ppt powerpoint presentation infographic template graphics. This is a three stage process. The stages in this process are rader, chart, business, marketing, finance.
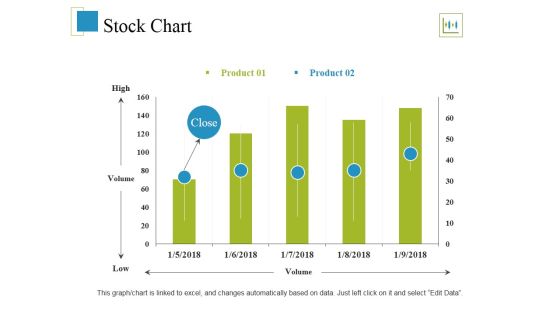
Stock Chart Ppt PowerPoint Presentation Show Design Inspiration
This is a stock chart ppt powerpoint presentation show design inspiration. This is a two stage process. The stages in this process are high, volume, low, stock chart.

Bubble Chart Ppt PowerPoint Presentation Infographic Template Example Introduction
This is a bubble chart ppt powerpoint presentation infographic template example introduction. This is a two stage process. The stages in this process are product, bubble chart, business.

Bubble Chart Product Ppt PowerPoint Presentation Professional Model
This is a bubble chart product ppt powerpoint presentation professional model. This is two stage process. The stages in this process are bubble chart, finance, business, strategy, marketing.
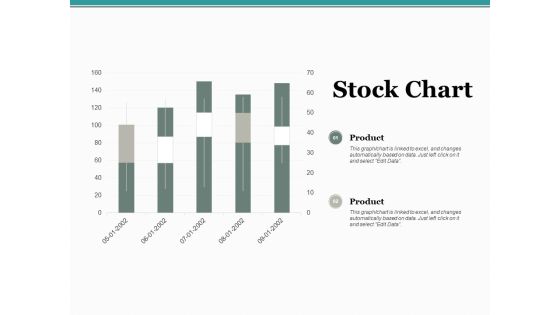
Stock Chart Ppt PowerPoint Presentation Professional Slide Download
This is a stock chart ppt powerpoint presentation professional slide download. This is a two stage process. The stages in this process are product, percentage, management, marketing, chart.

Global Money Markets Example Diagram Powerpoint Slide
This is a global money markets example diagram powerpoint slide. This is a four stage process. The stages in this process are digital wallet, investment, money control, ecommerce.

Revenue Cost Per Employee Comparison Ppt PowerPoint Presentation Diagram Lists
This is a revenue cost per employee comparison ppt powerpoint presentation diagram lists. This is a seven stage process. The stages in this process are year, graph, management, finance, company rpe.
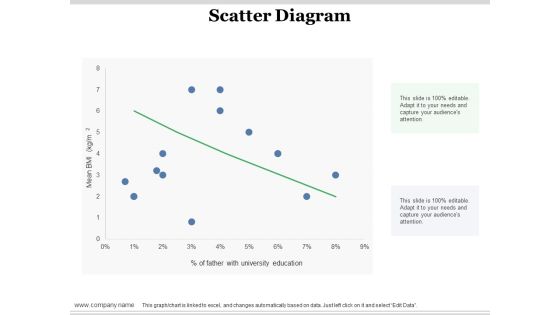
Scatter Diagram Ppt PowerPoint Presentation Infographic Template Design Ideas
This is a scatter diagram ppt powerpoint presentation infographic template design ideas. This is a one stage process. The stages in this process are scatter diagram, finance, in percentage, business, bar graph.
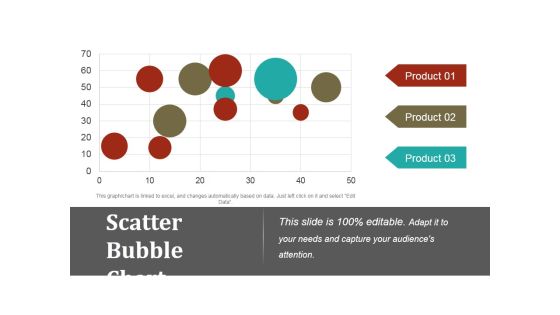
Scatter Bubble Chart Ppt PowerPoint Presentation Outline Rules
This is a scatter bubble chart ppt powerpoint presentation outline rules. This is a three stage process. The stages in this process are scatter bubble chart, product, finance, marketing, business.

Stacked Column Chart Ppt PowerPoint Presentation Infographics Smartart
This is a stacked column chart ppt powerpoint presentation infographics smartart. This is a two stage process. The stages in this process are stacked column chart, business, finance, marketing, strategy.
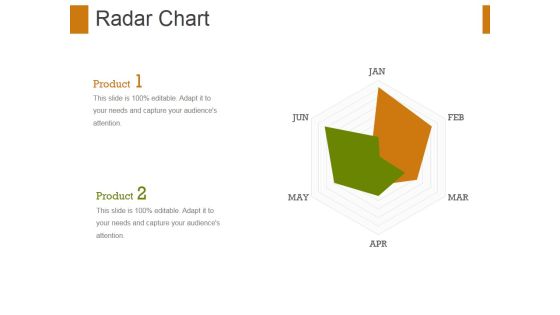
Radar Chart Ppt PowerPoint Presentation Show Graphic Tips
This is a radar chart ppt powerpoint presentation show graphic tips. This is a two stage process. The stages in this process are radar chart, finance, management, marketing, business, analysis.
