AI PPT Maker
Templates
PPT Bundles
Design Services
Business PPTs
Business Plan
Management
Strategy
Introduction PPT
Roadmap
Self Introduction
Timelines
Process
Marketing
Agenda
Technology
Medical
Startup Business Plan
Cyber Security
Dashboards
SWOT
Proposals
Education
Pitch Deck
Digital Marketing
KPIs
Project Management
Product Management
Artificial Intelligence
Target Market
Communication
Supply Chain
Google Slides
Research Services
 One Pagers
All Categories
-
Home
- Customer Favorites
- Financial Icons
Financial Icons

Benefits Of Building Strong Brand Advertisement Plan Designs PDF
The following slide outlines several advantages of developing brand marketing plan for improving whole company performance and productivity. Its key benefits are building financial value, creating positive firm culture, increase productivity by aligning employees, boost marketing and sales growth and driving emotional response. Presenting Benefits Of Building Strong Brand Advertisement Plan Designs PDF to dispense important information. This template comprises five stages. It also presents valuable insights into the topics including Financial Value, Sales Growth, Firm Culture. This is a completely customizable PowerPoint theme that can be put to use immediately. So, download it and address the topic impactfully.
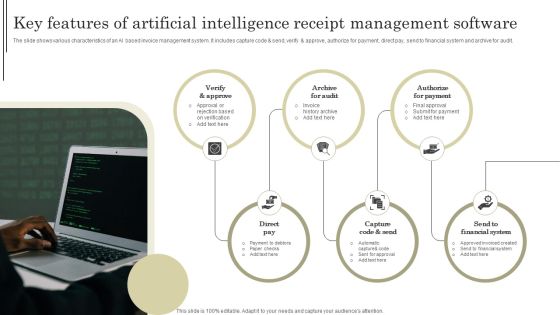
Key Features Of Artificial Intelligence Receipt Management Software Mockup PDF
The slide shows various characteristics of an AI based invoice management system. It includes capture code and send, verify and approve, authorize for payment, direct pay, send to financial system and archive for audit. Presenting Key Features Of Artificial Intelligence Receipt Management Software Mockup PDF to dispense important information. This template comprises six stages. It also presents valuable insights into the topics including Direct pay, Send to financial system, Authorize for payment, Archive for audit. This is a completely customizable PowerPoint theme that can be put to use immediately. So, download it and address the topic impactfully.

Communication Plan For Internal Risk Management In Real Estate Development Infographics PDF
This slide highlights risk management communication plan for internal teams of real estate sector. This slide aims to showcase techniques to mitigate various development risks such as construction risk, financial risk, market risk and legal risk. It includes sections such as risk, goal, example, mode , responsibility and target audience. Presenting Communication Plan For Internal Risk Management In Real Estate Development Infographics PDF to dispense important information. This template comprises one stages. It also presents valuable insights into the topics including Construction Risk, Financial Risk, Market Risk. This is a completely customizable PowerPoint theme that can be put to use immediately. So, download it and address the topic impactfully.

Major Integration Of Operations Management And Control Software Slides PDF
This slide showcase some of the essential integration of softwares along with OMS operation management software in order to improve overall efficiency. It includes BI integration,SCM software, HRM software, financial software, product cycle management software etc. Presenting Major Integration Of Operations Management And Control Software Slides PDF to dispense important information. This template comprises seven stages. It also presents valuable insights into the topics including CRM Software, Financial Software, Business Integration Tools. This is a completely customizable PowerPoint theme that can be put to use immediately. So, download it and address the topic impactfully.
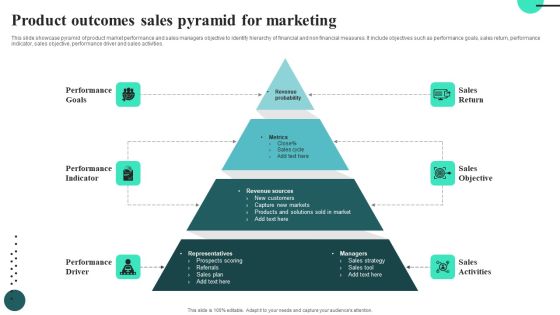
Product Outcomes Sales Pyramid For Marketing Information PDF
This slide showcase pyramid of product market performance and sales managers objective to identify hierarchy of financial and non financial measures. It include objectives such as performance goals, sales return, performance indicator, sales objective, performance driver and sales activities.Presenting Product Outcomes Sales Pyramid For Marketing Information PDF to dispense important information. This template comprises four stages. It also presents valuable insights into the topics including Sales Return, Sales Objective. This is a completely customizable PowerPoint theme that can be put to use immediately. So, download it and address the topic impactfully.
Challenges In Merger And Procurement Strategic Process Clipart PDF
This slide presents solutions to overcome challenges during merger and acquisition process. It includes communication challenges, employee retention challenges, lack of financial targets, inadequate due diligence, and cultural clashes. Presenting Challenges In Merger And Procurement Strategic Process Clipart PDF to dispense important information. This template comprises three stages. It also presents valuable insights into the topics including Communication Challenges, Employee Retention Challenges, Lack Of Financial Targets. This is a completely customizable PowerPoint theme that can be put to use immediately. So, download it and address the topic impactfully.

Application Of Robotic Process Automation Across Multiple Industries Inspiration PDF
This slide highlights the application of robotic process automation RPA in various industries to increase work accuracy. It includes industries such as banking and financial services, healthcare industry, supply chain automation, etc. Presenting Application Of Robotic Process Automation Across Multiple Industries Inspiration PDF to dispense important information. This template comprises five stages. It also presents valuable insights into the topics including Banking Financial Services, Supply Chain Automation, Telecommunication . This is a completely customizable PowerPoint theme that can be put to use immediately. So, download it and address the topic impactfully.
Various Organizational Advantages Of Business Insurance Portrait PDF
This slide shows main advantages to organization from business insurance in covering different type of risk. It include benefits such as providing financial backup, provides protection against burglary etc. Presenting Various Organizational Advantages Of Business Insurance Portrait PDF to dispense important information. This template comprises four stages. It also presents valuable insights into the topics including Provides Protection Against Burglary, Provide Financial Backup, Managing Business Liability. This is a completely customizable PowerPoint theme that can be put to use immediately. So, download it and address the topic impactfully.
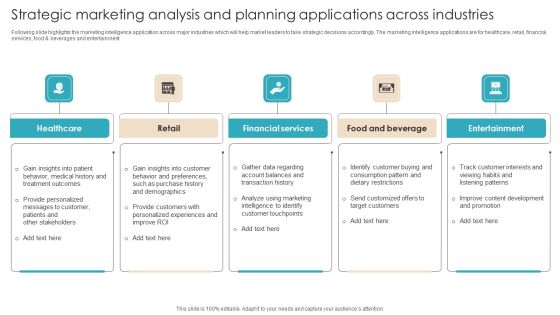
Strategic Marketing Analysis And Planning Applications Across Industries Background PDF
Following slide highlights the marketing intelligence application across major industries which will help market leaders to take strategic decisions accordingly. The marketing intelligence applications are for healthcare, retail, financial services, food and beverages and entertainment. Presenting Strategic Marketing Analysis And Planning Applications Across Industries Background PDF to dispense important information. This template comprises five stages. It also presents valuable insights into the topics including Healthcare, Retail, Financial Services. This is a completely customizable PowerPoint theme that can be put to use immediately. So, download it and address the topic impactfully.

Bar Chart Ppt PowerPoint Presentation Ideas Deck
This is a bar chart ppt powerpoint presentation ideas deck. This is a two stage process. The stages in this process are product, in percentage, in years, financial, business.
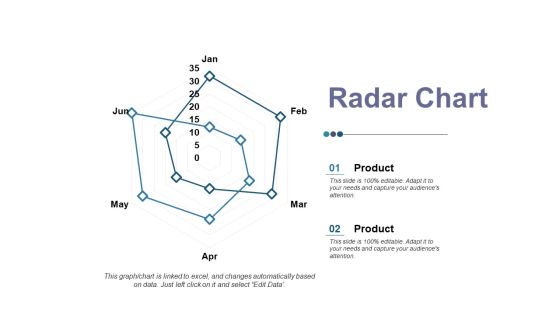
Radar Chart Ppt PowerPoint Presentation Professional Master Slide
This is a radar chart ppt powerpoint presentation professional master slide. This is a two stage process. The stages in this process are product, radar chart, financial, business, shape.

Radar Chart Ppt PowerPoint Presentation Pictures Themes
This is a radar chart ppt powerpoint presentation pictures themes. This is a two stage process. The stages in this process are product, radar chart, finance, business.

Radar Chart Ppt PowerPoint Presentation Styles Themes
This is a radar chart ppt powerpoint presentation styles themes. This is a two stage process. The stages in this process are product, finance, shape, radar chart, business.
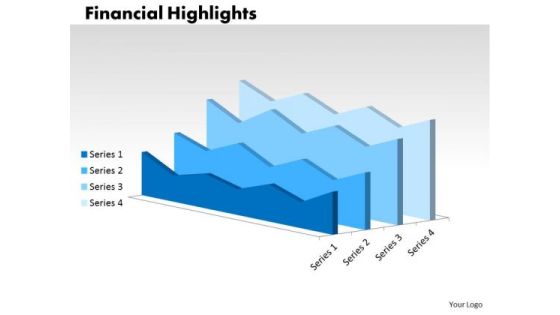
Strategy Diagram Growth Analysis Chart Diagram Consulting Diagram
Double Up Our Strategy Diagram Growth Analysis Chart Diagram Consulting Diagram Powerpoint Templates With Your Thoughts. They Will Make An Awesome Pair. When In Doubt Use Our Strategy Diagram Growth Analysis Chart Diagram Consulting Diagram Powerpoint Templates. The Way Ahead Will Become Crystal Clear.

Revenue Projections Example Chart Powerpoint Ideas
This is a revenue projections example chart powerpoint ideas. This is a eleven stage process. The stages in this process are brand paid search, non branded paid search, direct load, brand organic search, non brand organic, inbound free links, affiliates, display, comparison shopping, display retargeting, email.
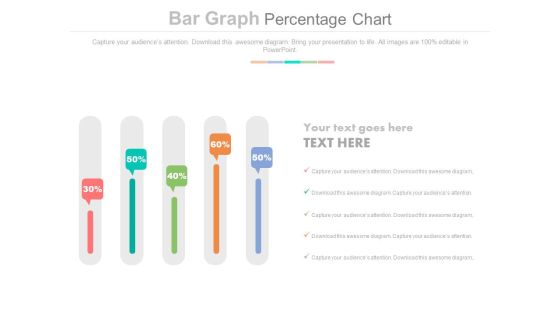
Sliders Percentage Data Chart Powerpoint Slides
This PowerPoint slide has been designed with slider chart and percentage data. This PPT diagram may be used to display business trends. This diagram slide can be used to make impressive presentations.

Bar Chart For Strategic Planning Powerpoint Slides
This PowerPoint template has been designed with bar graph with two teams. This diagram is useful to exhibit strategic planning. This diagram slide can be used to make impressive presentations.

Table Chart For Business Plan Powerpoint Slides
Table chart has been used to design this power point template. This diagram may be used to display business plan. Download this template to leave permanent impression on your audience.
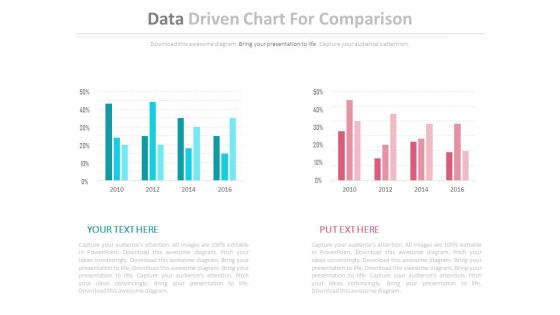
Two Data Driven Comparison Charts Powerpoint Slides
This PowerPoint template contains diagram of two data driven charts. You may use this PPT slide to depict strategic analysis for business. The color coding of this template is specifically designed to highlight you points.
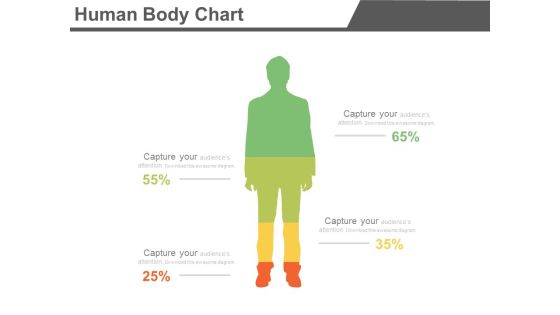
Four Segments Human Body Chart Powerpoint Slides
Create dynamic presentations with our creative template of human body chart with four segments. This diagram may be used to present information in visual manner. Download this template to leave permanent impression on your audience.
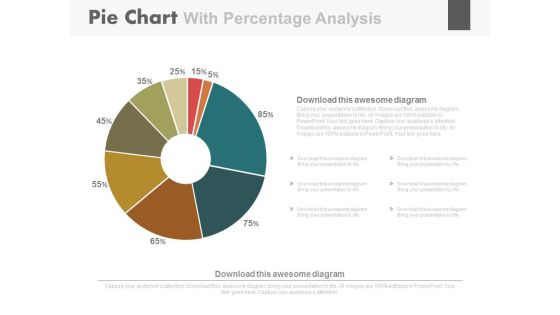
Pie Chart For Strategic Sales Plan Powerpoint Slides
This PowerPoint template has been designed with diagram of pie chart. This PPT slide can be used to prepare presentations on strategic sales plan. You can download finance PowerPoint template to prepare awesome presentations.

Data Driven Comparison Charts For Analysis Powerpoint Slides
You can download this PowerPoint template to display statistical data and analysis. This PPT slide contains data driven comparison charts. Draw an innovative business idea using this professional diagram.
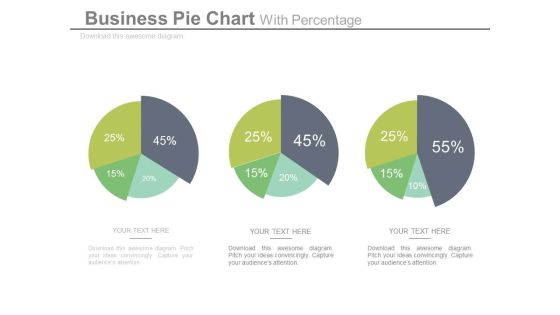
Pie Charts For Relative Comparison Study Powerpoint Slides
This power point template illustrates diagram of three pie charts with percentage values. This business slide can be used for relative comparison study. Present your views and ideas with this impressive slide.
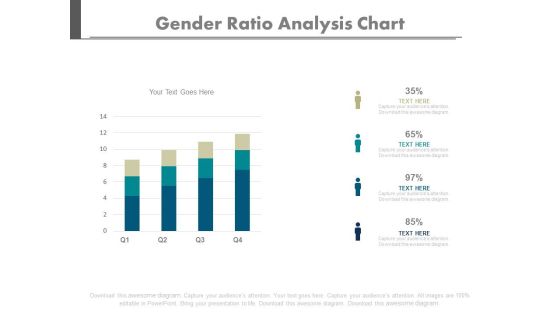
Four Bars Gender Population Ratio Chart Powerpoint Slides
Create dynamic presentations with our creative template of bar graph. This diagram may be used to present gender population. Download this template to leave permanent impression on your audience.
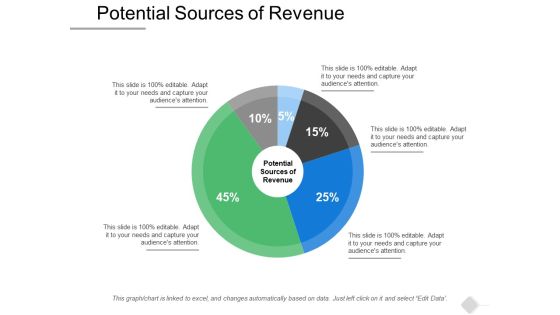
Potential Sources Of Revenue Ppt PowerPoint Presentation Outline Themes
This is a potential sources of revenue ppt powerpoint presentation outline themes. This is a five stage process. The stages in this process are finance, marketing, management, investment, analysis.

Area Chart Ppt PowerPoint Presentation Gallery Information
This is a area chart ppt powerpoint presentation gallery information. This is a two stage process. The stages in this process are product, area chart, business, finance, marketing.

Radar Chart Ppt PowerPoint Presentation Inspiration Rules
This is a radar chart ppt powerpoint presentation inspiration rules. This is a two stage process. The stages in this process are radar chart, business, marketing, finance, management.

Radar Chart Ppt PowerPoint Presentation Background Designs
This is a radar chart ppt powerpoint presentation background designs. This is a two stage process. The stages in this process are radar chart, product, finance, business, shapes.

Radar Chart Ppt PowerPoint Presentation Gallery Templates
This is a radar chart ppt powerpoint presentation gallery templates. This is a two stage process. The stages in this process are radar chart, product, shape, business.

Radar Chart Ppt PowerPoint Presentation Ideas Portrait
This is a radar chart ppt powerpoint presentation ideas portrait. This is a two stage process. The stages in this process are product, radar chart, finance, business, marketing.
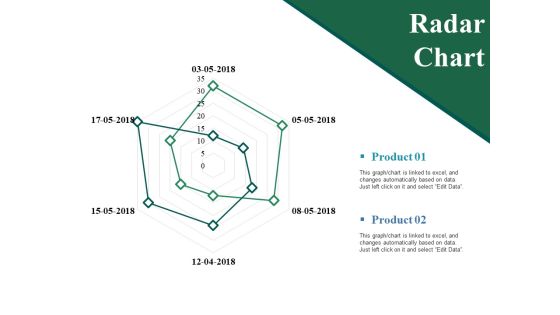
Radar Chart Ppt PowerPoint Presentation Show Guidelines
This is a radar chart ppt powerpoint presentation show guidelines. This is a two stage process. The stages in this process are product, radar chart, business, finance, marketing.

Stock Chart Ppt PowerPoint Presentation Ideas Infographics
This is a stock chart ppt powerpoint presentation ideas infographics. This is a two stage process. The stages in this process are high, volume, low, product, stock chart.
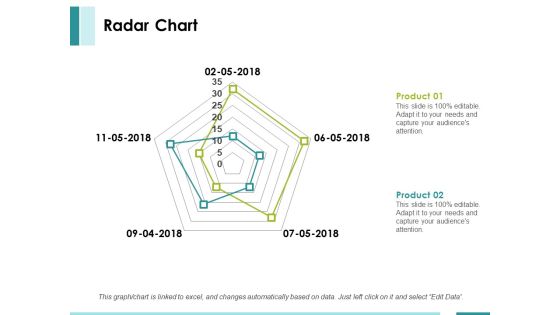
Radar Chart Ppt PowerPoint Presentation Summary Layout
This is a radar chart ppt powerpoint presentation summary layout. This is a two stage process. The stages in this process are product, finance, shape, radar chart, business.

Radar Chart Ppt PowerPoint Presentation File Rules
This is a radar chart ppt powerpoint presentation file rules. This is a two stage process. The stages in this process are product, radar chart, finance.
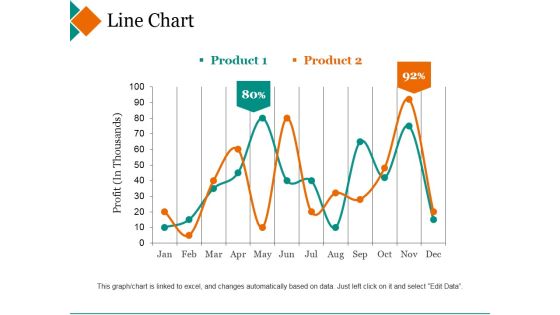
Line Chart Ppt PowerPoint Presentation Inspiration Deck
This is a line chart ppt powerpoint presentation inspiration deck. This is a two stage process. The stages in this process are product, profit, percentage, finance, line graph.
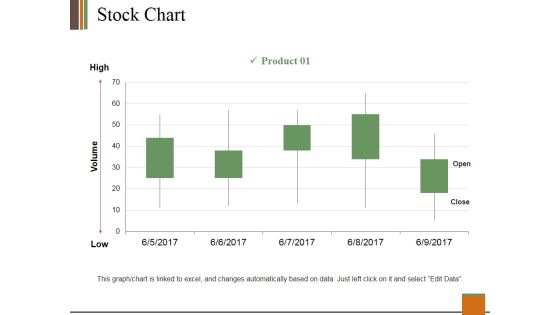
Stock Chart Ppt PowerPoint Presentation Slides Clipart
This is a stock chart ppt powerpoint presentation slides clipart. This is a one stage process. The stages in this process are product, high, volume, low, open, close.

Radar Chart Ppt PowerPoint Presentation Infographics Portfolio
This is a radar chart ppt powerpoint presentation infographics portfolio. This is a two stage process. The stages in this process are product, finance, shapes, business, marketing.

Area Chart Ppt PowerPoint Presentation Professional Grid
This is a area chart ppt powerpoint presentation professional grid. This is a two stage process. The stages in this process are product, sales in percentage, business.

Bar Chart Ppt PowerPoint Presentation Portfolio Inspiration
This is a bar chart ppt powerpoint presentation portfolio inspiration. This is a two stage process. The stages in this process are product, in percentage, in years.

Stock Chart Ppt PowerPoint Presentation Layouts Outfit
This is a stock chart ppt powerpoint presentation layouts outfit. This is a two stage process. The stages in this process are close, high, volume, low, open.

Stock Chart Ppt PowerPoint Presentation Guide
This is a stock chart ppt powerpoint presentation guide. This is a two stage process. The stages in this process are product, close, high, volume, low.

Area Chart Ppt PowerPoint Presentation Summary Model
This is a area chart ppt powerpoint presentation summary model. This is a two stage process. The stages in this process are analysis, finance, marketing, management, investment.
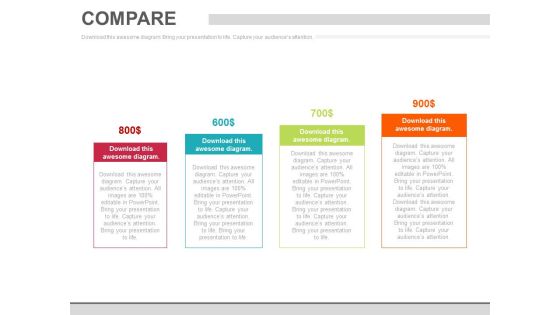
Four Steps Pricing Option Chart Powerpoint Slides
This PowerPoint template has been designed with dollar value pricing table chart. This PPT slide may be used for sample marketing proposal. Download this slide to build unique presentation.

Circle Chart For Value Analysis Powerpoint Slides
This PowerPoint template has been designed for business presentations and corporate slides. The PowerPoint template has a high quality design. You can download this PowerPoint slide for corporate presentations or annual meeting and business plans.
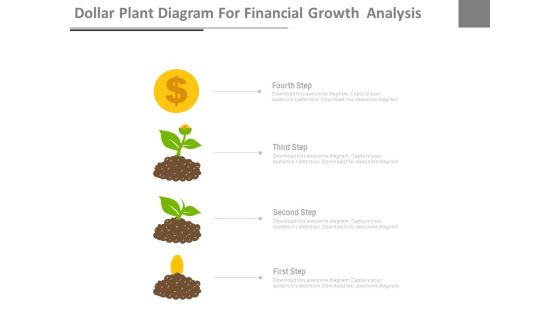
Money Plant Diagram For Dollar Growth Powerpoint Slides
This PowerPoint template has been designed with money plan diagram. This PowerPoint template may be used to display dollar growth and investment. Prove the viability of your ideas using this impressive slide.
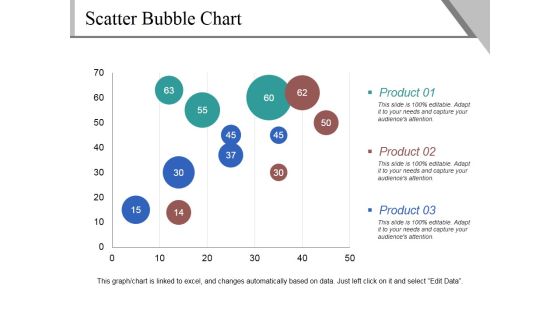
Scatter Bubble Chart Ppt PowerPoint Presentation Pictures Demonstration
This is a scatter bubble chart ppt powerpoint presentation pictures demonstration. This is a three stage process. The stages in this process are product, business, marketing, scatter chart.

Stacked Line Chart Ppt PowerPoint Presentation Pictures Elements
This is a stacked line chart ppt powerpoint presentation pictures elements. This is a two stage process. The stages in this process are product, profit, stacked line chart, year, business.

Radar Chart Ppt PowerPoint Presentation Summary Design Templates
This is a radar chart ppt powerpoint presentation summary design templates. This is a two stage process. The stages in this process are radar chart, product, shapes, business, marketing.

Radar Chart Ppt PowerPoint Presentation Inspiration Infographic Template
This is a radar chart ppt powerpoint presentation inspiration infographic template. This is a two stage process. The stages in this process are radar chart, product, business, finance, marketing.

Radar Chart Ppt PowerPoint Presentation Infographics Visual Aids
This is a radar chart ppt powerpoint presentation infographics visual aids. This is a two stage process. The stages in this process are radar chart, product, finance, business, marketing.
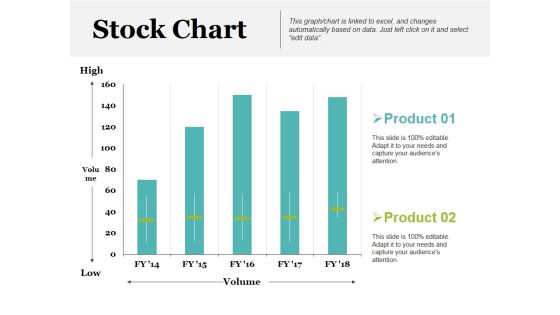
Stock Chart Ppt PowerPoint Presentation Inspiration Example Introduction
This is a stock chart ppt powerpoint presentation inspiration example introduction. This is a two stage process. The stages in this process are product, high, volume, low, stock chart.
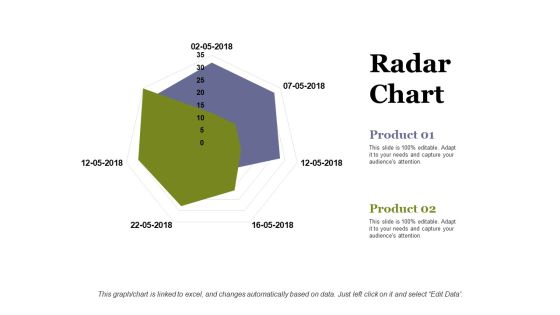
Radar Chart Ppt PowerPoint Presentation Infographic Template Information
This is a radar chart ppt powerpoint presentation infographic template information. This is a two stage process. The stages in this process are radar chart, product, business, marketing, shape.

Radar Chart Ppt PowerPoint Presentation Portfolio Graphics Template
This is a radar chart ppt powerpoint presentation portfolio graphics template. This is a two stage process. The stages in this process are product, finance, shape, radar chart, business.

Radar Chart Ppt PowerPoint Presentation Professional Infographic Template
This is a radar chart ppt powerpoint presentation professional infographic template. This is a two stage process. The stages in this process are product, finance, shape, radar chart, business.
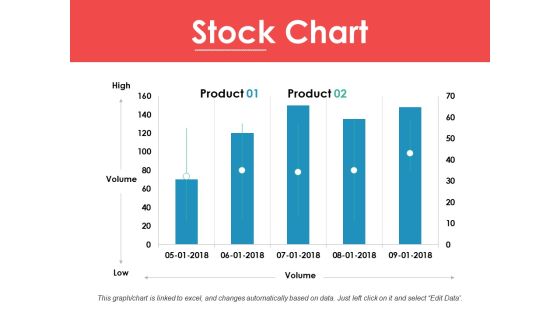
Stock Chart Ppt PowerPoint Presentation Ideas Infographic Template
This is a stock chart ppt powerpoint presentation ideas infographic template. This is a two stage process. The stages in this process are high, volume, low, product, stock chart.

Stock Chart Ppt PowerPoint Presentation Gallery Graphic Images
This is a stock chart ppt powerpoint presentation gallery graphic images. This is a five stage process. The stages in this process are close, high, volume, low, open.

Stock Chart Ppt PowerPoint Presentation Slides Graphics Pictures
This is a stock chart ppt powerpoint presentation slides graphics pictures. This is a two stage process. The stages in this process are product, high, volume, low, open.

Target Chart For Strategic Management Process Powerpoint Slides
This PowerPoint template has been designed with four steps target chart. The PowerPoint template may be used to display strategic management process. You can download this PowerPoint slide for corporate presentations or annual meeting and business plans.
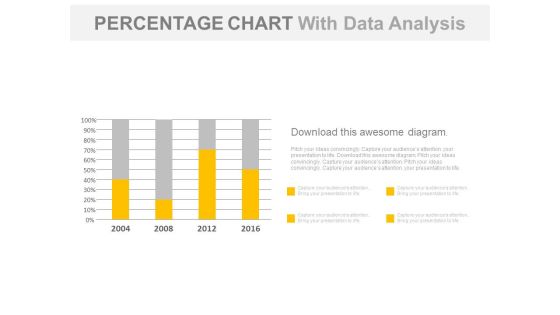
Year Based Chart With Percentage Data Analysis Powerpoint Slides
Our above business slide contains year based statistical chart. This PowerPoint template can be used to display percentage data analysis. Capture the attention of your audience with this slide.

Break Point Chart For Quality Analysis Powerpoint Slide Show
This is a break point chart for quality analysis powerpoint slide show. This is a one stage process. The stages in this process are total variable costs, fixed costs, quality sold.
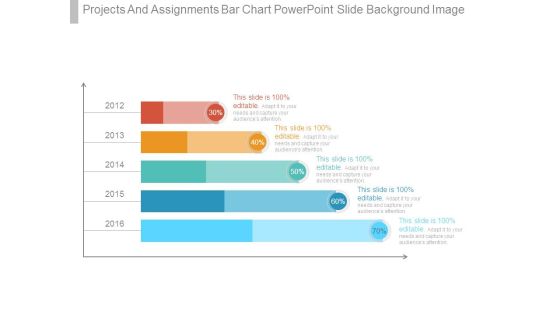
Projects And Assignments Bar Chart Powerpoint Slide Background Image
This is a projects and assignments bar chart powerpoint slide background image. This is a five stage process. The stages in this process are finance, presentation, business, strategy, marketing.

Volume High Low Close Chart Ppt PowerPoint Presentation Gallery Shapes
This is a volume high low close chart ppt powerpoint presentation gallery shapes. This is a five stage process. The stages in this process are high, volume, low, close, finance.
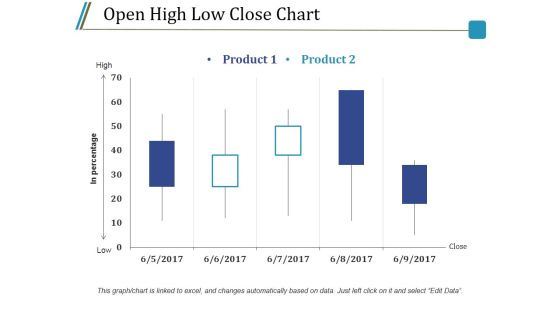
Open High Low Close Chart Ppt PowerPoint Presentation Styles Model
This is a open high low close chart ppt powerpoint presentation styles model. This is a five stage process. The stages in this process are product, high, low, in percentage, close.

Stock Chart Template 2 Ppt PowerPoint Presentation Infographic Template Styles
This is a stock chart template 2 ppt powerpoint presentation infographic template styles. This is a one stage process. The stages in this process are high, volume, low, product, volume.

Open High Low Close Chart Ppt PowerPoint Presentation Outline Rules
This is a open high low close chart ppt powerpoint presentation outline rules. This is a two stage process. The stages in this process are product, high, low, close, in percentage.
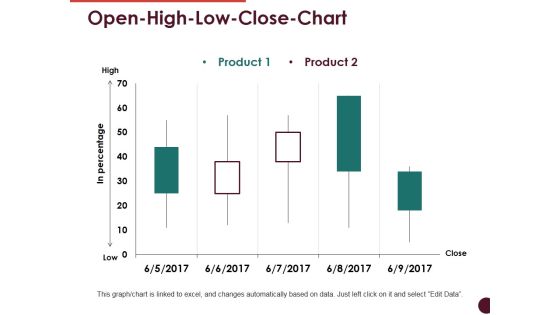
Open High Low Close Chart Ppt PowerPoint Presentation Professional Visuals
This is a open high low close chart ppt powerpoint presentation professional visuals. This is a two stage process. The stages in this process are high, low, in percentage, product, close.

Volume High Low Close Chart Ppt PowerPoint Presentation Infographics Good
This is a volume high low close chart ppt powerpoint presentation infographics good. This is a two stage process. The stages in this process are high, volume, low, product, close.

Control Chart Template 1 Ppt PowerPoint Presentation Ideas Images
This is a control chart template 1 ppt powerpoint presentation ideas images. This is a two stage process. The stages in this process are average range or quality, upper control limit, lower control limit, time, process average.

Control Chart Template 2 Ppt PowerPoint Presentation Portfolio Summary
This is a control chart template 2 ppt powerpoint presentation portfolio summary. This is a one stage process. The stages in this process are upper control limit, process segment, process change, unstable trend, lower control limit.

Open High Low Close Chart Ppt PowerPoint Presentation Professional Inspiration
This is a open high low close chart ppt powerpoint presentation professional inspiration. This is a five stage process. The stages in this process are high, low, close, business, finance.

Donut Pie Chart Ppt PowerPoint Presentation Show Graphics Download
This is a donut pie chart ppt powerpoint presentation show graphics download. This is a three stage process. The stages in this process are percentage, finance, donut, business, marketing.

Stock Chart Finance Analysis Ppt Powerpoint Presentation Ideas Portrait
This is a stock chart finance analysis ppt powerpoint presentation ideas portrait. This is a three stage process. The stages in this process are finance, marketing, management, investment, strategy.

Pie Chart Finance Ppt PowerPoint Presentation Infographics Mockup
This is a pie chart finance ppt powerpoint presentation infographics mockup . This is a four stage process. The stages in this process are finance, marketing, management, investment, analysis.
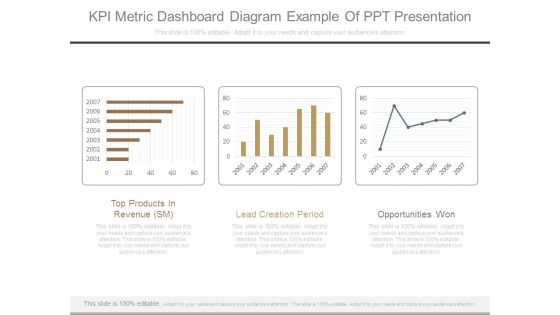
Kpi Metric Dashboard Diagram Example Of Ppt Presentation
This is a kpi metric dashboard diagram example of ppt presentation. This is a three stage process. The stages in this process are top products in revenue sm, lead creation period, opportunities won.

Tap With Water Drops Diagram Powerpoint Slides
This PowerPoint template has been designed with graphics of tap with water drops. Download this business diagram to display save water concept. Present your views and ideas with this impressive design.

High Low Close Chart Template 1 Ppt PowerPoint Presentation Infographics Graphics Design
This is a high low close chart template 1 ppt powerpoint presentation infographics graphics design. This is a five stage process. The stages in this process are close, high, volume, low, open, product.
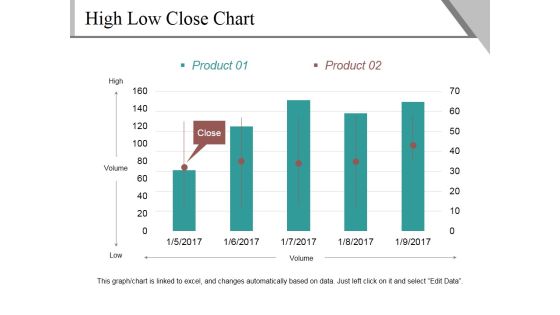
High Low Close Chart Template 2 Ppt PowerPoint Presentation Outline Show
This is a high low close chart template 2 ppt powerpoint presentation outline show. This is a five stage process. The stages in this process are high, volume, low, close, product.

3D Bar Chart For Percentage Values Comparison Ppt PowerPoint Presentation Professional Visual Aids
This is a 3d bar chart for percentage values comparison ppt powerpoint presentation professional visual aids. This is a five stage process. The stages in this process are art, colouring, paint brush.

3D Charts For Comparing Amounts And Volume Ppt PowerPoint Presentation Show Deck
This is a 3d charts for comparing amounts and volume ppt powerpoint presentation show deck. This is a five stage process. The stages in this process are art, colouring, paint brush.

Column Chart Employee Value Proposition Ppt PowerPoint Presentation Slides Graphics Design
This is a column chart employee value proposition ppt powerpoint presentation slides graphics design. This is a two stage process. The stages in this process are business, management, strategy, analysis, marketing.

Data Comparison And Analysis Chart Ppt Powerpoint Presentation File Background Images
This is a data comparison and analysis chart ppt powerpoint presentation file background images. This is a four stage process. The stages in this process are data presentation, content presentation, information presentation.
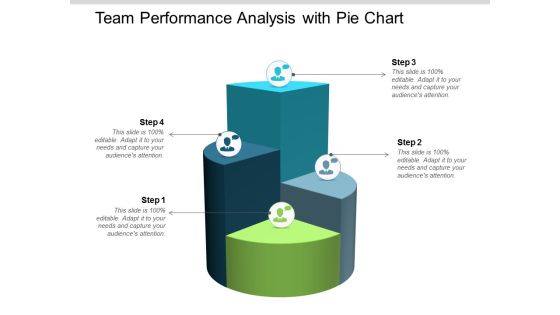
Team Performance Analysis With Pie Chart Ppt Powerpoint Presentation Infographic Template Slideshow
This is a team performance analysis with pie chart ppt powerpoint presentation infographic template slideshow. This is a four stage process. The stages in this process are team performance, member performance, group performance.
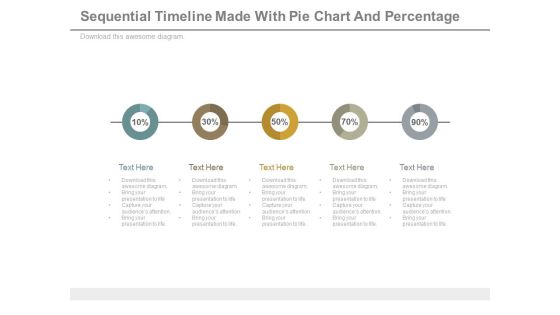
Sequential Timeline Diagram With Percentage Values Powerpoint Slides
This diagram contains graphics of linear circles timeline diagram. Download this diagram slide to display business planning and management. This diagram is editable you can edit text, color, shade and style as per you need.

Infographic Diagram For Business Process Analysis Powerpoint Slides
This PowerPoint slide contains business infographic diagram. This professional slide may be used to display business process analysis. Use this business template to make impressive presentations.

Semicircle Infographic Diagram For Business Process Powerpoint Slides
This PowerPoint template has been designed with semicircle infographic diagram. This PPT slide may be used to display business process flow. Download this slide to build unique presentation.
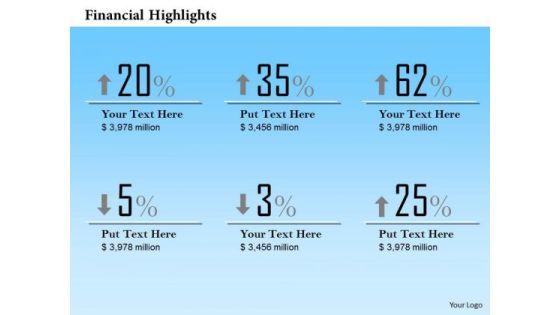
Mba Models And Frameworks Profit Percentage Analysis Diagram Strategic Management
Our MBA Models And Frameworks Profit Percentage Analysis Diagram Strategic Management Powerpoint Templates Abhor Doodling. They Never Let The Interest Flag. Our MBA Models And Frameworks Profit Percentage Analysis Diagram Strategic Management Powerpoint Templates Make Good Beasts Of Burden. Place All Your Demands On Them.
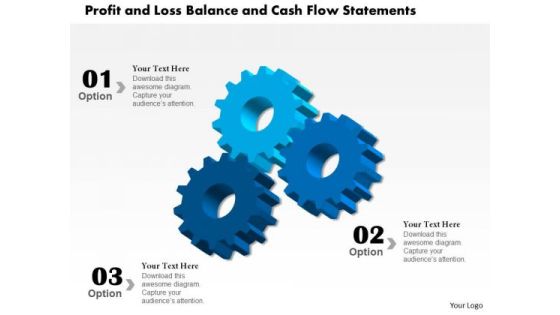
Strategy Diagram Profit And Loss Balance And Cash Flow Statements Mba Models And Frameworks
Be The Doer With Our Strategy Diagram Profit And Loss Balance And Cash Flow Statements MBA Models And Frameworks Powerpoint Templates. Put Your Thoughts Into Practice.
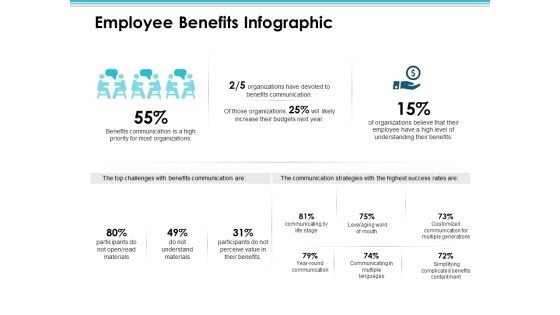
Employee Benefits Infographic Employee Value Proposition Ppt PowerPoint Presentation Styles Diagrams
This is a employee benefits infographic employee value proposition ppt powerpoint presentation styles diagrams. This is a three stage process. The stages in this process are business, management, strategy, analysis, marketing.
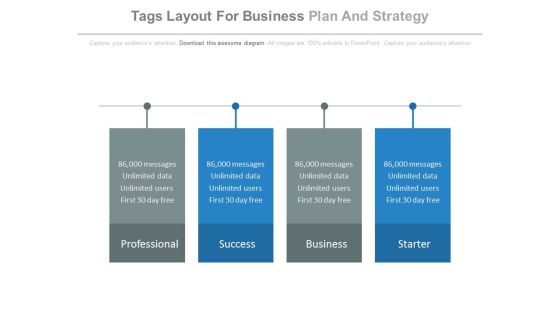
Four Tags Layout For Business Plan And Strategy Powerpoint Slides
This business slide displays diagram of four text tags. Download this PowerPoint diagram to display business plan and strategy. Enlighten your audience with your breathtaking ideas.
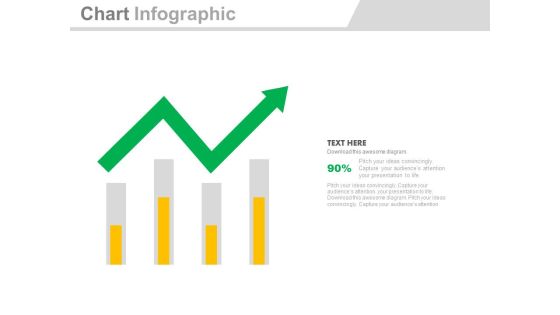
Four Bars With Green Growth Arrow Powerpoint Slides
Four bars with green arrow have been displayed in this business slide. This business diagram helps to exhibit process of business planning. Use this diagram to build an exclusive presentation.

Bar Graph For Profit Growth Analysis Powerpoint Slides
This PowerPoint template has been designed with bar graph with percentage values. This diagram is useful to exhibit profit growth analysis. This diagram slide can be used to make impressive presentations.

Bar Graph For Yearly Statistical Analysis Powerpoint Slides
This PowerPoint template has been designed with bar graph. This PowerPoint diagram is useful to exhibit yearly statistical analysis. This diagram slide can be used to make impressive presentations.

Bar Graph For Data Distribution And Analysis Powerpoint Slides
This PowerPoint template has been designed with bar graph. This PowerPoint diagram is useful for data distribution and analysis This diagram slide can be used to make impressive presentations.
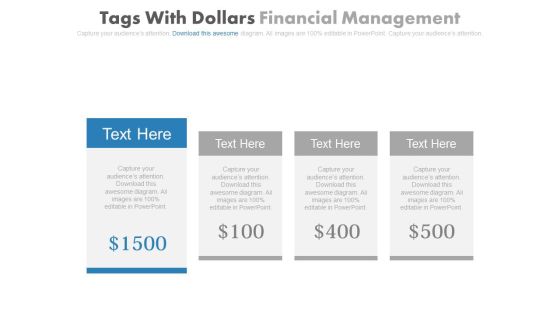
Four Dollar Tags For Corporate Entrepreneurship Powerpoint Slides
This PowerPoint template has been designed with diagram of four text tags with dollar price. This PPT slide can be used to prepare presentations for personal finances and tax planning. You can download finance PowerPoint template to prepare awesome presentations.
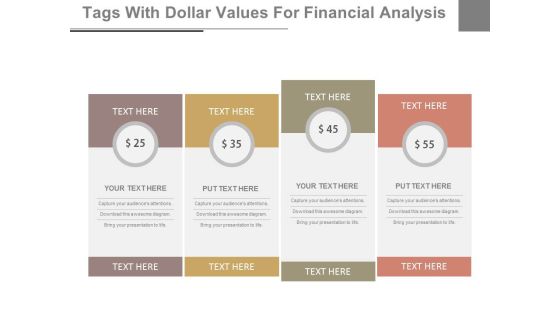
Dollar Value Pricing Table Powerpoint Slides
This PowerPoint template has been designed with dollar value pricing table chart. This PPT slide may be used for sample marketing proposal. Download this slide to build unique presentation.

Table For Total Sales Analysis Powerpoint Slides
This PowerPoint template has been designed with four steps table chart. Use this PPT slide to display total sales analysis. Download this template to leave permanent impression on your audience.
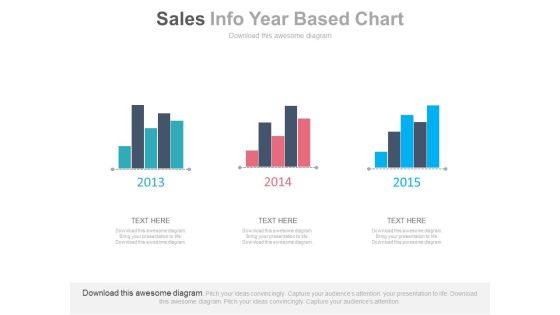
Three Years Sales Data Bar Graph Powerpoint Slides
This PowerPoint template has been designed with bar charts. This business slide may be used to display three years sales data for comparison. Present your views and ideas with this impressive design.

Four Steps For Organizational Learning Methods Powerpoint Slides
Four text boxes have been displayed in this business slide. This PowerPoint template helps to exhibit organizational learning methods. Use this diagram slide to build an exclusive presentation.
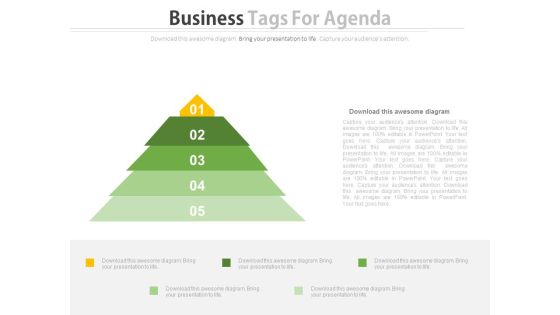
Triangle Of Five Business Steps Powerpoint Slides
This PowerPoint template has been designed with five steps triangle diagram. This PPT slide can be used to display five points of marketing agenda. You can download finance PowerPoint template to prepare awesome presentations.

Bar Graph For Year Based Analysis Powerpoint Slides
This PowerPoint template has been designed with year based bar graph. This diagram may be used to display yearly statistical analysis. Use this PPT slide design to make impressive presentations.

Bar Graph With Increasing Percentage Flow Powerpoint Slides
This PowerPoint slide has been designed with bar graph and increasing percentage values. This diagram slide may be used to display profit growth. Prove the viability of your ideas with this professional slide.

Unconstrained Investment Selection Process Chart Diagram
This is a unconstrained investment selection process chart diagram. This is a six stage process. The stages in this process are portfolio decision making, fundamental financial principles, client centric, economic guidance, optimal investment selection, strategic and tactical, allocation, market trends and cycles.
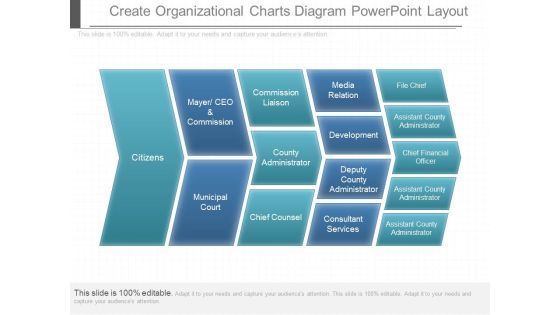
Create Organizational Charts Diagram Powerpoint Layout
This is a create organizational charts diagram powerpoint layout. This is a one stage process. The stages in this process are citizens, mayer ceo and commission, municipal court, commission liaison, county administrator, chief counsel, media relation, development, deputy county administrator, consultant services, file chief, assistant county administrator, chief financial officer.

Business Chart Finance PowerPoint Templates And PowerPoint Themes 1012
Visually support your Microsoft office PPT Presentation with our above template illustrating a colored bar graph. This image has been professionally designed to emphasize the concept of statistics. This image has been conceived to enable you to emphatically communicate your ideas in your Business and Financial PPT presentations showing reports, ratings and reviews etc. Deliver amazing presentations to mesmerize your audience.

Business Framework Business Growth Forecast Timeline PowerPoint Presentation
Explain GDP and strategic thinking for business growth with this unique power point diagram slide. This image slide contains the graphic of growth forecast timeline diagram which is usable for forecasting the business growth. Us ethis diagram slide for business and financial growth related topics.

Commodity Up Selling Customer Segmentation Cont Ppt Professional Graphic Tips PDF
Presenting this set of slides with name commodity up selling customer segmentation cont ppt professional graphic tips pdf. This is a four stage process. The stages in this process are digital stars, traditionalists, financial stars, pros. This is a completely editable PowerPoint presentation and is available for immediate download. Download now and impress your audience.
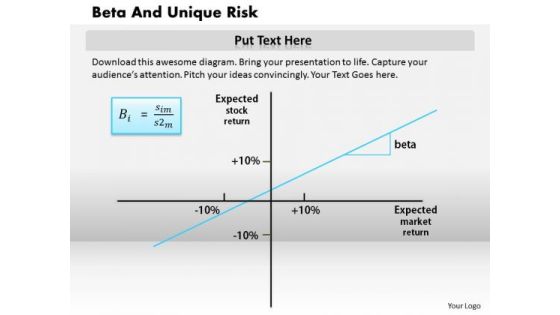
Business Framework Beta And Unique Risk PowerPoint Presentation 2
Define the concept of calculating risk of market with this power point diagram slide. This slide contains the graphic of X-Y chart with four different sections. Define the price and finance risk with beta factor, define this factor in your financial presentation and display the clear picture of risk.

Business Diagram With Dollars Money PowerPoint Templates And PowerPoint Themes 1012
Visually support your Microsoft office PPT Presentation with our above template illustrating a business diagram on stack of dollars. This image represents the concept of financial analysis. This image has been conceived to enable you to emphatically communicate your ideas in your Business PPT presentations on finance, market, investment and success. Create captivating presentations to deliver comparative and weighted arguments.

Vat Marketing Cubes PowerPoint Templates And PowerPoint Themes 1012
The above template displays a diagram of 3d vat cube blocks. This image represents the concept of income tax. It is a useful captivating tool concieved to enable you to define your message in your Business and Financial PPT presentations on comsumption tax. Deliver amazing presentations to mesmerize your audience.
Business Diagram Marketing PowerPoint Templates And PowerPoint Themes 1012
Develop competitive advantage with our above template which contains a business diagram. This image represents the concept of marketing. It is a useful captivating tool concieved to enable you to define your message in your Business PPT presentations showing financial analysis and statistics. Deliver amazing presentations to mesmerize your audience.

Money Bills Race Business PowerPoint Templates And PowerPoint Themes 1012
The above template displays a diagram of a money bills. This image represent the concept of financial bill. It is a useful captivating tool concieved to enable you to define your message in your Business PPT presentations. Our PPT images are so ideally designed that it reveals the very basis of our PPT template to make your clients understand.
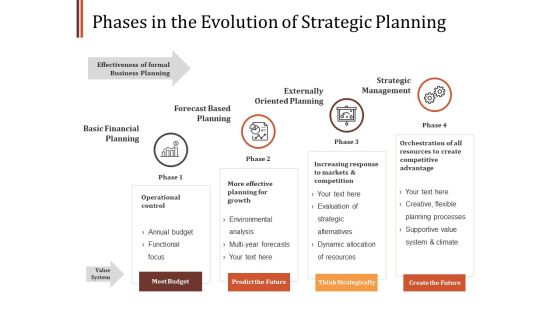
Phases In The Evolution Of Strategic Planning Ppt PowerPoint Presentation Show Graphics Design
This is a phases in the evolution of strategic planning ppt powerpoint presentation show graphics design. This is a four stage process. The stages in this process are basic financial planning, forecast based planning, externally oriented planning, strategic management, strategic planning.

Four Planning Phases Of Strategic Management Ppt PowerPoint Presentation Inspiration Infographic Template
Presenting this set of slides with name four planning phases of strategic management ppt powerpoint presentation inspiration infographic template. This is a four stage process. The stages in this process are business value, financial growth, strategic management. This is a completely editable PowerPoint presentation and is available for immediate download. Download now and impress your audience.

Losers Gainers Chart Arrows Marketing PowerPoint Templates And PowerPoint Themes 1012
Deliver amazing Presentations with our above template which contains an image of Losers and Gainers chart arrows. This image depicts the concept of stock market. This image has been conceived to enable you to emphatically communicate your ideas in your Business and Financial PPT presentation. Deliver amazing presentations to mesmerize your audience.
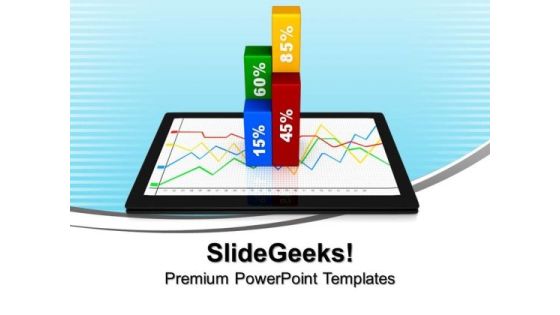
Business Percentage Chart On Tablet PowerPoint Templates And PowerPoint Themes 1012
Deliver amazing Presentations with our above template which contains an image of business chart on tablet. This image represents the concept of marketing and financial accounting. Adjust the above image in your PPT presentations to visually support your content in your Business PPT slideshows economy and statistics PPT presentations. Go ahead add charm and personality to your presentations with our stunning templates.

Synergy Realization Post Acquisition Integration Ppt PowerPoint Presentation Model Diagrams
Presenting this set of slides with name synergy realization post acquisition integration ppt powerpoint presentation model diagrams. This is a three stage process. The stages in this process are synergy, revenue synergy, cost synergy, financial synergy. This is a completely editable PowerPoint presentation and is available for immediate download. Download now and impress your audience.

Banking Investment Management Chart Powerpoint Slides
This is a banking investment management chart powerpoint slides. This is a nine stage process. The stages in this process are tax planning, estate and trust planning, us banking and credit capabilities, us business owner planning, banking and cash management, financial literacy, credit strategies, philanthropy, investment management, private client, private client, team.
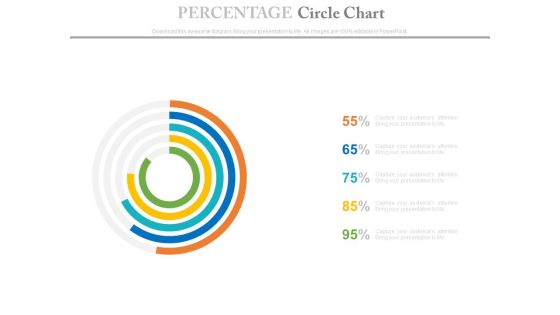
Percentage Data Circle Chart Powerpoint Slides
This PowerPoint template has been designed with circle chart. Download this PPT chart to depict financial ratio analysis. This PowerPoint slide is of great help in the business sector to make realistic presentations and provides effective way of presenting your newer thoughts.
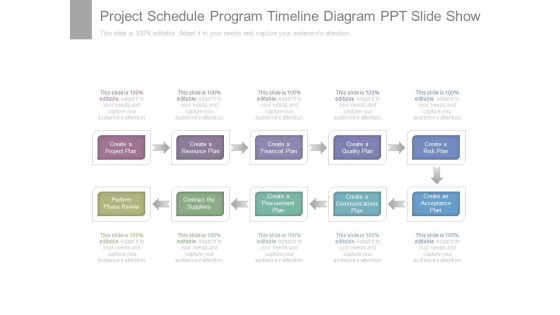
Project Schedule Program Timeline Diagram Ppt Slide Show
This is a project schedule program timeline diagram ppt slide show. This is a ten stage process. The stages in this process are create a project plan, create a resource plan, create a financial plan, create a quality plan, create a risk plan, perform phase review, contract the suppliers, create a procurement plan, create a communications plan, create an acceptance plan.
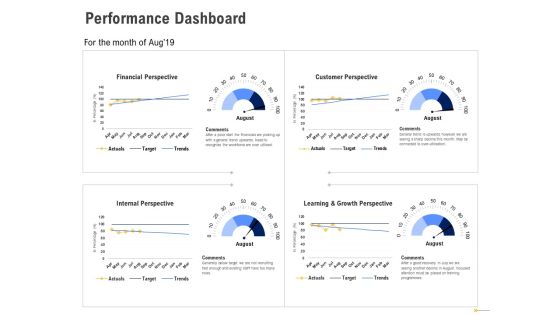
Using Balanced Scorecard Strategy Maps Drive Performance Dashboard Ppt Styles Themes PDF
Presenting this set of slides with name using balanced scorecard strategy maps drive performance dashboard ppt styles themes pdf. The topics discussed in these slides are financial perspective, customer perspective, internal perspective, learning and growth perspective. This is a completely editable PowerPoint presentation and is available for immediate download. Download now and impress your audience.
