AI PPT Maker
Templates
PPT Bundles
Design Services
Business PPTs
Business Plan
Management
Strategy
Introduction PPT
Roadmap
Self Introduction
Timelines
Process
Marketing
Agenda
Technology
Medical
Startup Business Plan
Cyber Security
Dashboards
SWOT
Proposals
Education
Pitch Deck
Digital Marketing
KPIs
Project Management
Product Management
Artificial Intelligence
Target Market
Communication
Supply Chain
Google Slides
Research Services
 One Pagers
All Categories
-
Home
- Customer Favorites
- Financial Icons
Financial Icons
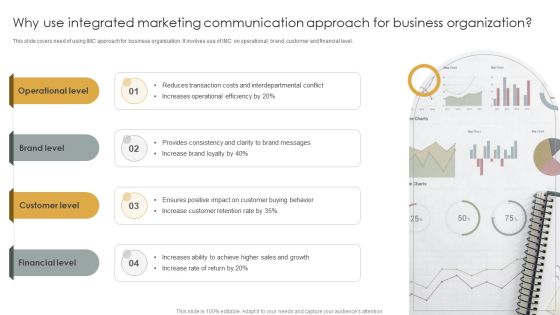
Why Use Integrated Marketing Communication Approach For Business Organization Elements PDF
This slide covers need of using IMC approach for business organization. It involves use of IMC on operational, brand, customer and financial level. Presenting Why Use Integrated Marketing Communication Approach For Business Organization Elements PDF to dispense important information. This template comprises four stages. It also presents valuable insights into the topics including Operational Level, Brand Level, Customer Level, Financial Level. This is a completely customizable PowerPoint theme that can be put to use immediately. So, download it and address the topic impactfully.

Column Chart Ppt PowerPoint Presentation Layouts Design Inspiration
This is a column chart ppt powerpoint presentation layouts design inspiration. This is a two stage process. The stages in this process are sales in percentage, financial year in, graph, business, finance, marketing.

Banking Solutions Company Overview Organization Structure Diagrams PDF
The slide highlights the company organization structure of financial bank. It showcases board of directors, audit committee of board, managing director, chief executive officer, assets laundering prevention committee, risk management committee, chief financial officer, HR director, etc. This is a Banking Solutions Company Overview Organization Structure Diagrams PDF template with various stages. Focus and dispense information on three stages using this creative set, that comes with editable features. It contains large content boxes to add your information on topics like Chief Financial Officer, Chief Executive Officer, Risk. You can also showcase facts, figures, and other relevant content using this PPT layout. Grab it now.

Quarterly Revenue And Loss Statement Comparison Dashboard Portrait PDF
This slide showcases a comprehensive P and L report for representing the financial outcomes. It also helps to take financial performance management decisions. It includes financial analysis KPIs such as p and l statements, p and l structure dynamics, sales or margin quality performance analysis, DUPONT ratio, etc. Showcasing this set of slides titled Quarterly Revenue And Loss Statement Comparison Dashboard Portrait PDF. The topics addressed in these templates are Profitability, Debt Coverage Ratios, Margin Quality Performa. All the content presented in this PPT design is completely editable. Download it and make adjustments in color, background, font etc. as per your unique business setting.

Business Planning And Strategy Playbook Company Overview Contd Ppt PowerPoint Presentation Infographic Template Rules PDF
The purpose of this slide is to provide glimpse about the key promoters and the financial highlights of the firm as an financial overview of firms performance. Deliver and pitch your topic in the best possible manner with this business planning and strategy playbook company overview contd ppt powerpoint presentation infographic template rules pdf. Use them to share invaluable insights on revenue, ebitda, net income, financial highlights and impress your audience. This template can be altered and modified as per your expectations. So, grab it now.
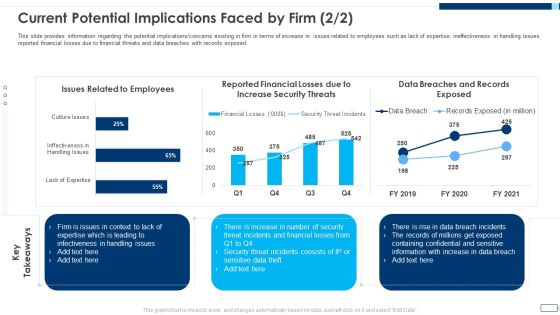
Evolving BI Infrastructure Current Potential Implications Faced By Firm Threats Portrait PDF
This slide provides information regarding the potential implications or concerns existing in firm in terms of increase in issues related to employees such as lack of expertise, ineffectiveness in handling issues, reported financial losses due to financial threats and data breaches with records exposed. Deliver an awe inspiring pitch with this creative evolving bi infrastructure current potential implications faced by firm threats portrait pdf bundle. Topics like issues related to employees, reported financial losses due to increase security threats, data breaches and records exposed can be discussed with this completely editable template. It is available for immediate download depending on the needs and requirements of the user.
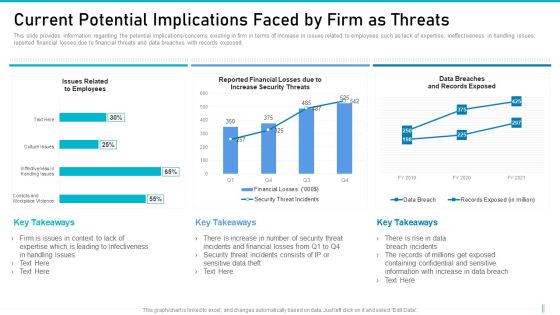
Risk Management For Organization Essential Assets Current Potential Implications Faced Graphics PDF
This slide provides information regarding the potential implications or concerns existing in firm in terms of increase in issues related to employees such as lack of expertise, ineffectiveness in handling issues, reported financial losses due to financial threats and data breaches with records exposed. Deliver an awe inspiring pitch with this creative risk management for organization essential assets current potential implications faced graphics pdf bundle. Topics like issues related to employees, reported financial losses due to increase security threats, data breaches and records exposed can be discussed with this completely editable template. It is available for immediate download depending on the needs and requirements of the user.

Cyber Safety Incident Management Current Potential Implications Faced By Firm As Threats Clipart PDF
This slide provides information regarding the potential implications or concerns existing in firm in terms of increase in issues related to employees such as lack of expertise, ineffectiveness in handling issues, reported financial losses due to financial threats and data breaches with records exposed. Deliver an awe inspiring pitch with this creative cyber safety incident management current potential implications faced by firm as threats clipart pdf bundle. Topics like issues related to employees, data breaches and records exposed, reported financial losses due to increase security threats can be discussed with this completely editable template. It is available for immediate download depending on the needs and requirements of the user.
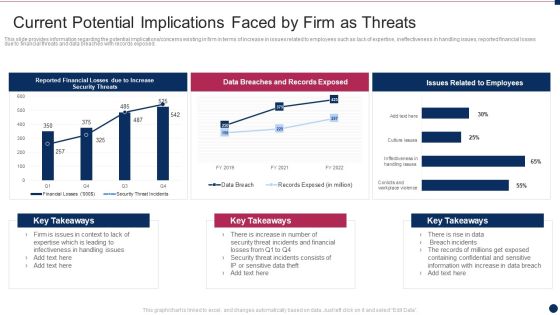
Threat Management At Workplace Current Potential Implications Faced By Firm As Threats Professional Pdf
This slide provides information regarding the potential implications concerns existing in firm in terms of increase in issues related to employees such as lack of expertise, ineffectiveness in handling issues, reported financial losses due to financial threats and data breaches with records exposed. Deliver and pitch your topic in the best possible manner with this threat management at workplace current potential implications faced by firm as threats professional pdf. Use them to share invaluable insights on data breaches and records exposed, breach incidents, financial losses and impress your audience. This template can be altered and modified as per your expectations. So, grab it now.
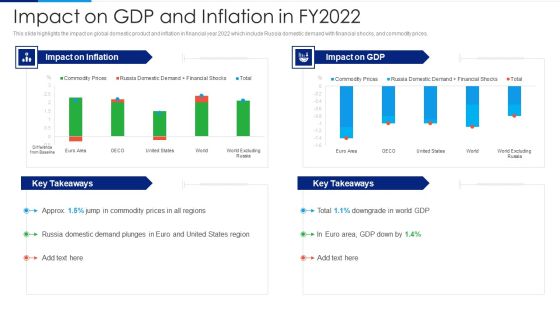
Russia Ukraine Conflict Effect Impact On GDP And Inflation In Fy2022 Introduction PDF
This slide highlights the impact on global domestic product and inflation in financial year 2022 which include Russia domestic demand with financial shocks, and commodity prices. Deliver an awe inspiring pitch with this creative Russia Ukraine Conflict Effect Impact On GDP And Inflation In Fy2022 Introduction PDF bundle. Topics like Impact On Inflation, Impact On GDP, Commodity Prices, Russia Domestic Demand, Financial Shocks can be discussed with this completely editable template. It is available for immediate download depending on the needs and requirements of the user.

Current Potential Implications Faced By Firm Intelligent Infrastructure Rules PDF
This slide provides information regarding the potential implications or concerns existing in firm in terms of increase in issues related to employees such as lack of expertise, ineffectiveness in handling issues, reported financial losses due to financial threats and data breaches with records exposed. Deliver an awe inspiring pitch with this creative Current Potential Implications Faced By Firm Intelligent Infrastructure Rules PDF bundle. Topics like Issues Related To Employees, Reported Financial Losses, Due To Increase Security Threats, Data Breaches And can be discussed with this completely editable template. It is available for immediate download depending on the needs and requirements of the user.

Facilitating IT Intelligence Architecture Current Potential Implications Faced By Firm Slides PDF
This slide provides information regarding the potential implications or poncerns existing in firm in terms of increase in issues related to employees such as lack of expertise, ineffectiveness in handling issues, reported financial losses due to financial threats and data breaches with records exposed. Deliver an awe inspiring pitch with this creative Facilitating IT Intelligence Architecture Current Potential Implications Faced By Firm Slides PDF bundle. Topics like Infectiveness In Handling, Expertise Which Is Leading, Incidents And Financial can be discussed with this completely editable template. It is available for immediate download depending on the needs and requirements of the user.
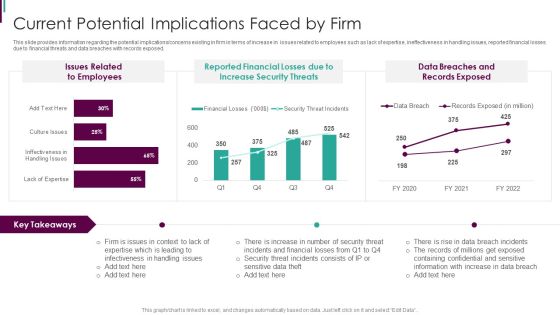
Developing Business Analytics Framework Current Potential Implications Faced By Firm Graphics PDF
This slide provides information regarding the potential implications concerns existing in firm in terms of increase in issues related to employees such as lack of expertise, ineffectiveness in handling issues, reported financial losses due to financial threats and data breaches with records exposed. Deliver and pitch your topic in the best possible manner with this Developing Business Analytics Framework Current Potential Implications Faced By Firm Graphics PDF Use them to share invaluable insights on Reported Financial, Increase Security, Data Breaches and impress your audience. This template can be altered and modified as per your expectations. So, grab it now.

Forensic Fraud Accounting Unit Structure Ideas PDF
This slide covers organisation chart for a financial fraud investigation unit. It includes key stakeholders such as head of financial investigation unit, regional leaders, FIU team leaders, admin team leader and team of investigators. Persuade your audience using this Forensic Fraud Accounting Unit Structure Ideas PDF. This PPT design covers three stages, thus making it a great tool to use. It also caters to a variety of topics including Team Leader, Head Of Financial, Investigation Unit. Download this PPT design now to present a convincing pitch that not only emphasizes the topic but also showcases your presentation skills.

Various Solutions For Effective Project Budget Planning Pictures PDF
This slide covers project and financial management solution which helps in managing income and expenses. It also includes strategic alignment, process automation, financial management and value realization. Presenting various solutions for effective project budget planning pictures pdf to dispense important information. This template comprises four stages. It also presents valuable insights into the topics including strategic alignment, process automation, financial management, value realization. This is a completely customizable PowerPoint theme that can be put to use immediately. So, download it and address the topic impactfully.

Four Step Project Management Process For Budget Planning Sample PDF
This slide covers four steps for financial planning of a project which will helps project leaders in effective implementation of project. It also include develop financial goals, identify alternative actions, implementation of action plan and review and revise plan. Presenting four step project management process for budget planning sample pdf to dispense important information. This template comprises four stages. It also presents valuable insights into the topics including develop financial goals, identify alternative actions, implementation of action plan, review and revise plan. This is a completely customizable PowerPoint theme that can be put to use immediately. So, download it and address the topic impactfully.
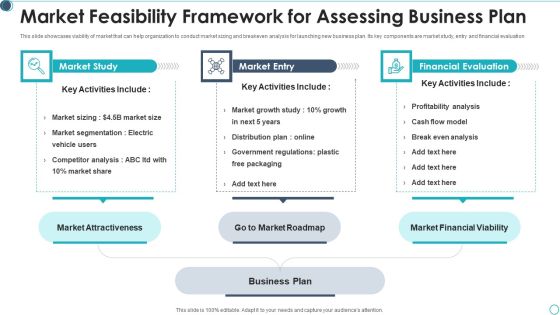
Market Feasibility Framework For Assessing Business Plan Brochure PDF
This slide showcases viability of market that can help organization to conduct market sizing and breakeven analysis for launching new business plan. Its key components are market study, entry and financial evaluation Presenting market feasibility framework for assessing business plan brochure pdf to dispense important information. This template comprises three stages. It also presents valuable insights into the topics including key activities include, financial evaluation, market financial viability This is a completely customizable PowerPoint theme that can be put to use immediately. So, download it and address the topic impactfully.

Framework To Manage Business ORMF Ppt PowerPoint Presentation File Gallery PDF
This slide covers framework for effective management of various business operational risks. It includes risks such as strategic risks, financial, operational risks, regulatory and financial reporting risks.Presenting Framework To Manage Business ORMF Ppt PowerPoint Presentation File Gallery PDF to dispense important information. This template comprises three stages. It also presents valuable insights into the topics including Management Policies, Risk Indicators, Financial Risks. This is a completely customizable PowerPoint theme that can be put to use immediately. So, download it and address the topic impactfully.

Company Growth Strategy Ppt PowerPoint Presentation Professional Slides
This is a consumer lifecycle icon slide business ppt powerpoint presentation model. This is a three stage process. The stages in this process are finance, marketing, analysis, investment, million.

Customer Acquisition Cost Across Various Channels Ppt PowerPoint Presentation Ideas Infographics
This is a customer acquisition tools marketing ppt powerpoint presentation icon microsoft. This is a thee stage process. The stages in this process are finance, marketing, analysis, investment, million.

Stock Photo 3d Box Full With Dollars And Text Box PowerPoint Slide
Graphic of 3d box with dollars has been used to design this image slide. This slide contains money gift box depicting financial growth. Use this slide for your business and finance related presentations.

Business Framework Phases Of The Credit Cycle PowerPoint Presentation
Four arrows with interconnection in circular design has been used to design this power Point template slide. This diagram slide contains the concept of credit phases. This PPT slide can be used for financial presentations.

PowerPoint Theme Ring Chart Diagram Growth Ppt Template
PowerPoint Theme Ring Chart Diagram Growth PPT Template-Use this graphical approach to represent global business issues such as financial data, stock market Exchange, increase in sales, corporate presentations and more.-PowerPoint Theme Ring Chart Diagram Growth PPT Template

Line Chart Ppt PowerPoint Presentation Styles Themes
This is a line chart ppt powerpoint presentation styles themes. This is a two stage process. The stages in this process are business, marketing, financial years, sales in percentage.

Pie Chart Infographic Diagram Powerpoint Templates
This Power Point template has been designed with pie chart infographic. This business slide is useful to present financial ratio analysis. Use this diagram to make business presentation. Illustrate these thoughts with this slide.
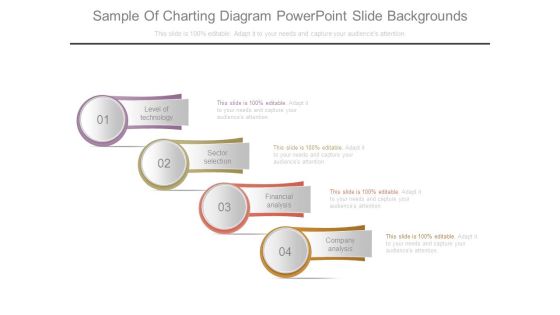
Sample Of Charting Diagram Powerpoint Slide Backgrounds
This is a sample of charting diagram powerpoint slide backgrounds. This is a four stage process. The stages in this process are level of technology, sector selection, financial analysis, company analysis.

Economic Review Business Plans Ppt Presentation
This is a economic review business plans ppt presentation. This is a two stage process. The stages in this process are economic review, business plans, financial forecast, annual budget, energy review, corporate plan, investment reappraisals.
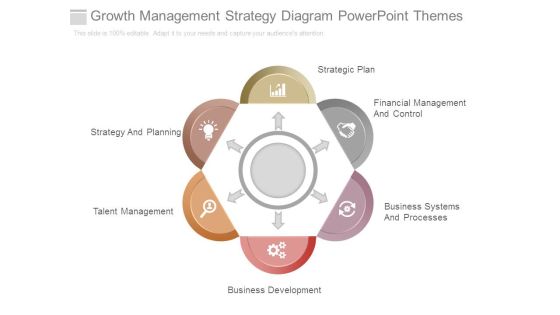
Growth Management Strategy Diagram Powerpoint Themes
This is a growth management strategy diagram powerpoint themes. This is a six stage process. The stages in this process are strategic plan, financial management and control, strategy and planning, talent management, business development, business systems and processes.
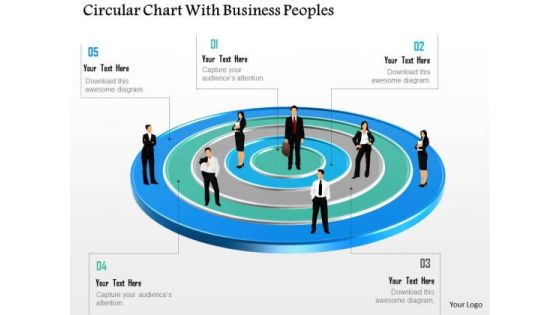
Business Diagram Circular Chart With Business Peoples Presentation Template
This business diagram has been designed with graphic of business people on circular chart. This diagram is designed to depict team meeting on financial matter. This diagram offers a way for your audience to visually conceptualize the process.

Client Testimonials Template 1 Ppt PowerPoint Presentation Diagrams
This is a client testimonials template 1 ppt powerpoint presentation diagrams. This is a two stage process. The stages in this process are john doe, julie star, financial advisor.

Cycle Chart Of Mutual Funds Sample Diagram Ppt Images
This is a cycle chart of mutual funds sample diagram ppt images. This is a five stage process. The stages in this process are reinvestment, returns, investors, fund manager, financial securities.
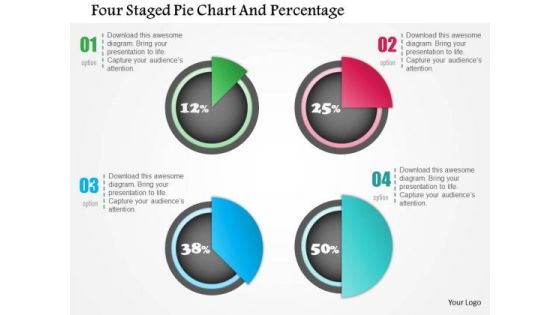
Business Diagram Four Staged Pie Chart And Percentage Presentation Template
Four staged pie chart and percentage values has been used to design this power point template. This PPT contains the concept of financial result analysis. Use this PPT for business and marketing related presentations.
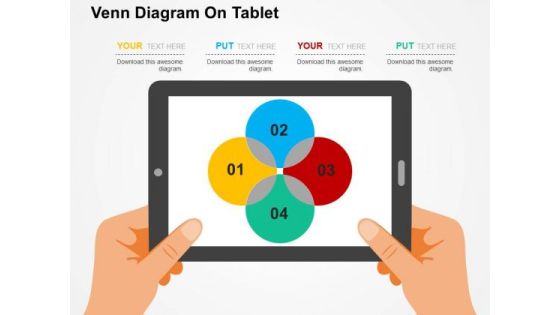
Venn Diagram On Tablet PowerPoint Template
Adjust the above image into your Presentations to visually support your content. This slide has been professionally designed with Venn diagram. This template offers an excellent background to display financial analysis.
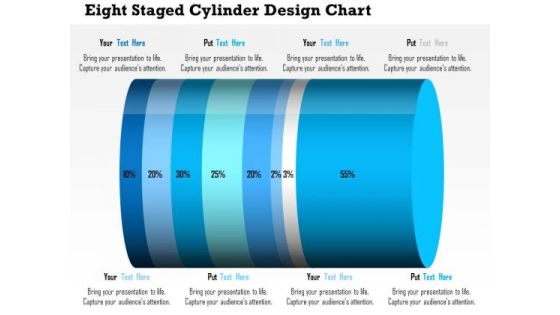
Business Daigram Eight Staged Cylinder Design Chart Presentation Templets
This business diagram contains eight staged cylinder design chart with percentage ratio. Download this diagram to display financial analysis. Use this diagram to make business and marketing related presentations.

Cost Comparison Table Chart Powerpoint Slides
Our above PPT slide displays cost comparison table chart. This diagram may be used to display cost comparison and financial analysis. Download this PowerPoint template to leave permanent impression on your audience.

Corporate Structuring Diagram Presentation Backgrounds
This is a corporate structuring diagram presentation backgrounds. This is a three stage process. The stages in this process are shareholders, board of directors, chief executive officer, chairman, chief operating officer, chief financial officer.

Business Framework Capital Structure And Coc PowerPoint Presentation
This PPT slide contains the concept of capital structure and cost of capital. To display both these concept we have used graphic of chart for analyzing capital structure versus COC. Use this PPT slide in your financial presentations.
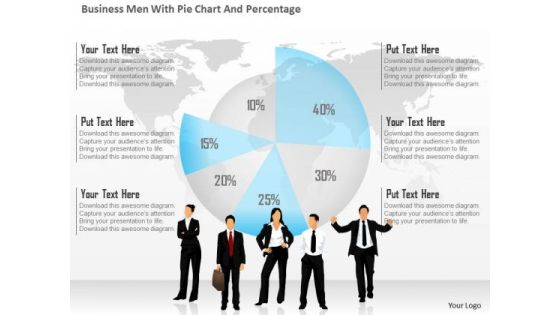
Business Diagram Business Men With Pie Chart And Percentage Presentation Template
This business diagram has been designed with graphic of business people and pie chart with percentage. This diagram is designed to depict team meeting on financial matter. This diagram offers a way for your audience to visually conceptualize the process.
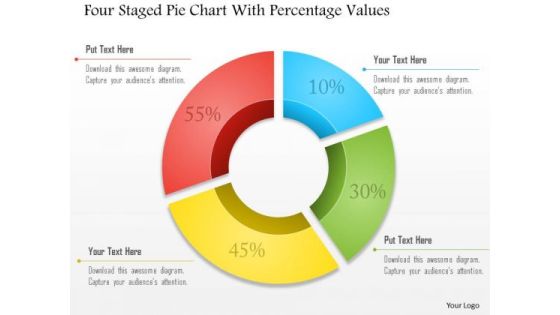
Business Diagram Four Staged Pie Chart With Percentage Values Presentation Template
Four staged pie chart and percentage values are used to design this business slide. Download this diagram to make business and financial reports. Use our above diagram to express information in a visual way.
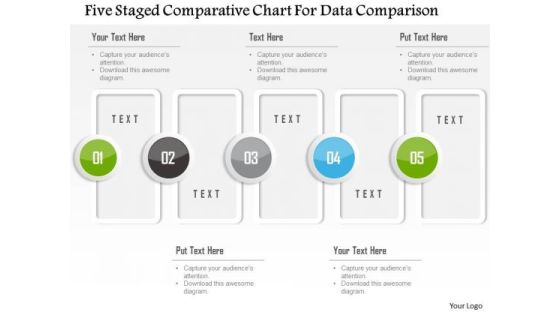
Business Diagram Five Staged Comparative Chart For Data Comparison Presentation Template
Five staged comparative chart has been used to design this power point template. This PPT contains the concept of data comparison. Use this PPT for your business and finance based data comparison in any financial presentation.
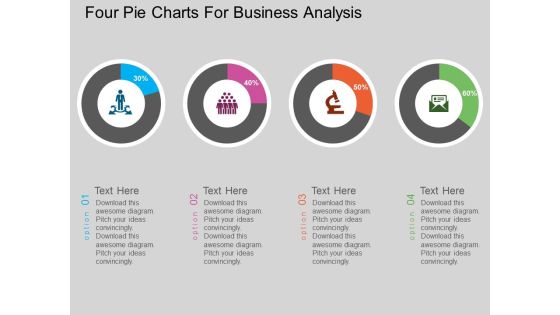
Four Pie Charts For Business Analysis Powerpoint Template
This PowerPoint template has been designed with graphics of four pie charts This diagram can be used to display financial planning and business analysis. Capture the attention of your audience with this slide.

Area Chart Ppt PowerPoint Presentation Layouts Vector
This is a area chart ppt powerpoint presentation layouts vector. This is a two stage process. The stages in this process are area chart, product, sales in percentage, financial year.

Column Chart Ppt PowerPoint Presentation Ideas Vector
This is a column chart ppt powerpoint presentation ideas vector. This is a two stage process. The stages in this process are column chart, product, financial years, sales in percentage, growth.

Line Chart Ppt PowerPoint Presentation Professional Grid
This is a line chart ppt powerpoint presentation professional grid. This is a two stage process. The stages in this process are sales in percentage, financial years, product, line chart.
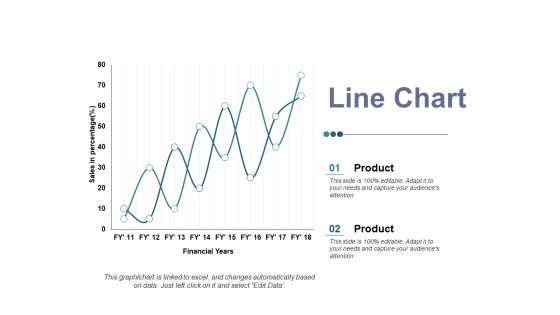
Line Chart Ppt PowerPoint Presentation Ideas Elements
This is a line chart ppt powerpoint presentation ideas elements. This is a two stage process. The stages in this process are product, sales in percentage, financial year, business, line chart.
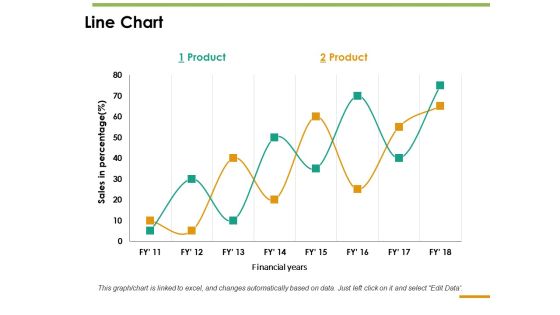
Line Chart Ppt PowerPoint Presentation Inspiration Guide
This is a line chart ppt powerpoint presentation inspiration guide. This is a two stage process. The stages in this process are line chart, sales in percentage, product, financial years.

Combo Chart Ppt PowerPoint Presentation Slides Outline
This is a combo chart ppt powerpoint presentation slides outline. This is a three stage process. The stages in this process are combo chart, growth, product, financial year, business.

Benefits Of Business Intelligence Layout Ppt Slide
This is a benefits of business intelligence layout ppt slide. This is a three stage process. The stages in this process are accounting and budgeting system, financial and standard reporting, operational and transactional system, business operations, business intelligence, finance, technology.

Column Chart Ppt PowerPoint Presentation Slides Smartart
This is a column chart ppt powerpoint presentation slides smartart. This is a two stage process. The stages in this process are sales in percentage, financial year in, business, growth, strategy.
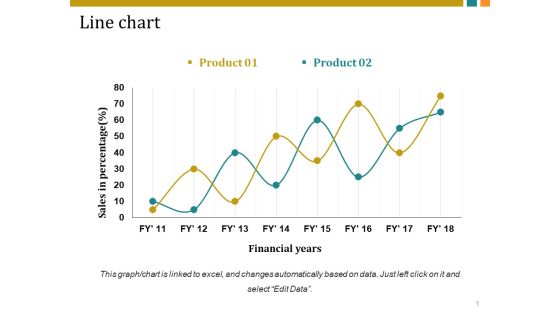
Line Chart Ppt PowerPoint Presentation Inspiration Vector
This is a line chart ppt powerpoint presentation inspiration vector. This is a two stage process. The stages in this process are sales in percentage, financial years, business, marketing, growth.

Column Chart Ppt PowerPoint Presentation Gallery Background
This is a column chart ppt powerpoint presentation gallery background. This is a two stage process. The stages in this process are product, sales in percentage, financial year, graph, success.

Line Chart Ppt PowerPoint Presentation Pictures Templates
This is a line chart ppt powerpoint presentation pictures templates. This is a two stage process. The stages in this process are sales in percentage, financial years, business, marketing, growth.

Column Chart Ppt PowerPoint Presentation Layouts Tips
This is a column chart ppt powerpoint presentation layouts tips. This is a six stage process. The stages in this process are sales in percentage, financial year, bar graph, growth, success.

Column Chart Ppt PowerPoint Presentation Outline Styles
This is a column chart ppt powerpoint presentation outline styles. This is a two stage process. The stages in this process are sales in percentage, financial year in, business, marketing, graph.

Line Chart Ppt PowerPoint Presentation Infographics Infographics
This is a line chart ppt powerpoint presentation infographics infographics. This is a two stage process. The stages in this process are product, sales in percentage, financial year, line chart, finance.

Line Chart Ppt PowerPoint Presentation Gallery Rules
This is a line chart ppt powerpoint presentation gallery rules. This is a two stage process. The stages in this process are financial years, product, sales in percentage, line chart, growth.

Line Chart Ppt PowerPoint Presentation Gallery Templates
This is a line chart ppt powerpoint presentation gallery templates. This is a two stage process. The stages in this process are product, financial years, sales in percentage, line chart.

Column Chart Ppt PowerPoint Presentation Slides Show
This is a column chart ppt powerpoint presentation slides show. This is a two stage process. The stages in this process are column chart, product, sales in percentage, financial year, growth.
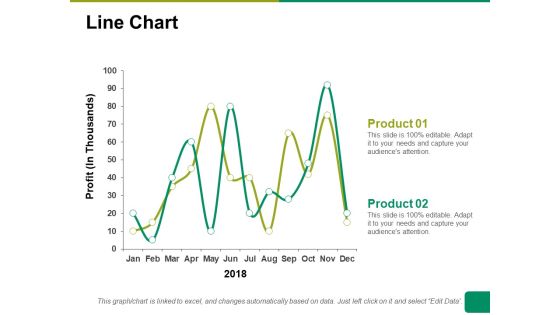
Line Chart Ppt PowerPoint Presentation Summary Ideas
This is a line chart ppt powerpoint presentation summary ideas. This is a two stage process. The stages in this process are line chart, profit, product, financial years, business.
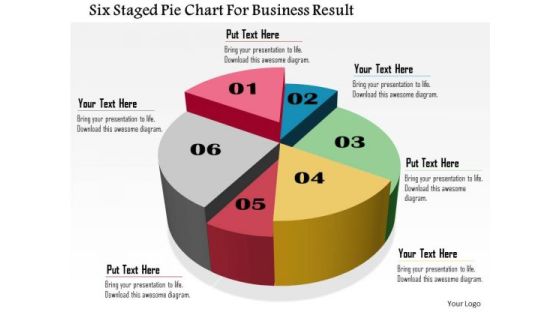
Business Daigram Six Staged Pie Chart For Business Result Presentation Templets
Six staged pie chart is used to design this business slide. Download this diagram to make business and financial reports. Use our above diagram to express information in a visual way.

Business Plan Circle Chart Powerpoint Slides Templates
This is a business plan circle chart powerpoint slides templates. This is a six stage process. The stages in this process are information technology plan, human resources plan, production plan, marketing plan, marketing plan, financial plan, management plan.

Basic Accounting And Bookkeeping Chart Ppt Slides
This is a basic accounting and bookkeeping chart ppt slides. This is a five stage process. The stages in this process are financial statements, source documents, accounting cycle, journals, ledger, trial balance.

Circular Flow Of Income Chart Ppt Presentation
This is a circular flow of income chart ppt presentation. This is a four stage process. The stages in this process are real estate, government, financial institutions, export import, firms.

Marchandise Management System Chart Ppt Sample
This is a marchandise management system chart ppt sample. This is a seven stage process. The stages in this process are payment management, inspection, marketing, sourcing, channel management, financial management, orders.

Corporate Leadership Skills Chart Presentation Design
This is a corporate leadership skills chart presentation design. This is a six stage process. The stages in this process are planning and organization, social adjustment, advance financial frameworks, management fundamentals, dynamism, strategic skill.

Area Chart Ppt PowerPoint Presentation Pictures Files
This is a area chart ppt powerpoint presentation pictures files. This is a two stage process. The stages in this process are product, sales, in percentage, financial year, business.

Line Chart Ppt PowerPoint Presentation Layouts Example
This is a line chart ppt powerpoint presentation layouts example. This is a two stage process. The stages in this process are sales in percentage, product, financial years, growth, success.

Line Chart Ppt PowerPoint Presentation Show Guide
This is a line chart ppt powerpoint presentation show guide. This is a two stage process. The stages in this process are product, sales in percentage, financial years, growth, success.

Bar Diagram Ppt PowerPoint Presentation Gallery Structure
This is a bar diagram ppt powerpoint presentation gallery structure. This is a three stage process. The stages in this process are financial in years, sales in percentage, bar graph, growth, success.

Linear Circles Percentage Analysis Charts Powerpoint Slides
This PowerPoint template has been designed with graphics of three circles and percentage ratios. You may use this dashboard slide design for topics like profit growth and financial planning. This PPT slide is powerful tool to describe your ideas.

Corporate Balanced Scorecard Diagram Ppt Diagrams
This is a corporate balanced scorecard diagram ppt diagrams. This is a five stage process. The stages in this process are financial perspective, customer perspective, internal processes, growth, internal metrics, balanced scorecard.

Business Networking Design Of Management Ppt PowerPoint Presentation Show
This is a business networking design of management ppt powerpoint presentation show. This is a three stage process. The stages in this process are ceo, manager, director, graphic designer, financial advisor, sales manager, product manager, editor, accountant.

Multiple Phases For Supply Chain Management Performance Measures Themes PDF
This is a multiple phases for supply chain management performance measures themes pdf template with various stages. Focus and dispense information on two stages using this creative set, that comes with editable features. It contains large content boxes to add your information on topics like non financial measures, financial measures. You can also showcase facts, figures, and other relevant content using this PPT layout. Grab it now.
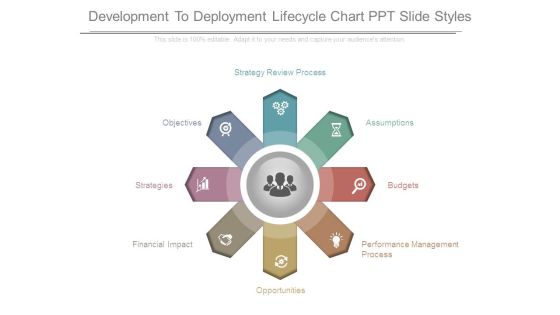
Development To Deployment Lifecycle Chart Ppt Slide Styles
This is a development to deployment lifecycle chart ppt slide styles. This is a eight stage process. The stages in this process are performance management process, opportunities, financial impact, strategies, objectives, strategy review process, assumptions, budgets.
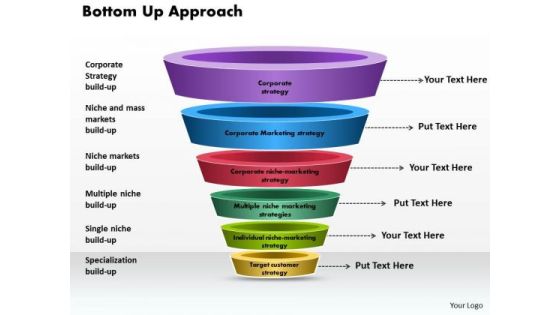
Business Framework Bottom Up Approach PowerPoint Presentation
This power point diagram slide has been crafted with bottom up approach. In this diagram, we have used multilevel funnel diagram with individual state. Use this diagram for your financial presentations and display bottom up approach in an graphical manner.

Business Framework Equity Valuation PowerPoint Presentation
This business framework Power Point template diagram has been crafted with graphic of three stage diagram. This PPT diagram contains the concept of equity valuation. Use this PPT diagram for your financial system related presentations.
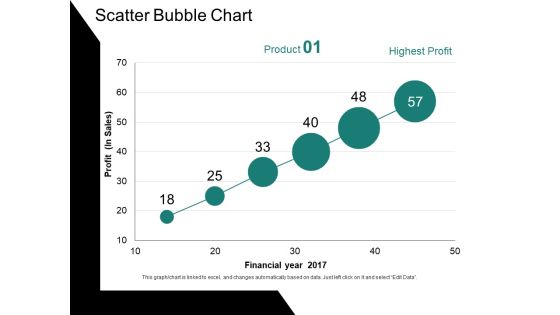
Scatter Bubble Chart Ppt PowerPoint Presentation Ideas Gallery
This is a scatter bubble chart ppt powerpoint presentation ideas gallery. This is a six stage process. The stages in this process are profit, financial year, chart, business, growth.
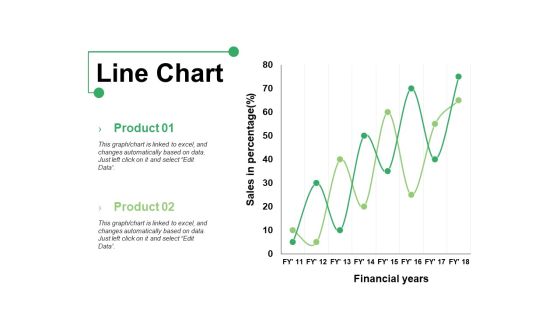
Line Chart Ppt PowerPoint Presentation Show Graphics Example
This is a line chart ppt powerpoint presentation show graphics example. This is a two stage process. The stages in this process are product, line chart, financial years, sales in percentage.

Column Chart Ppt PowerPoint Presentation Portfolio Example Topics
This is a column chart ppt powerpoint presentation portfolio example topics. This is a two stage process. The stages in this process are product, financial year, sales in percentage, column chart.

Column Chart Ppt PowerPoint Presentation Gallery Design Inspiration
This is a column chart ppt powerpoint presentation gallery design inspiration. This is a two stage process. The stages in this process are column chart, product, sales in percentage, financial years.

Bar Diagram Ppt PowerPoint Presentation Pictures Background Image
This is a bar diagram ppt powerpoint presentation pictures background image. This is a three stage process. The stages in this process are financial in years, sales in percentage, bar graph, growth, success.
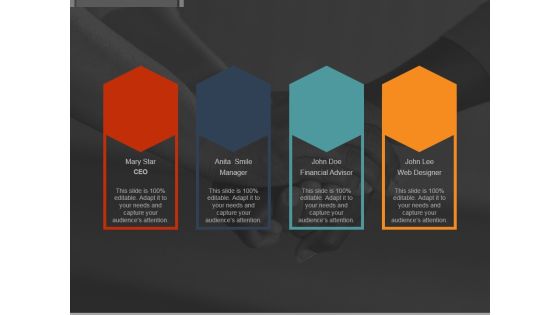
Our Team Ppt PowerPoint Presentation Backgrounds
This is a our team ppt powerpoint presentation backgrounds. This is a four stage process. The stages in this process are mary star, anita smile, john doe, john lee, web designer, financial advisor, manager, ceo.

Client Testimonials Ppt Powerpoint Presentation Model Good
This is a client testimonials ppt powerpoint presentation model good. This is a two stage process. The stages in this process are ceo john doe, financial advisor julie star, teamwork, marketing.

Client Testimonials Ppt PowerPoint Presentation Slides Objects
This is a client testimonials ppt powerpoint presentation slides objects. This is a two stage process. The stages in this process are john doe, julie star, ceo, financial advisor.

Line Chart Ppt PowerPoint Presentation Infographics Graphic Images
This is a line chart ppt powerpoint presentation infographics graphic images. This is a two stage process. The stages in this process are sales in percentage, financial years, growth, business, marketing.

Line Chart Ppt PowerPoint Presentation Professional Graphics Design
This is a line chart ppt powerpoint presentation professional graphics design. This is a two stage process. The stages in this process are financial years, sales in percentage, product, growth, success.

Column Chart Ppt PowerPoint Presentation Infographics Layout Ideas
This is a column chart ppt powerpoint presentation infographics layout ideas. This is a two stage process. The stages in this process are financial year in, business, marketing, growth, graph.
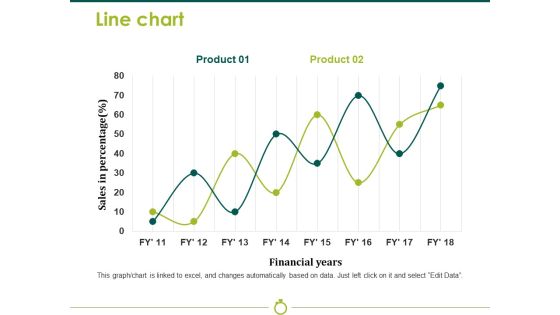
Line Chart Template 2 Ppt PowerPoint Presentation Model Background Image
This is a line chart template 2 ppt powerpoint presentation model background image. This is a two stage process. The stages in this process are sales in percentage, financial years, business, marketing, strategy, graph.

Column Chart Ppt PowerPoint Presentation Slides Visual Aids
This is a column chart ppt powerpoint presentation slides visual aids. This is a six stage process. The stages in this process are bar graph, growth, success, sales in percentage, financial year.
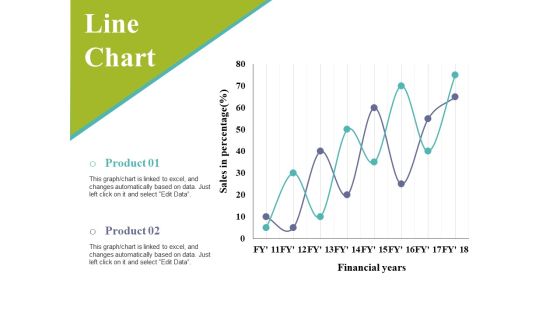
Line Chart Ppt PowerPoint Presentation Infographic Template Slides
This is a line chart ppt powerpoint presentation infographic template slides. This is a two stage process. The stages in this process are sales in percentage, financial years, business, marketing, graph.

Line Chart Ppt PowerPoint Presentation Infographic Template Master Slide
This is a line chart ppt powerpoint presentation infographic template master slide. This is a two stage process. The stages in this process are product, financial years, sales in percentage.

Business Diagram Hourglasses With Currencies Symbols Presentation Template
Download this diagram to display time management tips for financial professionals. This business diagram contains the graphic of hourglasses with currency symbols. Use this template to highlight the key issues of your presentation.

Line Bubble Chart Ppt PowerPoint Presentation Portfolio Slide Portrait
This is a line bubble chart ppt powerpoint presentation portfolio slide portrait. This is a six stage process. The stages in this process are highest profit, financial year, profit in sales, growth, business.
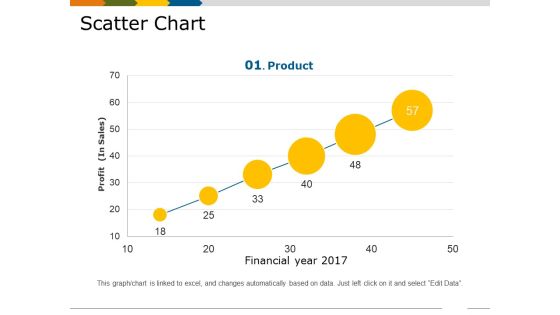
Scatter Chart Template 1 Ppt PowerPoint Presentation Show Slides
This is a scatter chart template 1 ppt powerpoint presentation show slides. This is a six stage process. The stages in this process are financial year, profit in sales, growth, business, marketing, product.

Stock Photo Graphics For Business Reports And Charts PowerPoint Slide
This image contains graphics of business reports and charts. Download this image for business and sales presentations where you have to focus on financial growth. Dazzle the audience with your thoughts.

Arrow Steps Chart For Business Success Powerpoint Template
This PowerPoint template has been designed with graphics of arrow steps chart. Download this slide for planning of financial targets. Grab the attention of your listeners with this PPT slide.
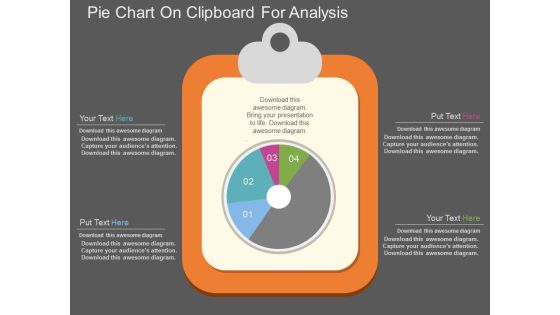
Pie Chart On Clipboard For Analysis Powerpoint Template
This PowerPoint template has been designed with graphics of pie chart on clipboard. Download this PPT slide for business and financial analysis. You may also use this professional template to depict statistical analysis.
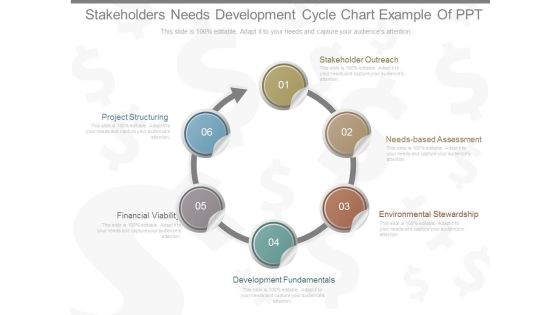
Stakeholders Needs Development Cycle Chart Example Of Ppt
This is a stakeholders needs development cycle chart example of ppt. This is a six stage process. The stages in this process are stakeholder outreach, needs based assessment, environmental stewardship,, development fundamentals, financial viability, project structuring.

Corporate Public Relation Puzzle Chart Powerpoint Slide Show
This is a corporate public relation puzzle chart powerpoint slide show. This is a nine stage process. The stages in this process are business partners, media, employees, customers, shareholders, investors, financial marketing, politics and state administration, pr.

Small Business Structure Chart Example Powerpoint Slide Background Image
This is a small business structure chart example powerpoint slide background image. This is a six stage process. The stages in this process are financial manager, sales, distributions, finance, operations, general manager.

Improved Customer Service Experience Pie Charts Ppt PowerPoint Presentation Templates
This is a improved customer service experience pie charts ppt powerpoint presentation templates. This is a four stage process. The stages in this process are increased efficiency, better business decision making, improved customer experience and engagement, achieved financial savings.

Departments And Team Hierarchy Chart Ppt PowerPoint Presentation Styles
This is a departments and team hierarchy chart ppt powerpoint presentation styles. This is a three stage process. The stages in this process are director, financial advisor, marketing head, manager, web designer, graphic designer.

Scatter Bubble Chart Ppt PowerPoint Presentation Professional Model
This is a scatter bubble chart ppt powerpoint presentation professional model. This is a six stage process. The stages in this process are sales in profit, financial year, growth, business, marketing, strategy.
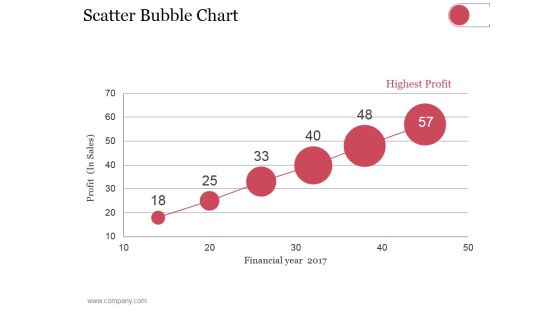
Scatter Bubble Chart Ppt PowerPoint Presentation Summary Pictures
This is a scatter bubble chart ppt powerpoint presentation summary pictures. This is a six stage process. The stages in this process are highest profit, financial year, profit in sales.

Line Chart Ppt PowerPoint Presentation Model Design Templates
This is a line chart ppt powerpoint presentation model design templates. This is a two stage process. The stages in this process are sales in percentage, financial years, product.

Area Chart Ppt PowerPoint Presentation Show Layout Ideas
This is a area chart ppt powerpoint presentation show layout ideas. This is a two stage process. The stages in this process are product, in percentage, financial year, growth.
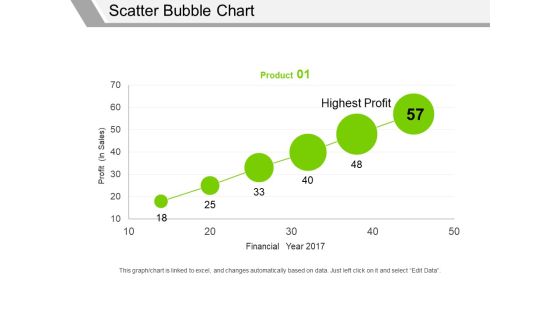
Scatter Bubble Chart Ppt PowerPoint Presentation Professional Graphics Pictures
This is a scatter bubble chart ppt powerpoint presentation professional graphics pictures. This is a one stage process. The stages in this process are profit in sales, financial year, highest profit, product.

Scatter Bubble Chart Ppt PowerPoint Presentation Summary Files
This is a scatter bubble chart ppt powerpoint presentation summary files. This is a six stage process. The stages in this process are product, financial year, profit, highest profit.

Area Chart Ppt PowerPoint Presentation File Graphic Tips
This is a area chart ppt powerpoint presentation file graphic tips. This is a two stage process. The stages in this process are product, in percentage, financial year, business, growth.
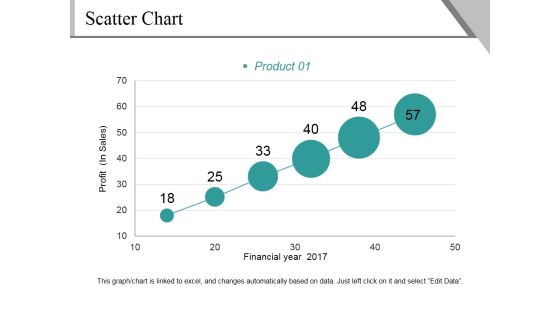
Scatter Chart Ppt PowerPoint Presentation File Background Image
This is a scatter chart ppt powerpoint presentation file background image. This is a six stage process. The stages in this process are profit, financial year, product, growth, success.

Column Chart Ppt PowerPoint Presentation Model Graphics Download
This is a column chart ppt powerpoint presentation model graphics download. This is a two stage process. The stages in this process are product, financial year, sales in percentage, bar graph, success.
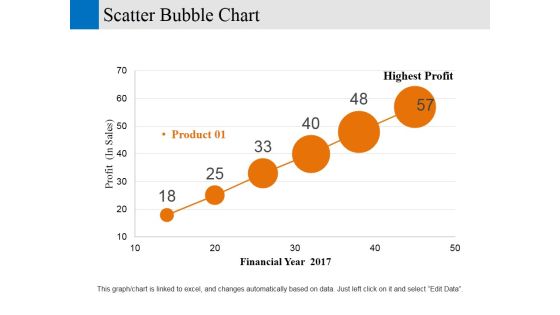
Scatter Bubble Chart Ppt PowerPoint Presentation Gallery Designs Download
This is a scatter bubble chart ppt powerpoint presentation gallery designs download. This is a six stage process. The stages in this process are financial year, profit, business, marketing, strategy.

Column Chart Ppt PowerPoint Presentation Gallery Slide Portrait
This is a column chart ppt powerpoint presentation gallery slide portrait. This is a two stage process. The stages in this process are sales in percentage, financial year, product, bar graph, growth.

Bar Chart Ppt PowerPoint Presentation Infographics Format Ideas
This is a bar chart ppt powerpoint presentation infographics format ideas. This is a two stage process. The stages in this process are bar graph, product, financial year, sales in percentage.

Business Presentation Theme Template Presentation Deck
This is a business presentation theme template presentation deck. This is a four stage process. The stages in this process are about us, leadership and management team, business plan, financial plan.

Complete Business Plan Example Ppt Slides Themes
This is a complete business plan example ppt slides themes. This is a two stage process. The stages in this process are business plan, mission statement, competitor analysis, product description, marketing plan, executive summary, company background, financial planning.

Business Assessment Strategies Example Powerpoint Slide Themes
This is a business assessment strategies example powerpoint slide themes. This is a seven stage process. The stages in this process are marketing strategy, implement, voice of the business, assessment, mission and vision, corporate strategy, financial strategy.
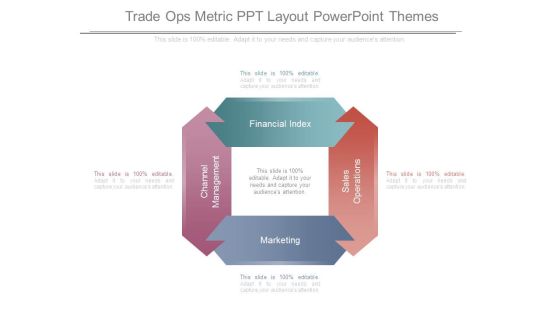
Trade Ops Metric Ppt Layout Powerpoint Themes
This is a trade ops metric ppt layout powerpoint themes. This is a four stage process. The stages in this process are channel management, marketing, sales operations, financial index.

Our Leadership Experts Powerpoint Slide Themes
This is a our leadership experts powerpoint slide themes. This is a four stage process. The stages in this process are jenny smith, tom smith, anita smith, mary smith, founder ceo, designer, financial advisor, manager.

Our Team Ppt PowerPoint Presentation Professional Themes
This is a our team ppt powerpoint presentation professional themes. This is a three stage process. The stages in this process are ceo, graphic designer, financial advisor, teamwork, communication.

Business Diagram Line Graph For Dollar Growth Presentation Template
Graphic of dollar symbol and growth arrow has been used to design this power point template. This diagram contains the concept of financial result analysis. Use this business diagram for finance related presentations
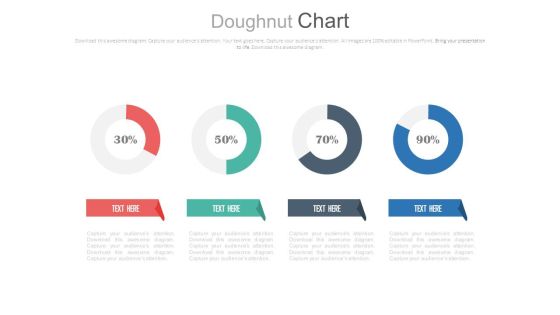
Four Circle Chart With Percentage Ratios Powerpoint Slides
This PowerPoint template has been designed with graphics of four circles and percentage ratios. You may use this dashboard slide design for topics like profit growth and financial planning. This PPT slide is powerful tool to describe your ideas.

Business Diagram Diagram For Visual Data Display Presentation Template
Four colored cylindrical bars with percentage values are used to design this power point template. This diagram slide helps to display financial data analysis. Use this diagram for your business and finance related presentations.
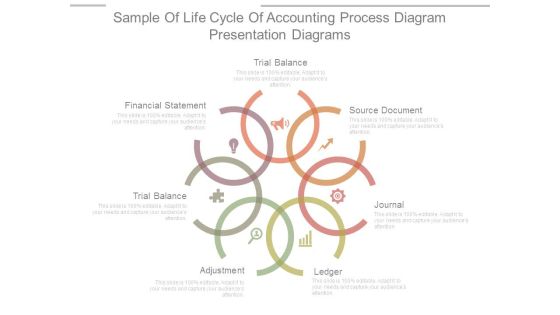
Sample Of Life Cycle Of Accounting Process Diagram Presentation Diagrams
This is a sample of life cycle of accounting process diagram presentation diagrams. This is a seven stage process. The stages in this process are trial balance, source document, journal, ledger, adjustment, financial statement.

Sales Growth Ppt Diagram Sales Growth Ppt Diagram
This is a sales growth ppt diagram sales growth ppt diagram. This is a six stage process. The stages in this process are commitment, authorization, financial excellence, obligation, focused action, organizational agility.
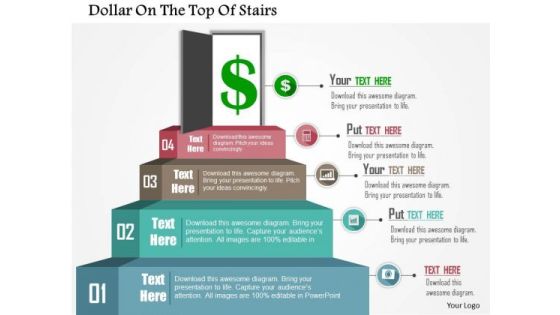
Business Diagram Dollar On The Top Of Stairs Presentation Template
Graphic of dollar on the top of the stairs has been used to craft this power point template. This PPT diagram contains the concept of financial growth. Use this PPT for business and finance related presentations.

Content Ppt PowerPoint Presentation Infographics Diagrams
This is a content ppt powerpoint presentation infographics diagrams. This is a thirteen stage process. The stages in this process are business highlights, financial highlights, products offering, sales performance dashboard, sales revenue by region.

Debt Management Diagram Ppt Sample
This is a debt management diagram ppt sample. This is a five stage process. The stages in this process are debt problem, debt counseling, payment plan, debt review, financial freedom.

Retailing Strategies Diagram Powerpoint Ideas
This is a retailing strategies diagram powerpoint ideas. This is a eight stage process. The stages in this process are retail market strategy, site location, pricing, store design and display, information system, financial strategy, communication mix, customer service.
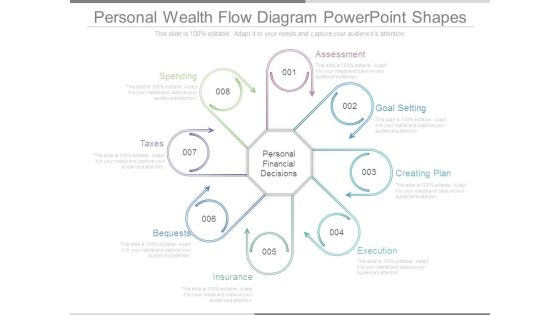
Personal Wealth Flow Diagram Powerpoint Shapes
This is a personal wealth flow diagram powerpoint shapes. This is a eight stage process. The stages in this process are assessment, goal setting, creating plan, execution, insurance, bequests, taxes, spending, personal financial decisions.

Scorecard Management Diagram Ppt Samples Download
This is a scorecard management diagram ppt samples download. This is a five stage process. The stages in this process are financial goals, growth, customer metrics, budget finance, internal metrics.
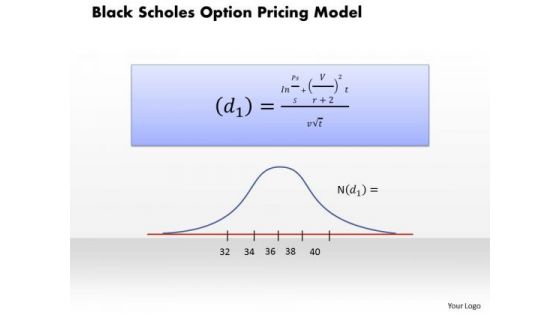
Business Framework Black Scholes Ption Pricing Model PowerPoint Presentation
This power point diagram has been crafted with graphic of black scholes ption pricing model. Use this model for various pricing valuation. Explain its graphical representation with our exclusive model. Use this diagram slide for financial presentation.

Business Framework Bond Prices And Yields PowerPoint Presentation
This power point diagram slide has been crafted with graphic of statistics of bond price and yields. Display the dependency in-between these two fields with this innovative diagram slide. This slide is very useful for financial presentations.
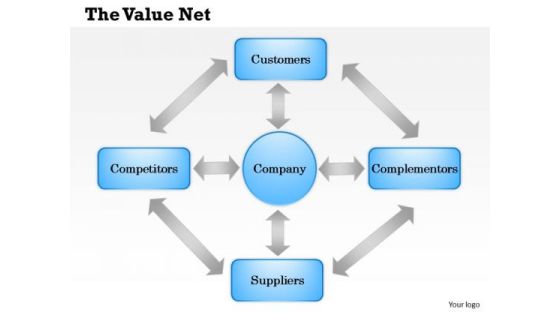
Business Framework The Value Net PowerPoint Presentation
This business power point diagram template has been designed with graphic of multiple staged. This diagram template can be used for value net calculation display in any financial and business presentations.
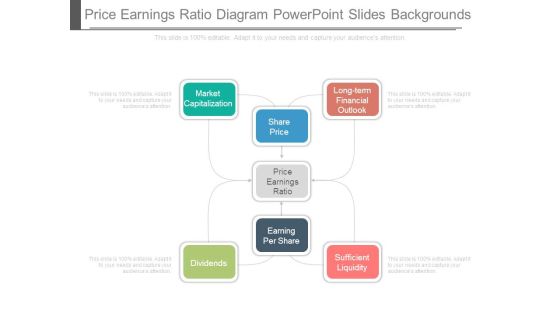
Price Earnings Ratio Diagram Powerpoint Slides Backgrounds
This is a price earnings ratio diagram powerpoint slides backgrounds. This is a four stage process. The stages in this process are market capitalization, long term financial outlook, share price, price earnings ratio, earning per share, dividends, sufficient liquidity.
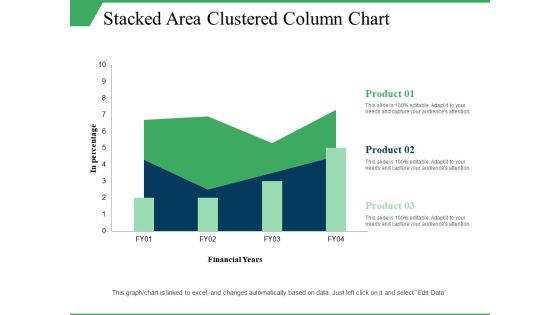
Stacked Area Clustered Column Chart Ppt PowerPoint Presentation Visual Aids Model
This is a stacked area clustered column chart ppt powerpoint presentation visual aids model. This is a three stage process. The stages in this process are in percentage, product, financial years, growth, column chart.

Example Of E Commerce Themes Ppt Powerpoint Shapes
This is a example of e commerce themes ppt powerpoint shapes. This is a three stage process. The stages in this process are business analysis and planning, financial report, e commerce.
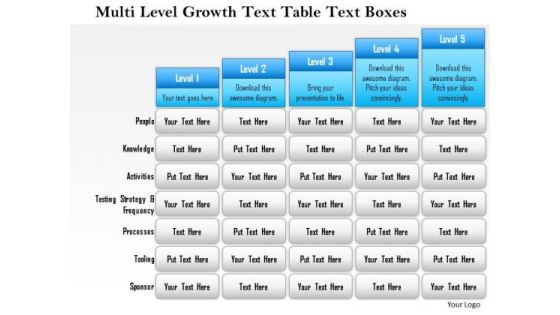
Business Framework Multi Level Growth Text Table Text Boxes 2 PowerPoint Presentation
Five staged text box style chart in bar graph design has been used to decorate this power point template slide. This diagram slide contains the multilevel growth concept. Use this PPT slide for financial growth and result analysis related topics.

Business Framework Poverty Index PowerPoint Presentation
A linear growth chart with text boxes has been used to decorate this Power Point template slide. This diagram slide contains the concept of poverty index. Use this index in your financial presentations to show poverty based calculation.

Objectives Of Corporate Governance Ppt Diagrams
This is a objectives of corporate governance ppt diagrams. This is a five stage process. The stages in this process are legal and financial discipline, delivering values, accountability, transparency, stakeholder analysis.

Enterprise Risk Management Strategy Diagram Ppt Sample
This is a enterprise risk management strategy diagram ppt sample. This is a three stage process. The stages in this process are risk management activities, input and risk identification, risk based monitoring, policy development, financial reporting, operational, contract and acquisition.\n\n\n\n\n\n\n\n

Potential Target Acquisitions Diagram Powerpoint Slides
This is a potential target acquisitions diagram powerpoint slides. This is a six stage process. The stages in this process are acquisition rationale, financial resources, strategy, sectors, scale, stage of development, ability.

Cost Management System Diagram Ppt Slide Show
This is a cost management system diagram ppt slide show. This is a seven stage process. The stages in this process are research and development, quality control, marketing, financial accounting, production reporting, inventory management, production planning and scheduling, cost accounting.

Customer Relationship Management Diagram Ppt Sample
This is a customer relationship management diagram ppt sample. This is a four stage process. The stages in this process are business process redesign, customer relationship management, financial management, enterprises resources planning.

Professional Business Plan Services Diagram Ppt Slides
This is a professional business plan services diagram ppt slides. This is a five stage process. The stages in this process are plan of operations, marketing plan, financial plan, risk management, management and labour, vision values strategy.

Corporate Objectives Sample Diagram Example Of Ppt
This is a corporate objectives sample diagram example of ppt. This is a three stage process. The stages in this process are corporate objective, corporate strategy, marketing strategy, human resource, management strategy, operations strategy, financial strategy.

Asset Liability Management Diagram Powerpoint Slides
This is a asset liability management diagram powerpoint slides. This is a five stage process. The stages in this process are business model, risk analysis, financial model, liquidity model, stress tests.

B2b Integration Platform Sample Diagram Ppt Images
This is a b2b integration platform sample diagram ppt images. This is a eight stage process. The stages in this process are integration platform, your company, marketplace, financial services, business customers, suppliers, customer services, distributors, logistics providers, estore.

Agile Business Model Hypothesis Sample Diagram Slides
This is a agile business model hypothesis sample diagram slides. This is a three stage process. The stages in this process are strategy, search, business model hypothesis, execution, operating plan financial forecast.

Innovation Assessment For Business Analysis Sample Diagram
This is a innovation assessment for business analysis sample diagram. This is a five stage process. The stages in this process are innovation assessment, market research, management team, competitive analysis, business model, financial projection.

Software Asset Management Diagram Powerpoint Layout
This is a software asset management diagram powerpoint layout. This is a ten stage process. The stages in this process are change management, governance, detection, inventory, contracts, optimization, configuration management, vendor management, product management, financial management.

Order Management System Diagram Ppt Design Images
This is a order management system diagram ppt design images. This is a eight stage process. The stages in this process are store, cross channel order management, crm, business intelligence, financial management, planning, sourcing and plm, merchandising, epicor retail.

Business Order Management System Diagram Presentation Graphics
This is a business order management system diagram presentation graphics. This is a seven stage process. The stages in this process are fulfillment monitoring, order processing, sales return, order acceptance, purchase order, financial control, order orchestration.

Trading Medium Evolution Diagram Ppt Sample File
This is a trading medium evolution diagram ppt sample file. This is a six stage process. The stages in this process are potential entrants, human resources, substitutes, financial services, buyers, suppliers.

Real Estate Marketing Diagram Powerpoint Graphics
This is a real estate marketing diagram powerpoint graphics. This is a eight stage process. The stages in this process are master plan, marketing and sales, financial plan, monitoring, sales execution, lead management, campaign, research.

Annual Planning Calendar Diagram Powerpoint Guide
This is a annual planning calendar diagram powerpoint guide. This is a six stage process. The stages in this process are strategic management model, managing profit and performance, product service, values mission vision, external environment, financial objectives.
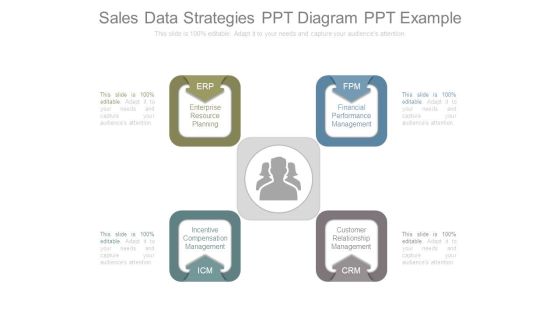
Sales Data Strategies Ppt Diagram Ppt Example
This is a sales data strategies ppt diagram ppt example. This is a four stage process. The stages in this process are enterprise resource planning, financial performance management, incentive compensation management, customer relationship management.
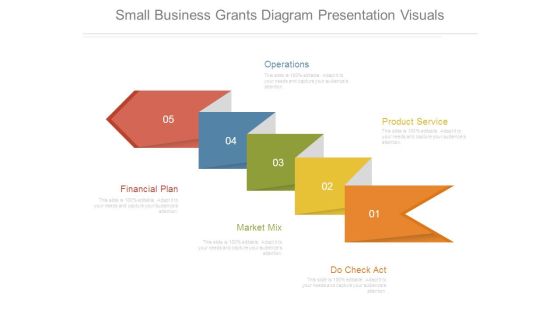
Small Business Grants Diagram Presentation Visuals
This is a small business grants diagram presentation visuals. This is a five stage process. The stages in this process are operations, product service, financial plan, market mix, do check act.

Sales Goals Template Diagram Ppt Slide Design
This is a sales goals template diagram ppt slide design. This is a six stage process. The stages in this process are saving, protecting wealth, accumulation wealth, financial goals, balance, growth.

Portfolio Availability Strategy Diagram Powerpoint Slide Backgrounds
This is a portfolio availability strategy diagram powerpoint slide backgrounds. This is a five stage process. The stages in this process are resource management, financial management, risk assessment, demand management.

Balanced Scorecard Perspectives Diagram Powerpoint Slide Ideas
This is a balanced scorecard perspectives diagram powerpoint slide ideas. This is a four stage process. The stages in this process are financial perspective, customer perspective, internal perspective, learning and growth perspective.
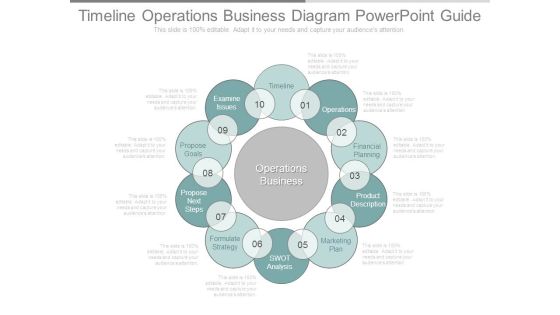
Timeline Operations Business Diagram Powerpoint Guide
This is a timeline operations business diagram powerpoint guide. This is a ten stage process. The stages in this process are examine issues, propose goals, propose next steps, formulate strategy, swot analysis, timeline, operations, financial planning, product description, marketing plan.
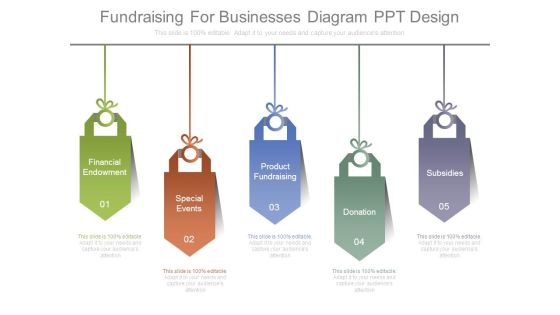
Fundraising For Businesses Diagram Ppt Design
This is a fundraising for businesses diagram ppt design. This is a five stage process. The stages in this process are financial endowment, special events, product fundraising, donation, subsidies.
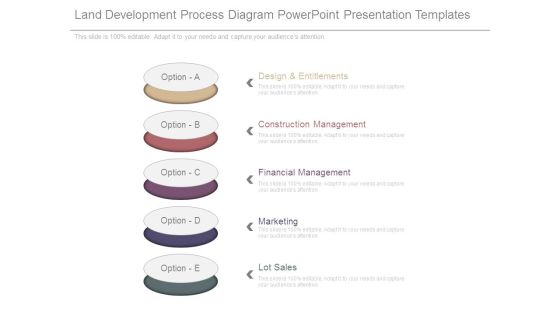
Land Development Process Diagram Powerpoint Presentation Templates
This is a land development process diagram powerpoint presentation templates. This is a five stage process. The stages in this process are design and entitlements, construction management, financial management, marketing, lot sales.

Balanced Scorecard Approach Diagram Presentation Design
This is a balanced scorecard approach diagram presentation design. This is a five stage process. The stages in this process are measuring standards, discussing results, customer perspective, internal processes, financial perspective, balanced scorecard.

Cost Reduction Assessment Diagram Ppt Example
This is a cost reduction assessment diagram ppt example. This is a four stage process. The stages in this process are define the cost of decision, cost of service, analyze financial performance, cost of medical devices.
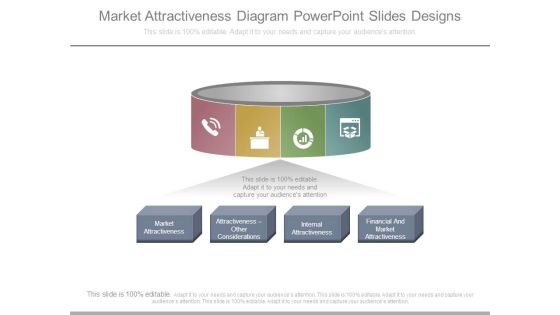
Market Attractiveness Diagram Powerpoint Slides Designs
This is a market attractiveness diagram powerpoint slides designs. This is a four stage process. The stages in this process are market attractiveness, attractiveness other considerations, internal attractiveness, financial and market attractiveness.

Comprehensive Turnaround Plan Diagram Ppt Example
This is a comprehensive turnaround plan diagram ppt example. This is a six stage process. The stages in this process are crisis stabilization, financial restructuring, human resource planning, strategic focus, analysis and valuation, marketing and sales.
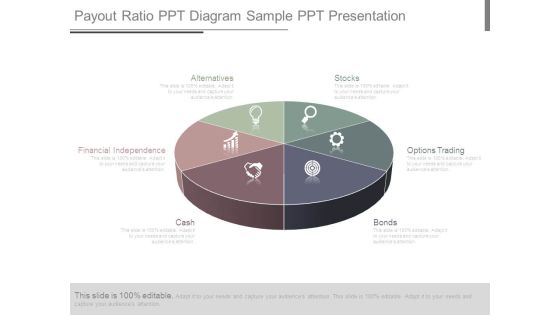
Payout Ratio Ppt Diagram Sample Ppt Presentation
This is a payout ratio ppt diagram sample ppt presentation. This is a six stage process. The stages in this process are stocks, options trading, bonds, cash, financial independence, alternatives.
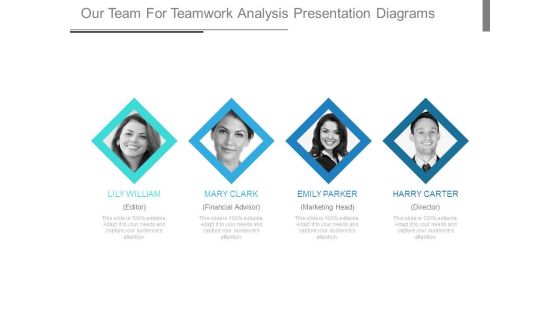
Our Team For Teamwork Analysis Presentation Diagrams
This is a our team for teamwork analysis presentation diagrams. This is a four stage process. The stages in this process are lily william editor, mary clark financial advisor, emily parker marketing head, harry carter director.

Finance Dashboard Ppt PowerPoint Presentation Diagrams
This is a finance dashboard ppt powerpoint presentation diagrams. This is a four stage process. The stages in this process are increased efficiency, better business decision making, improved customer experience and engagement, achieved financial savings.

3d Happy Man With Money PowerPoint Templates
Explain the concept of financial growth strategy and its requirement for success with this unique image. This contains the graphic of 3d man with money. This diagram slide is well designed for finance presentations to give better explanation of growth.
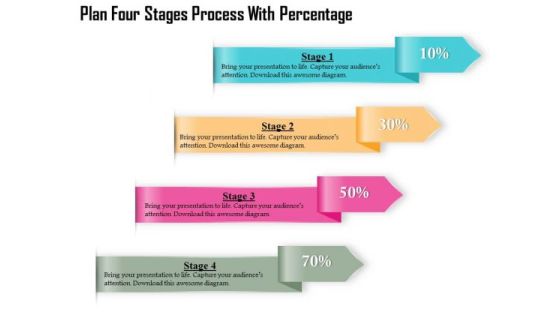
Business Diagram Four Stages Process With Percentage Presentation Template
Four multicolored tags in vertical order has been used to decorate this business diagram. This diagram contains the concept of financial data display with percent values. This diagram can be used for management and finance related presentations.

Business Diagram Three Stages Process Percentage Presentation Template
Three multicolored tags in vertical order has been used to decorate this business diagram. This diagram contains the concept of financial data display with percent values. This diagram can be used for management and finance related presentations.
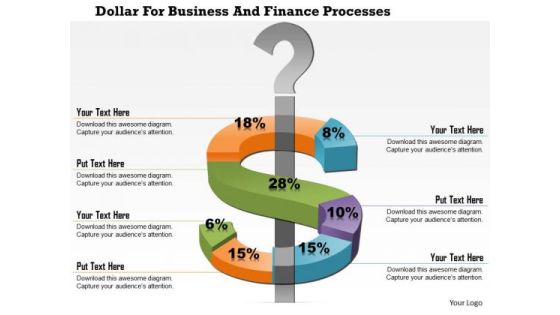
Business Diagram Dollar For Business And Finance Processes Presentation Template
This business diagram displays dollar symbol around a question mark. This diagram depicts change in dollar currency value. Use this slide to make financial and business reports and presentations.
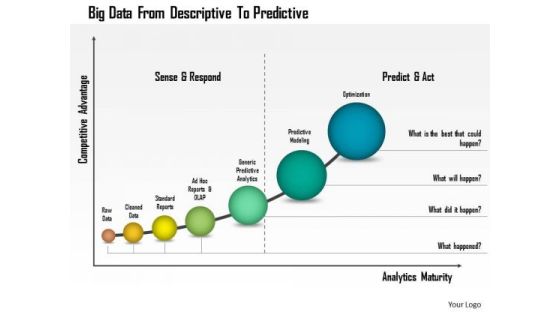
Business Diagram Big Data From Descriptive To Predictive Presentation Template
This business diagram has been designed with graphic of linear bar graph. This growing bar graph depicts the concept of big data analysis. Use this professional diagram for your financial and business analysis.

Man With Money Bags Pros And Cons Layout Powerpoint Templates
Create dynamic presentations with our professional template containing graphics of man with money bag in hands. This diagram is useful to display pros and cons of financial plan. Download this template to leave permanent impression on your audience.
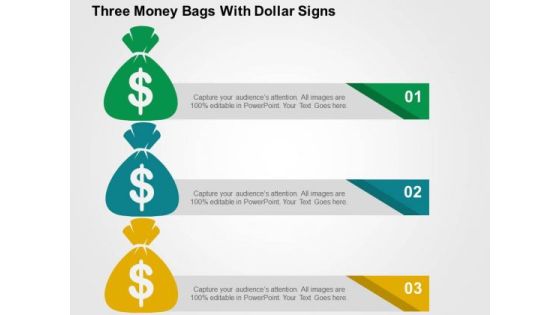
Three Money Bags With Dollar Signs PowerPoint Templates
This unique template displays diagram of three money bags with dollar symbol. This professional slide helps to represent financial planning and execution. This graphic slide is an effective tool to make your clients understand the topic.

Business Diagram Silver Capsule For Medication And Treatment Presentation Template
This business diagram displays graphics of capsule with currency symbol. It contains silver capsule with different currency signs inside it. Use this slide for health care and financial topics. Get professional with this exclusive business slide.
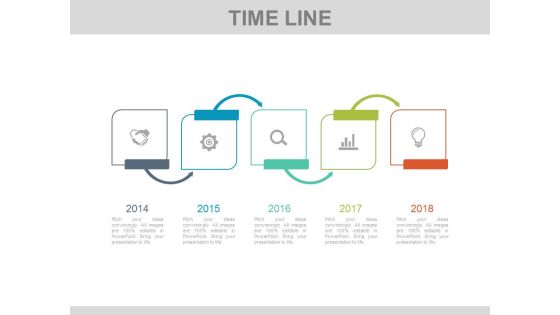
Five Steps Linear Timeline Infographic Diagram Powerpoint Slides
This infographic timeline template can be used for multiple purposes including financial planning, new milestones and tasks. It contains linear timeline infographic diagram. Download this PowerPoint timeline template to make impressive presentations.
