Financial Graphs

Customer Relationship Management And Daily Payments Dashboard With Top Reviews Professional PDF
This slide illustrates graphical representation of customer relationship management figures. It includes revenue, daily payments graph and top products etc. Showcasing this set of slides titled Customer Relationship Management And Daily Payments Dashboard With Top Reviews Professional PDF. The topics addressed in these templates are Quality Product, Services, Revenue. All the content presented in this PPT design is completely editable. Download it and make adjustments in color, background, font etc. as per your unique business setting.
Cash Performance Highlights With Turnover Rate Ppt Ideas Icon PDF
This graph or chart is linked to excel, and changes automatically based on data. Just left click on it and select Edit Data. Pitch your topic with ease and precision using this Cash Performance Highlights With Turnover Rate Ppt Ideas Icon PDF. This layout presents information on Working Capital, Cash Balance, Current Ratio. It is also available for immediate download and adjustment. So, changes can be made in the color, design, graphics or any other component to create a unique layout.
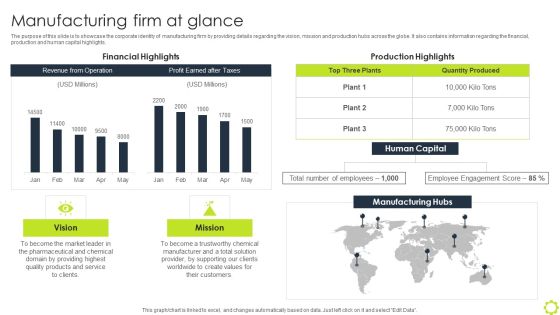
Machine Repairing And Servicing Manufacturing Firm At Glance Ppt Professional Graphics Example PDF
The purpose of this slide is to showcase the corporate identity of manufacturing firm by providing details regarding the vision, mission and production hubs across the globe. It also contains information regarding the financial, production and human capital highlights. Crafting an eye-catching presentation has never been more straightforward. Let your presentation shine with this tasteful yet straightforward Machine Repairing And Servicing Manufacturing Firm At Glance Ppt Professional Graphics Example PDF template. It offers a minimalistic and classy look that is great for making a statement. The colors have been employed intelligently to add a bit of playfulness while still remaining professional. Construct the ideal Machine Repairing And Servicing Manufacturing Firm At Glance Ppt Professional Graphics Example PDF that effortlessly grabs the attention of your audience Begin now and be certain to wow your customers.
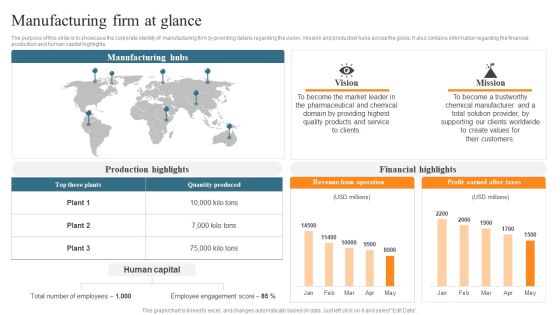
Leveraging Predictive Maintenance To Enhance Production Process Manufacturing Firm At Glance Elements PDF
The purpose of this slide is to showcase the corporate identity of manufacturing firm by providing details regarding the vision, mission and production hubs across the globe. It also contains information regarding the financial, production and human capital highlights. If you are looking for a format to display your unique thoughts, then the professionally designed Leveraging Predictive Maintenance To Enhance Production Process Manufacturing Firm At Glance Elements PDF is the one for you. You can use it as a Google Slides template or a PowerPoint template. Incorporate impressive visuals, symbols, images, and other charts. Modify or reorganize the text boxes as you desire. Experiment with shade schemes and font pairings. Alter, share or cooperate with other people on your work. Download Leveraging Predictive Maintenance To Enhance Production Process Manufacturing Firm At Glance Elements PDF and find out how to give a successful presentation. Present a perfect display to your team and make your presentation unforgettable.

Customer Acquisition Approaches To Enhance Organization Growth Average Customer Acquisition Cost By Industry Elements PDF
This slide covers a graphical representation of client acquisition costs incurred by various industries such as travel, retail, consumer goods, manufacturing, transportation, marketing agency, financial, real estate, banking, telecom, and technology hardware and software. Are you in need of a template that can accommodate all of your creative concepts This one is crafted professionally and can be altered to fit any style. Use it with Google Slides or PowerPoint. Include striking photographs, symbols, depictions, and other visuals. Fill, move around, or remove text boxes as desired. Test out color palettes and font mixtures. Edit and save your work, or work with colleagues. Download Customer Acquisition Approaches To Enhance Organization Growth Average Customer Acquisition Cost By Industry Elements PDF and observe how to make your presentation outstanding. Give an impeccable presentation to your group and make your presentation unforgettable.

Strategic Management Dashboard With Strategy Assessment Tactics To Gain Sustainable Competitive Edge Pictures PDF
This slide showcases strategic management dashboard with technique assessment. It provides details about financial, customer, process, efficiency strategy, customer behavior, customer loyalty, customer feedbacks, marketing, suppliers, etc. Formulating a presentation can take up a lot of effort and time, so the content and message should always be the primary focus. The visuals of the PowerPoint can enhance the presenters message, so our Strategic Management Dashboard With Strategy Assessment Tactics To Gain Sustainable Competitive Edge Pictures PDF was created to help save time. Instead of worrying about the design, the presenter can concentrate on the message while our designers work on creating the ideal templates for whatever situation is needed. Slidegeeks has experts for everything from amazing designs to valuable content, we have put everything into Strategic Management Dashboard With Strategy Assessment Tactics To Gain Sustainable Competitive Edge Pictures PDF.

Average Customer Acquisition Cost By Industry Strategies For Acquiring Consumers Elements PDF
This slide covers a graphical representation of client acquisition costs incurred by various industries such as travel, retail, consumer goods, manufacturing, transportation, marketing agency, financial, real estate, banking, telecom, and technology hardware and software. This Average Customer Acquisition Cost By Industry Strategies For Acquiring Consumers Elements PDF is perfect for any presentation, be it in front of clients or colleagues. It is a versatile and stylish solution for organizing your meetings. The Average Customer Acquisition Cost By Industry Strategies For Acquiring Consumers Elements PDF features a modern design for your presentation meetings. The adjustable and customizable slides provide unlimited possibilities for acing up your presentation. Slidegeeks has done all the homework before launching the product for you. So, do not wait, grab the presentation templates today

Comprehensive Guide To Acquire Customers Average Customer Acquisition Cost By Industry Clipart PDF
This slide covers a graphical representation of client acquisition costs incurred by various industries such as travel, retail, consumer goods, manufacturing, transportation, marketing agency, financial, real estate, banking, telecom, and technology hardware and software.Get a simple yet stunning designed Comprehensive Guide To Acquire Customers Average Customer Acquisition Cost By Industry Clipart PDF. It is the best one to establish the tone in your meetings. It is an excellent way to make your presentations highly effective. So, download this PPT today from Slidegeeks and see the positive impacts. Our easy-to-edit Comprehensive Guide To Acquire Customers Average Customer Acquisition Cost By Industry Clipart PDF can be your go-to option for all upcoming conferences and meetings. So, what are you waiting for Grab this template today.
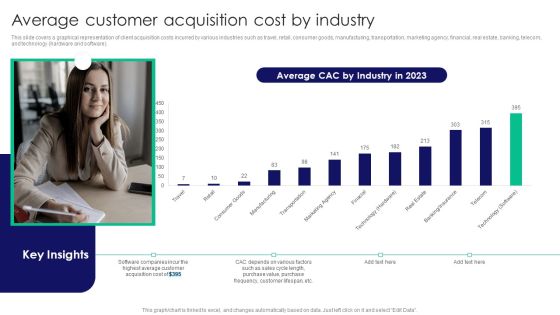
Guide To Business Customer Acquisition Average Customer Acquisition Cost By Industry Clipart PDF
This slide covers a graphical representation of client acquisition costs incurred by various industries such as travel, retail, consumer goods, manufacturing, transportation, marketing agency, financial, real estate, banking, telecom, and technology hardware and software. Are you in need of a template that can accommodate all of your creative concepts. This one is crafted professionally and can be altered to fit any style. Use it with Google Slides or PowerPoint. Include striking photographs, symbols, depictions, and other visuals. Fill, move around, or remove text boxes as desired. Test out color palettes and font mixtures. Edit and save your work, or work with colleagues. Download Guide To Business Customer Acquisition Average Customer Acquisition Cost By Industry Clipart PDF and observe how to make your presentation outstanding. Give an impeccable presentation to your group and make your presentation unforgettable.

Strategic Management Dashboard With Strategy Assessment Sample PDF
This slide showcases strategic management dashboard with technique assessment. It provides details about financial, customer, process, efficiency strategy, customer behavior, customer loyalty, customer feedbacks, marketing, suppliers, etc. Do you have to make sure that everyone on your team knows about any specific topic I yes, then you should give Strategic Management Dashboard With Strategy Assessment Sample PDF a try. Our experts have put a lot of knowledge and effort into creating this impeccable Strategic Management Dashboard With Strategy Assessment Sample PDF. You can use this template for your upcoming presentations, as the slides are perfect to represent even the tiniest detail. You can download these templates from the Slidegeeks website and these are easy to edit. So grab these today.

Strategic Management Dashboard With Strategy Assessment Strategic Management For Competitive Portrait PDF
This slide showcases strategic management dashboard with technique assessment. It provides details about financial, customer, process, efficiency strategy, customer behavior, customer loyalty, customer feedbacks, marketing, suppliers, etc. Do you know about Slidesgeeks Strategic Management Dashboard With Strategy Assessment Strategic Management For Competitive Portrait PDF These are perfect for delivering any kind od presentation. Using it, create PowerPoint presentations that communicate your ideas and engage audiences. Save time and effort by using our pre-designed presentation templates that are perfect for a wide range of topic. Our vast selection of designs covers a range of styles, from creative to business, and are all highly customizable and easy to edit. Download as a PowerPoint template or use them as Google Slides themes.
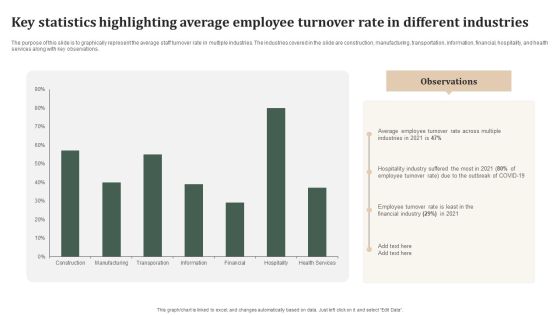
Key Statistics Highlighting Average Employee Turnover Rate In Different Industries Template PDF
The purpose of this slide is to graphically represent the average staff turnover rate in multiple industries. The industries covered in the slide are construction, manufacturing, transportation, information, financial, hospitality, and health services along with key observations. Here you can discover an assortment of the finest PowerPoint and Google Slides templates. With these templates, you can create presentations for a variety of purposes while simultaneously providing your audience with an eye catching visual experience. Download Key Statistics Highlighting Average Employee Turnover Rate In Different Industries Template PDF to deliver an impeccable presentation. These templates will make your job of preparing presentations much quicker, yet still, maintain a high level of quality. Slidegeeks has experienced researchers who prepare these templates and write high quality content for you. Later on, you can personalize the content by editing the Key Statistics Highlighting Average Employee Turnover Rate In Different Industries Template PDF.

Effective Strategies For Retaining Healthcare Staff Key Statistics Highlighting Average Employee Turnover Rate Brochure PDF
The purpose of this slide is to graphically represent the average staff turnover rate in multiple industries. The industries covered in the slide are construction, manufacturing, transportation, information, financial, hospitality, and health services along with key observations. Want to ace your presentation in front of a live audience Our Effective Strategies For Retaining Healthcare Staff Key Statistics Highlighting Average Employee Turnover Rate Brochure PDF can help you do that by engaging all the users towards you. Slidegeeks experts have put their efforts and expertise into creating these impeccable powerpoint presentations so that you can communicate your ideas clearly. Moreover, all the templates are customizable, and easy to edit and downloadable. Use these for both personal and commercial use.

Staff Retention Techniques To Minimize Hiring Expenses Key Statistics Highlighting Average Employee Turnover Clipart PDF
The purpose of this slide is to graphically represent the average staff turnover rate in multiple industries. The industries covered in the slide are construction, manufacturing, transportation, information, financial, hospitality, and health services along with key observations. Want to ace your presentation in front of a live audience Our Staff Retention Techniques To Minimize Hiring Expenses Key Statistics Highlighting Average Employee Turnover Clipart PDF can help you do that by engaging all the users towards you. Slidegeeks experts have put their efforts and expertise into creating these impeccable powerpoint presentations so that you can communicate your ideas clearly. Moreover, all the templates are customizable, and easy to edit and downloadable. Use these for both personal and commercial use.
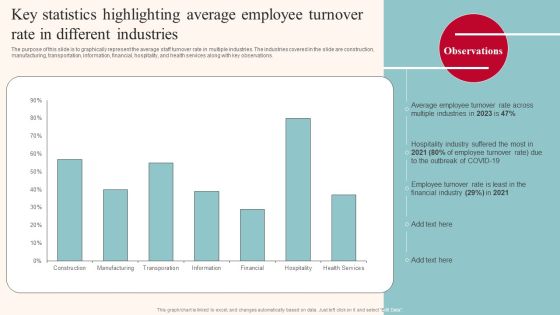
Key Statistics Highlighting Average Employee Turnover Rate In Different Industries Infographics PDF
The purpose of this slide is to graphically represent the average staff turnover rate in multiple industries. The industries covered in the slide are construction, manufacturing, transportation, information, financial, hospitality, and health services along with key observations. Want to ace your presentation in front of a live audience Our Key Statistics Highlighting Average Employee Turnover Rate In Different Industries Infographics PDF can help you do that by engaging all the users towards you. Slidegeeks experts have put their efforts and expertise into creating these impeccable powerpoint presentations so that you can communicate your ideas clearly. Moreover, all the templates are customizable, and easy to edit and downloadable. Use these for both personal and commercial use.

Assessing Synergies Pandl Trend Analysis Ppt PowerPoint Presentation Show Ideas PDF
The graph shows the increasing trend of relationship between revenue ,cost and net income in a specific year. Deliver an awe-inspiring pitch with this creative assessing synergies pandl trend analysis ppt powerpoint presentation show ideas pdf bundle. Topics like net margin, 2016 to 2020, net income can be discussed with this completely editable template. It is available for immediate download depending on the needs and requirements of the user.

Business Synergies P And L Trend Analysis Ppt Gallery Themes PDF
The graph shows the increasing trend of relationship between revenue, cost and net income in a specific year. Deliver an awe-inspiring pitch with this creative business synergies p and l trend analysis ppt gallery themes pdf bundle. Topics like p and l trend analysis can be discussed with this completely editable template. It is available for immediate download depending on the needs and requirements of the user.
Need Of Introducing B2B Sales Strategies In Our Company Costly Ppt Icon Images PDF
This graph depicts the factors resulting from poor sales and marketing alignment which leads to introduce B2B sales strategies within the organizations.Deliver and pitch your topic in the best possible manner with this need of introducing B2B sales strategies in our company costly ppt icon images pdf. Use them to share invaluable insights on loss of revenues, wasted budget, loss of qualified leads and impress your audience. This template can be altered and modified as per your expectations. So, grab it now.

P And L Trend Analysis Mergers And Acquisitions Synergy Ppt Styles Slide Download PDF
The graph shows the increasing trend of relationship between revenue ,cost and net income in a specific year. Deliver and pitch your topic in the best possible manner with this p and l trend analysis mergers and acquisitions synergy ppt styles slide download pdf. Use them to share invaluable insights on p and l trend analysis and impress your audience. This template can be altered and modified as per your expectations. So, grab it now.

Need Of Introducing B2b Sales Strategies In Our Company Budget Ppt Pictures Vector PDF
This graph depicts the factors resulting from poor sales and marketing alignment which leads to introduce B2B sales strategies within the organizations. Deliver an awe-inspiring pitch with this creative need of introducing b2b sales strategies in our company budget ppt pictures vector pdf. bundle. Topics like loss of qualified leads, wasted budget, customer churn, loss of revenues can be discussed with this completely editable template. It is available for immediate download depending on the needs and requirements of the user.

Business Model Opening Restaurant Coffee Shop Break Even Analysis Demonstration PDF
This slide shows the coffee shop break-even analysis which includes the graph and description. Deliver and pitch your topic in the best possible manner with this business model opening restaurant coffee shop break even analysis demonstration pdf. Use them to share invaluable insights on revenue, variable cost, break even analysis and impress your audience. This template can be altered and modified as per your expectations. So, grab it now.

Improving Organizational Process Client Induction Procedure High Customer Churn Rate Brochure PDF
This slide provides the graph of companys customer churn rate for last five years 2017-2021 along with the key reasons behind the high customer churn rate Deliver an awe inspiring pitch with this creative improving organizational process client induction procedure high customer churn rate brochure pdf bundle. Topics like insufficient training, customer churn rate, revenue can be discussed with this completely editable template. It is available for immediate download depending on the needs and requirements of the user.

Monthly Company Performance Analysiscompetitor Analysis Pictures PDF
This graph or chart is linked to excel, and changes automatically based on data. Just left click on it and select Edit Data. Deliver and pitch your topic in the best possible manner with this monthly company performance analysiscompetitor analysis pictures pdf. Use them to share invaluable insights on revenue, competitor analysis and impress your audience. This template can be altered and modified as per your expectations. So, grab it now.
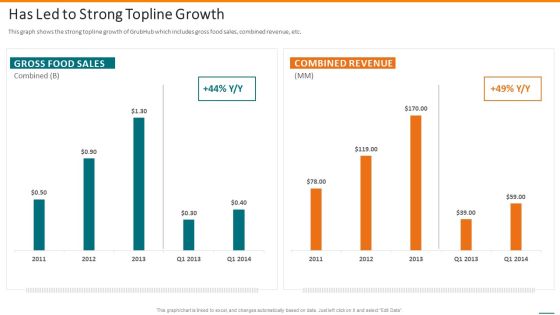
Grubhub Fund Raising Elevator Has Led To Strong Topline Growth Professional PDF
This graph shows the strong topline growth of GrubHub which includes gross food sales, combined revenue, etc. Deliver an awe inspiring pitch with this creative grubhub fund raising elevator has led to strong topline growth professional pdf bundle. Topics like has led to strong topline growth can be discussed with this completely editable template. It is available for immediate download depending on the needs and requirements of the user.
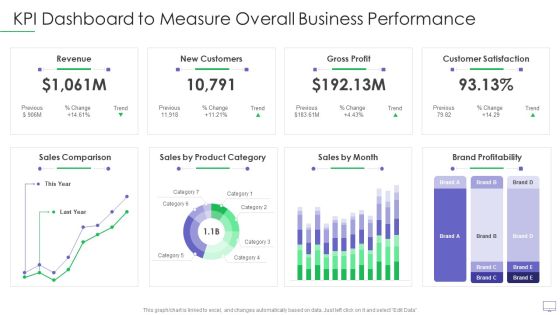
Guide For Software Developers KPI Dashboard To Measure Overall Business Performance Elements PDF
This graph or chart is linked to excel, and changes automatically based on data. Just left click on it and select Edit Data. Deliver an awe inspiring pitch with this creative guide for software developers kpi dashboard to measure overall business performance elements pdf bundle. Topics like revenue new customers, gross profit, customer satisfaction, sales comparison, brand profitability can be discussed with this completely editable template. It is available for immediate download depending on the needs and requirements of the user.
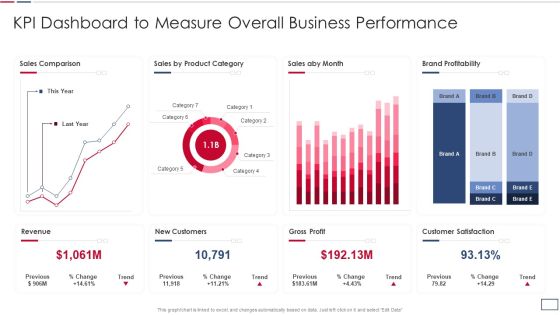
Software Developer Playbook Kpi Dashboard To Measure Overall Business Performance Topics PDF
This graph or chart is linked to excel, and changes automatically based on data. Just left click on it and select Edit Data. Deliver and pitch your topic in the best possible manner with this software developer playbook kpi dashboard to measure overall business performance topics pdf. Use them to share invaluable insights on revenue new customers, gross profit, customer satisfaction, sales comparison and impress your audience. This template can be altered and modified as per your expectations. So, grab it now.
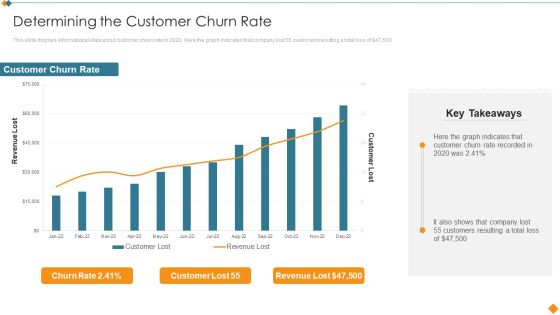
Maintaining Partner Relationships Determining The Customer Churn Rate Portrait PDF
This slide displays informational stats about customer churn rate in 2020. Here the graph indicates that company lost 55 customers resulting a total loss of dollar 47,500. Deliver and pitch your topic in the best possible manner with this Maintaining Partner Relationships Determining The Customer Churn Rate Portrait PDF. Use them to share invaluable insights on Customer Churn Rate, Revenue Lost and impress your audience. This template can be altered and modified as per your expectations. So, grab it now.

Auto Sales Scorecard For Petrol Vs Diesel Vehicles Template PDF
This graph or chart is linked to excel, and changes automatically based on data. Just left click on it and select Edit Data. Deliver an awe inspiring pitch with this creative Auto Sales Scorecard For Petrol Vs Diesel Vehicles Template PDF bundle. Topics like Top Products Revenue, Petrol Vs Diesel, Vehicles Incremental Sales, Marketing Activities Product can be discussed with this completely editable template. It is available for immediate download depending on the needs and requirements of the user.

Automobile Sales Scorecard With Unit Sold And Average Price Statistics Formats PDF
This graph or chart is linked to excel, and changes automatically based on data. Just left click on it and select Edit Data. Deliver an awe inspiring pitch with this creative Automobile Sales Scorecard With Unit Sold And Average Price Statistics Formats PDF bundle. Topics like Automobile Sales Scorecard, Unit Sold Revenue, Average Price Statistics can be discussed with this completely editable template. It is available for immediate download depending on the needs and requirements of the user.

IT Security Evaluation Scorecard With It Cost Break Down Ppt Infographics Slideshow PDF
This graph or chart is linked to excel, and changes automatically based on data. Just left click on it and select Edit Data. Deliver an awe inspiring pitch with this creative IT Security Evaluation Scorecard With It Cost Break Down Ppt Infographics Slideshow PDF bundle. Topics like Spend Vs Budget, Return On Investment, IT Department Revenue, IT Costs Vs can be discussed with this completely editable template. It is available for immediate download depending on the needs and requirements of the user.
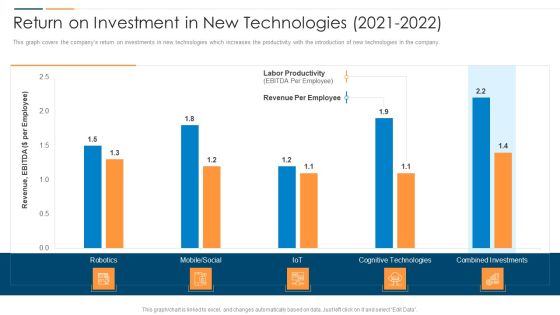
Revolution In Online Business Return On Investment In New Technologies 2021 To 2022 Download PDF
This graph covers the companys return on investments in new technologies which increases the productivity with the introduction of new technologies in the company. Deliver an awe inspiring pitch with this creative Revolution In Online Business Return On Investment In New Technologies 2021 To 2022 Download PDF bundle. Topics like Revenue PER Employee, Labour Productivity Mobile, Ebitda PER Employee can be discussed with this completely editable template. It is available for immediate download depending on the needs and requirements of the user.

Accelerate Online Journey Now Return On Investment In New Technologies 2021 To 2022 Microsoft PDF
This graph covers the companys return on investments in new technologies which increases the productivity with the introduction of new technologies in the company. Deliver an awe inspiring pitch with this creative Accelerate Online Journey Now Return On Investment In New Technologies 2021 To 2022 Microsoft PDF bundle. Topics like Revenue Per Employee, Labor Productivity, Per Employee can be discussed with this completely editable template. It is available for immediate download depending on the needs and requirements of the user.

Company Yearly Sales Performance Scorecard With Cost Breakdown Elements PDF
This graph or chart is linked to excel, and changes automatically based on data. Just left click on it and select Edit Data. Deliver an awe inspiring pitch with this creative Company Yearly Sales Performance Scorecard With Cost Breakdown Elements PDF bundle. Topics like Sales Revenue, Incremental Sales, Cost Breakdown can be discussed with this completely editable template. It is available for immediate download depending on the needs and requirements of the user.

Organization Reinvention Return On Investment In New Technologies 2021 To 2022 Rules PDF
This graph covers the companys return on investments in new technologies which increases the productivity with the introduction of new technologies in the company. Deliver and pitch your topic in the best possible manner with this Organization Reinvention Return On Investment In New Technologies 2021 To 2022 Rules PDF. Use them to share invaluable insights on Revenue Per Employee, Labor Productivity and impress your audience. This template can be altered and modified as per your expectations. So, grab it now.

Monthly Resource Administration Accounting Scorecard Template PDF
This graph or chart is linked to excel, and changes automatically based on data. Just left click on it and select Edit Data. Deliver and pitch your topic in the best possible manner with this Monthly Resource Administration Accounting Scorecard Template PDF. Use them to share invaluable insights on Revenue Vs Costs, Total Profit, Number Units Sold and impress your audience. This template can be altered and modified as per your expectations. So, grab it now.
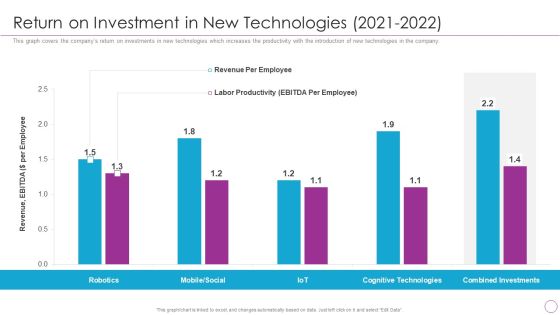
Integration Of Digital Technology In Organization Return On Investment In New Technologies 2021 To 2022 Formats PDF
This graph covers the companys return on investments in new technologies which increases the productivity with the introduction of new technologies in the company. Deliver an awe inspiring pitch with this creative Integration Of Digital Technology In Organization Return On Investment In New Technologies 2021 To 2022 Formats PDF bundle. Topics like Revenue Employee, Labour Productivity, Cognitive Technologies can be discussed with this completely editable template. It is available for immediate download depending on the needs and requirements of the user.

Client Helpline Dashboard Average Time To Solve Issue Ppt Portfolio Visuals PDF
This graph or chart is linked to excel, and changes automatically based on data. Just left click on it and select Edit Data. Showcasing this set of slides titled Client Helpline Dashboard Average Time To Solve Issue Ppt Portfolio Visuals PDF. The topics addressed in these templates are Cost Per Support, Customer Satisfaction, Costs To Revenue. All the content presented in this PPT design is completely editable. Download it and make adjustments in color, background, font etc. as per your unique business setting.

Organization Transition Return On Investment In New Technologies 2021 To 2022 Themes PDF
This graph covers the companys return on investments in new technologies which increases the productivity with the introduction of new technologies in the company. Deliver an awe inspiring pitch with this creative Organization Transition Return On Investment In New Technologies 2021 To 2022 Themes PDF bundle. Topics like Revenue per Employee, Labour Productivity, IOT can be discussed with this completely editable template. It is available for immediate download depending on the needs and requirements of the user.
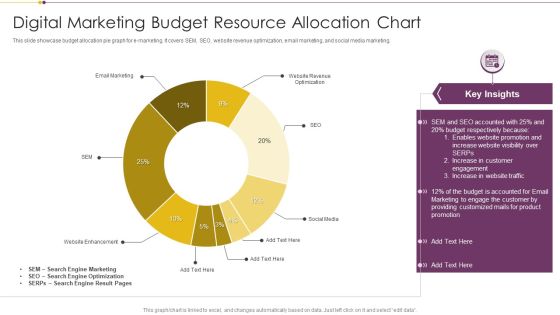
Digital Marketing Budget Resource Allocation Chart Download PDF
This slide showcase budget allocation pie graph for e marketing. It covers SEM, SEO, website revenue optimization, email marketing, and social media marketing. Pitch your topic with ease and precision using this Digital Marketing Budget Resource Allocation Chart Download PDF. This layout presents information on Search Engine Marketing, Search Engine Optimization, Budget. It is also available for immediate download and adjustment. So, changes can be made in the color, design, graphics or any other component to create a unique layout.
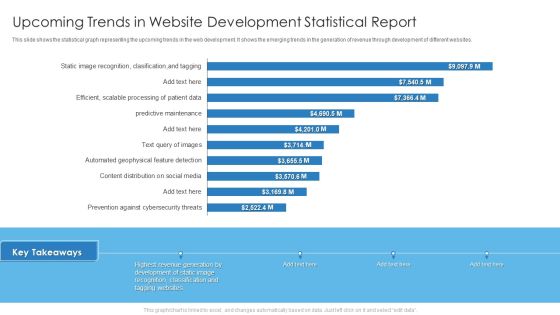
Upcoming Trends In Website Development Statistical Report Information PDF
This slide shows the statistical graph representing the upcoming trends in the web development. It shows the emerging trends in the generation of revenue through development of different websites. Deliver an awe inspiring pitch with this creative Upcoming Trends In Website Development Statistical Report Information PDF bundle. Topics like Upcoming Trends In Website, Development Statistical Report can be discussed with this completely editable template. It is available for immediate download depending on the needs and requirements of the user.

Customer Relationship Management Dashboard With Sales And Profit Summary Microsoft PDF
This slide illustrates graphical representation of sales and profit figures. It includes sales summary, revenue vs. expenditure graph and ticket record etc. Showcasing this set of slides titled Customer Relationship Management Dashboard With Sales And Profit Summary Microsoft PDF. The topics addressed in these templates are Product Catalogue, Sales, Profit. All the content presented in this PPT design is completely editable. Download it and make adjustments in color, background, font etc. as per your unique business setting.

Advisory Company Pitch Deck Market Size Of Consulting Industry Ppt Portfolio Pictures PDF
This slide provides the glimpse about the market trends of consulting industry which focuses on size of global industry such as operations, financials, HR, technology, market size, etc. Deliver and pitch your topic in the best possible manner with this advisory company pitch deck market size of consulting industry ppt portfolio pictures pdf. Use them to share invaluable insights on financials, technology, global, growth and impress your audience. This template can be altered and modified as per your expectations. So, grab it now.
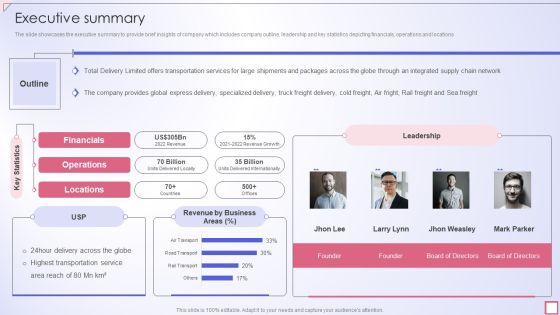
Freight Shipping Company Profile Executive Summary Information PDF
The slide showcases the executive summary to provide brief insights of company which includes company outline, leadership and key statistics depicting financials, operations and locations.Deliver an awe inspiring pitch with this creative Freight Shipping Company Profile Executive Summary Information PDF bundle. Topics like Financials, Operations, Locations can be discussed with this completely editable template. It is available for immediate download depending on the needs and requirements of the user.

Investor Pitch Deck To Generate Capital From Initial Currency Offering Market Potential And Opportunity Size For The Company Background PDF
The slide provides the comparison graph of market size of online money transfer remittances mobile payment market. It covers the historical 2016 to 2021 as well as forecasted 2020 to 2027 data.Deliver an awe-inspiring pitch with this creative investor pitch deck to generate capital from initial currency offering market potential and opportunity size for the company background pdf bundle. Topics like market potential and opportunity size for the company can be discussed with this completely editable template. It is available for immediate download depending on the needs and requirements of the user.
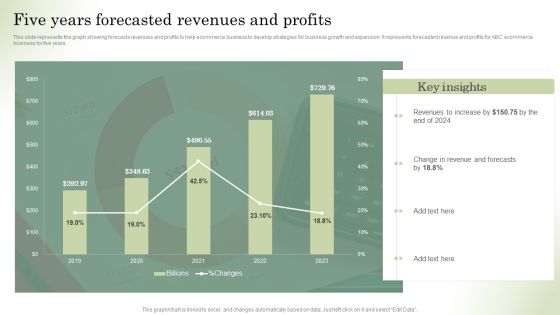
Optimizing Online Stores Five Years Forecasted Revenues And Profits Ideas PDF
This slide represents the graph showing forecasts revenues and profits to help ecommerce business to develop strategies for business growth and expansion. It represents forecasted revenue and profits for ABC ecommerce business for five years. Make sure to capture your audiences attention in your business displays with our gratis customizable Optimizing Online Stores Five Years Forecasted Revenues And Profits Ideas PDF. These are great for business strategies, office conferences, capital raising or task suggestions. If you desire to acquire more customers for your tech business and ensure they stay satisfied, create your own sales presentation with these plain slides.

Implementing An Effective Ecommerce Management Framework Five Years Forecasted Revenues And Profits Ideas PDF
This slide represents the graph showing forecasts revenues and profits to help ecommerce business to develop strategies for business growth and expansion. It represents forecasted revenue and profits for ABC ecommerce business for five years. Make sure to capture your audiences attention in your business displays with our gratis customizable Implementing An Effective Ecommerce Management Framework Five Years Forecasted Revenues And Profits Ideas PDF. These are great for business strategies, office conferences, capital raising or task suggestions. If you desire to acquire more customers for your tech business and ensure they stay satisfied, create your own sales presentation with these plain slides.
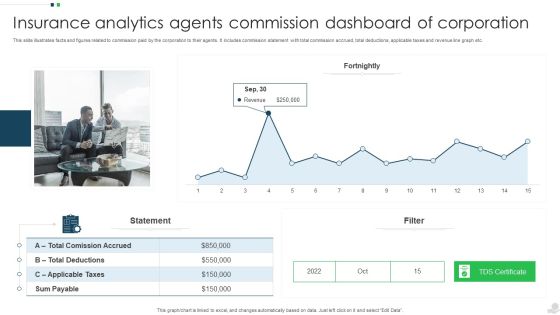
Insurance Analytics Agents Commission Dashboard Of Corporation Introduction PDF
This slide illustrates facts and figures related to commission paid by the corporation to their agents. It includes commission statement with total commission accrued, total deductions, applicable taxes and revenue line graph etc. Pitch your topic with ease and precision using this Insurance Analytics Agents Commission Dashboard Of Corporation Introduction PDF. This layout presents information on Applicable Taxes, Sum Payable, Revenue. It is also available for immediate download and adjustment. So, changes can be made in the color, design, graphics or any other component to create a unique layout.
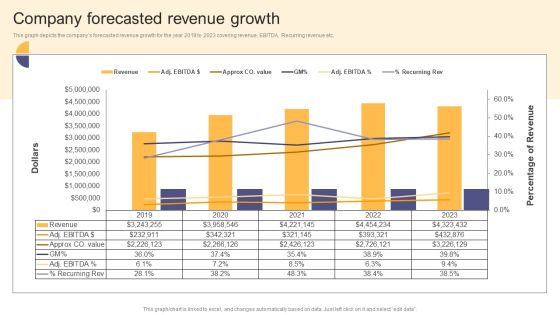
Per Device Pricing Strategy For Managed Solutions Company Forecasted Revenue Growth Themes PDF
This graph depicts the companys forecasted revenue growth for the year 2019 to 2023 covering revenue, EBITDA, Recurring revenue etc. Get a simple yet stunning designed Per Device Pricing Strategy For Managed Solutions Company Forecasted Revenue Growth Themes PDF. It is the best one to establish the tone in your meetings. It is an excellent way to make your presentations highly effective. So, download this PPT today from Slidegeeks and see the positive impacts. Our easy to edit Per Device Pricing Strategy For Managed Solutions Company Forecasted Revenue Growth Themes PDF can be your go to option for all upcoming conferences and meetings. So, what are you waiting for Grab this template today.

Employee Recognition Award Companys Revenue Per Employee Rpe Ppt PowerPoint Presentation Professional Influencers PDF
The purpose of this slide is to provide a graph wherein revenue per employee is calculated by dividing a companys revenue by its total number of employees leading to low productivity in the organization. Deliver and pitch your topic in the best possible manner with this employee recognition award companys revenue per employee rpe ppt powerpoint presentation professional influencers pdf. Use them to share invaluable insights on revenue per employee, employee, 2014 to 2019 and impress your audience. This template can be altered and modified as per your expectations. So, grab it now.
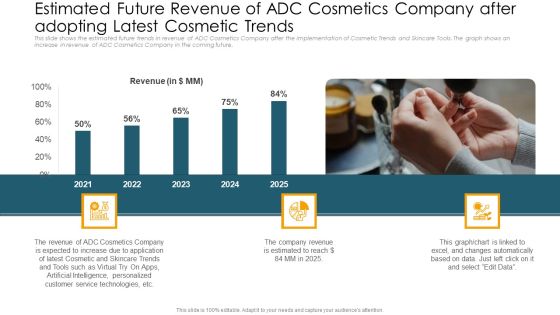
Estimated Future Revenue Of ADC Cosmetics Company After Adopting Latest Cosmetic Trends Portrait PDF
This slide shows the estimated future trends in revenue of ADC Cosmetics Company after the implementation of Cosmetic Trends and Skincare Tools. The graph shows an increase in revenue of ADC Cosmetics Company in the coming future. Deliver an awe-inspiring pitch with this creative estimated future revenue of adc cosmetics company after adopting latest cosmetic trends portrait pdf. bundle. Topics like revenue, 2021 to 2025 can be discussed with this completely editable template. It is available for immediate download depending on the needs and requirements of the user.

Decline In Sales Revenue Of CNN E Commerce Company Globally Elements PDF
This slide shows a graph of declining Revenue of CNN E Commerce Company for past 5 years. Additionally, this slide provides additional information on some reasons lack of proactive growth efforts, bad user experience, lack of mobile application etc. of decline in overall company revenue from 2017 to 2021. Deliver and pitch your topic in the best possible manner with this decline in sales revenue of CNN e commerce company globally elements pdf. Use them to share invaluable insights on revenue, 2017 to 2021 and impress your audience. This template can be altered and modified as per your expectations. So, grab it now.

Estimated Future Revenue Of ADC Cosmetics Company After Adopting Latest Cosmetic Trends Infographics PDF
This slide shows the estimated future trends in revenue of ADC Cosmetics Company after the implementation of Cosmetic Trends and Skincare Tools. The graph shows an increase in revenue of ADC Cosmetics Company in the coming future. Deliver an awe-inspiring pitch with this creative estimated future revenue of adc cosmetics company after adopting latest cosmetic trends infographics pdf bundle. Topics like estimated future revenue of adc cosmetics company after adopting latest cosmetic trends can be discussed with this completely editable template. It is available for immediate download depending on the needs and requirements of the user.

Estimated Future Revenue Of ADC Cosmetics Company After Adopting Latest Cosmetic Trends Download PDF
This slide shows the estimated future trends in revenue of ADC Cosmetics Company after the implementation of Cosmetic Trends and Skincare Tools. The graph shows an increase in revenue of ADC Cosmetics Company in the coming future. Deliver and pitch your topic in the best possible manner with this estimated future revenue of adc cosmetics company after adopting latest cosmetic trends download pdf. Use them to share invaluable insights on estimated future revenue of adc cosmetics company after adopting latest cosmetic trends and impress your audience. This template can be altered and modified as per your expectations. So, grab it now.
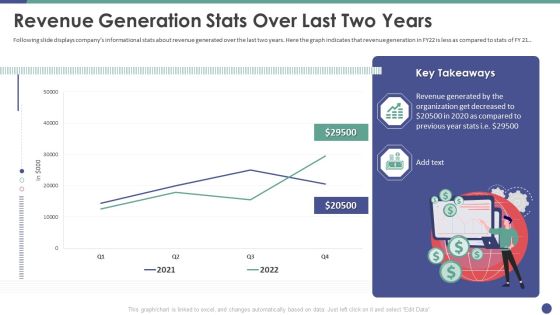
QC Engineering Revenue Generation Stats Over Last Two Years Ppt Portfolio Graphics Tutorials PDF
Following slide displays companys informational stats about revenue generated over the last two years. Here the graph indicates that revenue generation in FY22 is less as compared to stats of FY21. Deliver an awe inspiring pitch with this creative qc engineering revenue generation stats over last two years ppt portfolio graphics tutorials pdf bundle. Topics like revenue generation stats over last two years can be discussed with this completely editable template. It is available for immediate download depending on the needs and requirements of the user.

Estimated Future Revenue Of ADC Cosmetics Company After Adopting Latest Cosmetic Trends Designs PDF
This slide shows the estimated future trends in revenue of ADC Cosmetics Company after the implementation of Cosmetic Trends and Skincare Tools. The graph shows an increase in revenue of ADC Cosmetics Company in the coming future. Deliver and pitch your topic in the best possible manner with this estimated future revenue of adc cosmetics company after adopting latest cosmetic trends designs pdf. Use them to share invaluable insights on customer service, company revenue, artificial intelligence and impress your audience. This template can be altered and modified as per your expectations. So, grab it now.

Decline In Sales Revenue Of CNN E Commerce Company Globally Summary PDF
This slide shows a graph of declining Revenue of CNN E-Commerce Company for past 5 years. Additionally, this slide provides additional information on some reasons lack of proactive growth efforts, bad user experience, lack of mobile application etc. of decline in overall company revenue from 2017 to 2021. Deliver and pitch your topic in the best possible manner with this decline in sales revenue of CNN e commerce company globally summary pdf. Use them to share invaluable insights on revenue, 2017 to 2021 and impress your audience. This template can be altered and modified as per your expectations. So, grab it now.

Digital Marketing Agency Business Profile Revenue And Net Profit Diagrams PDF
This slide highlights the revenue and net profit of digital marketing agency through bar graph and tabular format. It covers three years data of revenue, gross margin and net profit. Deliver and pitch your topic in the best possible manner with this Digital Marketing Agency Business Profile Revenue And Net Profit Diagrams PDF. Use them to share invaluable insights on Increase In Revenue, Growth Rate, Net Profit and impress your audience. This template can be altered and modified as per your expectations. So, grab it now.

Security Officer Service Company Profile Revenue And Net Profit Ppt PowerPoint Presentation Gallery Graphic Images PDF
This slide highlights the revenue and net profit of security guard company through bar graph and tabular format. It covers three years data of revenue, and net profit. Deliver an awe inspiring pitch with this creative Security Officer Service Company Profile Revenue And Net Profit Ppt PowerPoint Presentation Gallery Graphic Images PDF bundle. Topics like Net Profit, Increase Revenue, 2018 To 2022 can be discussed with this completely editable template. It is available for immediate download depending on the needs and requirements of the user.

Competition Estimated Future Revenue Of ADC Cosmetics Company After Adopting Latest Cosmetic Trends Topics PDF
This slide shows the estimated future trends in revenue of ADC Cosmetics Company after the implementation of Cosmetic Trends and Skincare Tools. The graph shows an increase in revenue of ADC Cosmetics Company in the coming future. Deliver an awe inspiring pitch with this creative competition estimated future revenue of adc cosmetics company after adopting latest cosmetic trends topics pdf bundle. Topics like artificial intelligence, personalized customer service technologies, company is expected to increase can be discussed with this completely editable template. It is available for immediate download depending on the needs and requirements of the user.
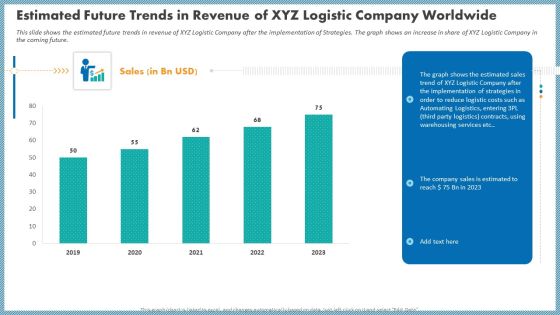
Estimated Future Trends In Revenue Of XYZ Logistic Company Worldwide Background PDF
This slide shows the estimated future trends in revenue of XYZ Logistic Company after the implementation of Strategies. The graph shows an increase in share of XYZ Logistic Company in the coming future. Deliver and pitch your topic in the best possible manner with this estimated future trends in revenue of xyz logistic company worldwide background pdf. Use them to share invaluable insights on estimated future trends in revenue of xyz logistic company worldwide and impress your audience. This template can be altered and modified as per your expectations. So, grab it now.
 Home
Home