Financial Graphs
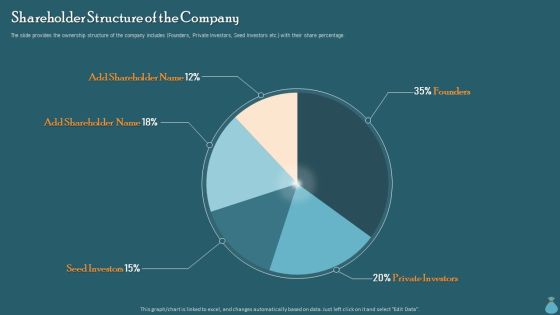
Financial Data Revelation To Varied Stakeholders Shareholder Structure Of The Company Microsoft PDF
The slide provides the ownership structure of the company includes Founders, Private Investors, Seed Investors etc. with their share percentage. Slidegeeks is here to make your presentations a breeze with Financial Data Revelation To Varied Stakeholders Shareholder Structure Of The Company Microsoft PDF With our easy to use and customizable templates, you can focus on delivering your ideas rather than worrying about formatting. With a variety of designs to choose from, you are sure to find one that suits your needs. And with animations and unique photos, illustrations, and fonts, you can make your presentation pop. So whether you are giving a sales pitch or presenting to the board, make sure to check out Slidegeeks first.
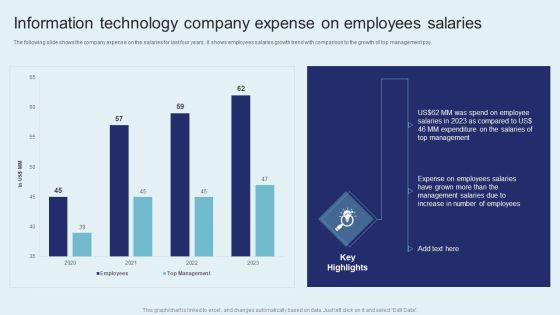
IT Firm Financial Statement Information Technology Company Expense On Employees Salaries Demonstration PDF
The following slide shows the company expense on the salaries for last four years. It shows employees salaries growth trend with comparison to the growth of top management pay. Slidegeeks is one of the best resources for PowerPoint templates. You can download easily and regulate IT Firm Financial Statement Information Technology Company Expense On Employees Salaries Demonstration PDF for your personal presentations from our wonderful collection. A few clicks is all it takes to discover and get the most relevant and appropriate templates. Use our Templates to add a unique zing and appeal to your presentation and meetings. All the slides are easy to edit and you can use them even for advertisement purposes.

Effective Financial Planning Assessment Techniques Leverage Ratios To Measure The Debt Level Sample PDF
The following slide outlines top 2 leverage ratios which will assist the in determining the debt level incurred by the organization. This slide provides information about debt to equity and interest coverage ratio of the company and its competitors for the period of last 3 years. This modern and well-arranged Effective Financial Planning Assessment Techniques Leverage Ratios To Measure The Debt Level Sample PDF provides lots of creative possibilities. It is very simple to customize and edit with the Powerpoint Software. Just drag and drop your pictures into the shapes. All facets of this template can be edited with Powerpoint no extra software is necessary. Add your own material, put your images in the places assigned for them, adjust the colors, and then you can show your slides to the world, with an animated slide included.
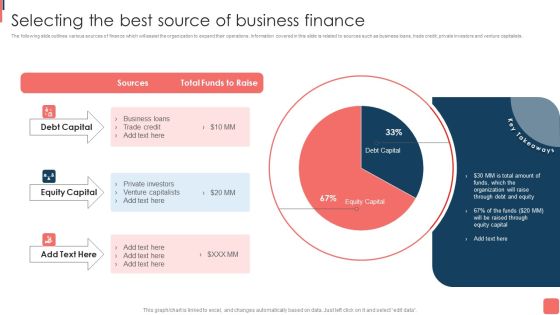
Effective Financial Planning Assessment Techniques Selecting The Best Source Of Business Finance Slides PDF
The following slide outlines various sources of finance which will assist the organization to expand their operations. Information covered in this slide is related to sources such as business loans, trade credit, private investors and venture capitalists. Slidegeeks has constructed Effective Financial Planning Assessment Techniques Selecting The Best Source Of Business Finance Slides PDF after conducting extensive research and examination. These presentation templates are constantly being generated and modified based on user preferences and critiques from editors. Here, you will find the most attractive templates for a range of purposes while taking into account ratings and remarks from users regarding the content. This is an excellent jumping-off point to explore our content and will give new users an insight into our top-notch PowerPoint Templates.

Food Organization Financial Trends Customer Survey Results For Eating At Restaurant Formats PDF
The slide highlights the survey results of customers to illustrate the attitude of people preferring restaurant for eating. The reasons selected by most customers are enjoyable experience, leisure time, and life style. Coming up with a presentation necessitates that the majority of the effort goes into the content and the message you intend to convey. The visuals of a PowerPoint presentation can only be effective if it supplements and supports the story that is being told. Keeping this in mind our experts created Food Organization Financial Trends Customer Survey Results For Eating At Restaurant Formats PDF to reduce the time that goes into designing the presentation. This way, you can concentrate on the message while our designers take care of providing you with the right template for the situation.
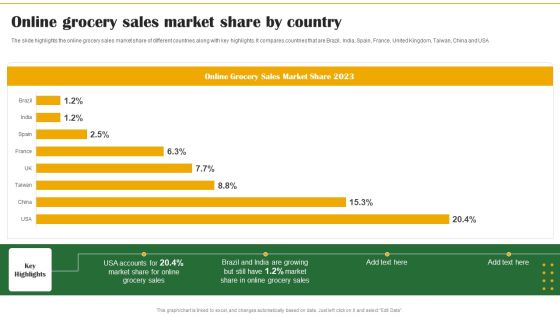
Food Organization Financial Trends Online Grocery Sales Market Share By Country Mockup PDF
The slide highlights the online grocery sales market share of different countries along with key highlights. It compares countries that are Brazil, India, Spain, France, United Kingdom, Taiwan, China and USA. The Food Organization Financial Trends Online Grocery Sales Market Share By Country Mockup PDF is a compilation of the most recent design trends as a series of slides. It is suitable for any subject or industry presentation, containing attractive visuals and photo spots for businesses to clearly express their messages. This template contains a variety of slides for the user to input data, such as structures to contrast two elements, bullet points, and slides for written information. Slidegeeks is prepared to create an impression.
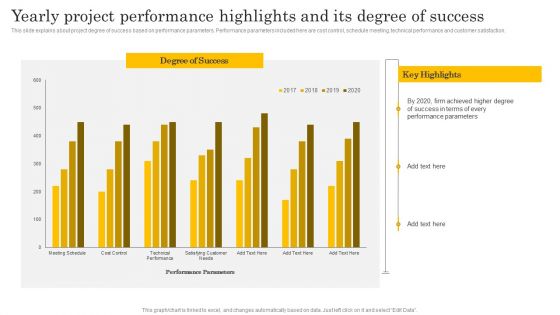
Financial Evaluation Report Yearly Project Performance Highlights And Its Degree Template PDF
This slide explains about project degree of success based on performance parameters. Performance parameters included here are cost control, schedule meeting, technical performance and customer satisfaction. Retrieve professionally designed Financial Evaluation Report Yearly Project Performance Highlights And Its Degree Template PDF to effectively convey your message and captivate your listeners. Save time by selecting pre-made slideshows that are appropriate for various topics, from business to educational purposes. These themes come in many different styles, from creative to corporate, and all of them are easily adjustable and can be edited quickly. Access them as PowerPoint templates or as Google Slides themes. You dont have to go on a hunt for the perfect presentation because Slidegeeks got you covered from everywhere.
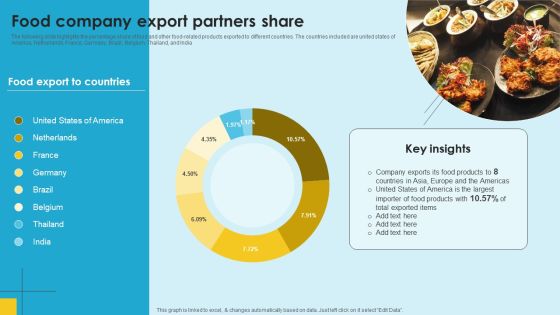
Food Company Financial Performance Summary Food Company Export Partners Share Background PDF
The following slide highlights the percentage share of food and other food-related products exported to different countries. The countries included are united states of America, Netherlands, France, Germany, Brazil, Belgium, Thailand, and India. Slidegeeks has constructed Food Company Financial Performance Summary Food Company Export Partners Share Background PDF after conducting extensive research and examination. These presentation templates are constantly being generated and modified based on user preferences and critiques from editors. Here, you will find the most attractive templates for a range of purposes while taking into account ratings and remarks from users regarding the content. This is an excellent jumping-off point to explore our content and will give new users an insight into our top-notch PowerPoint Templates.
Food Company Financial Performance Summary Historical Food Product Sales Chart Icons PDF
The following slide shows the comparative sales growth of agricultural products and processed foods. It shows the product sales from more than three decades to assess the change in demand of company products. This Food Company Financial Performance Summary Historical Food Product Sales Chart Icons PDF from Slidegeeks makes it easy to present information on your topic with precision. It provides customization options, so you can make changes to the colors, design, graphics, or any other component to create a unique layout. It is also available for immediate download, so you can begin using it right away. Slidegeeks has done good research to ensure that you have everything you need to make your presentation stand out. Make a name out there for a brilliant performance.

Strategic Financial Plan Use Of Funds In E Commerce Garment Business Pictures PDF
This slide showcases the uses of raised funds for business. Major areas where investments are used are business development, new hirings, product innovation, debt payment, sales and marketing, and R and D. Slidegeeks is here to make your presentations a breeze with Strategic Financial Plan Use Of Funds In E-Commerce Garment Business Pictures PDF With our easy-to-use and customizable templates, you can focus on delivering your ideas rather than worrying about formatting. With a variety of designs to choose from, you are sure to find one that suits your needs. And with animations and unique photos, illustrations, and fonts, you can make your presentation pop. So whether you are giving a sales pitch or presenting to the board, make sure to check out Slidegeeks first

Adjusting Financial Strategies And Planning Measuring Business Earnings With Profitability Ratios Download PDF
This slide provides glimpse about profitability ratio analysis for calculating our firms business earnings and net profit margin. It includes quarterly gross profit margin, quarterly net profit margin, key insights, etc. The Adjusting Financial Strategies And Planning Measuring Business Earnings With Profitability Ratios Download PDF is a compilation of the most recent design trends as a series of slides. It is suitable for any subject or industry presentation, containing attractive visuals and photo spots for businesses to clearly express their messages. This template contains a variety of slides for the user to input data, such as structures to contrast two elements, bullet points, and slides for written information. Slidegeeks is prepared to create an impression.

Adjusting Financial Strategies And Planning Tracking The Cashflow Improvements With Cash Management Diagrams PDF
This slide showcases the KPIs that would help our business organization to track the improvements in the new cash management process. It includes quick ratio, cash balance, current ratio, days inventory outstanding, etc. Retrieve professionally designed Adjusting Financial Strategies And Planning Tracking The Cashflow Improvements With Cash Management Diagrams PDF to effectively convey your message and captivate your listeners. Save time by selecting pre made slideshows that are appropriate for various topics, from business to educational purposes. These themes come in many different styles, from creative to corporate, and all of them are easily adjustable and can be edited quickly. Access them as PowerPoint templates or as Google Slides themes. You do not have to go on a hunt for the perfect presentation because Slidegeeks got you covered from everywhere.

Search Retargeting And Lead Generation Company Elevator Pitch Deck Financial Performance Portrait PDF
This slide caters to the performance of the company providing link retargeting service that helps businesses reach their target audience with relevant advertisements. It consists of information related to the companys assets and liabilities. Coming up with a presentation necessitates that the majority of the effort goes into the content and the message you intend to convey. The visuals of a PowerPoint presentation can only be effective if it supplements and supports the story that is being told. Keeping this in mind our experts created Search Retargeting And Lead Generation Company Elevator Pitch Deck Financial Performance Portrait PDF to reduce the time that goes into designing the presentation. This way, you can concentrate on the message while our designers take care of providing you with the right template for the situation.
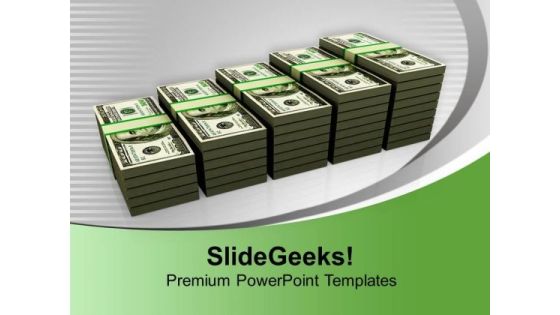
Bar Graph Made By Dollar Bills Finance PowerPoint Templates Ppt Backgrounds For Slides 1112
We present our Bar Graph Made By Dollar Bills Finance PowerPoint Templates PPT Backgrounds For Slides 1112.Present our Money PowerPoint Templates because you can Show them the way, be Captain of the ship and lead them to new shores. Present our Business PowerPoint Templates because The foundation of the structure of your business is resilient and dependable. Convey this confidence to your colleagues and assure them of a great and enduring future. Download and present our Success PowerPoint Templates because you have come up with a brilliant breakthrough idea. you can also visualise the interest it will generate. Present our Finance PowerPoint Templates because you envisage some areas of difficulty in the near future. The overall financial situation could be a source of worry. Download and present our Future PowerPoint Templates because let this slide illustrates others piggyback on you to see well over the horizon.Use these PowerPoint slides for presentations relating to Bar graph from us dollars, money, business, finance, success, future. The prominent colors used in the PowerPoint template are Green, Gray, White. People tell us our Bar Graph Made By Dollar Bills Finance PowerPoint Templates PPT Backgrounds For Slides 1112 provide great value for your money. Be assured of finding the best projection to highlight your words. Presenters tell us our business PowerPoint templates and PPT Slides are Fancy. PowerPoint presentation experts tell us our Bar Graph Made By Dollar Bills Finance PowerPoint Templates PPT Backgrounds For Slides 1112 are Multicolored. Customers tell us our business PowerPoint templates and PPT Slides are Beautiful. Customers tell us our Bar Graph Made By Dollar Bills Finance PowerPoint Templates PPT Backgrounds For Slides 1112 are Luxuriant. Customers tell us our finance PowerPoint templates and PPT Slides are Magnificent.
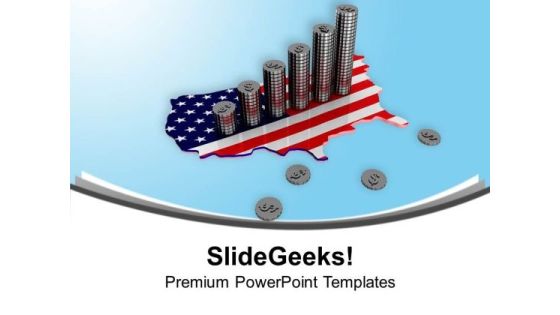
American Dollar Graph Finance PowerPoint Templates Ppt Backgrounds For Slides 1112
We present our American Dollar Graph Finance PowerPoint Templates PPT Backgrounds For Slides 1112.Download and present our Americana PowerPoint Templates because our presentation designs are for those on the go. Download and present our Business PowerPoint Templates because you have had your share of being a goldfish in a small bowl.you are ready to launch out and spread your wings. Download and present our Marketing PowerPoint Templates because you can Employ the right colours for your brilliant ideas. Download and present our Finance PowerPoint Templates because you envisage some areas of difficulty in the near future. The overall financial situation could be a source of worry. Download our Success PowerPoint Templates because you have come up with a brilliant breakthrough idea. you can also visualise the interest it will generate.Use these PowerPoint slides for presentations relating to Dollars graph on usa map flag, americana, business, finance, marketing, success. The prominent colors used in the PowerPoint template are Blue, Red, White. People tell us our American Dollar Graph Finance PowerPoint Templates PPT Backgrounds For Slides 1112 effectively help you save your valuable time. Presenters tell us our flag PowerPoint templates and PPT Slides are Attractive. PowerPoint presentation experts tell us our American Dollar Graph Finance PowerPoint Templates PPT Backgrounds For Slides 1112 are Splendid. Customers tell us our finance PowerPoint templates and PPT Slides are Fashionable. Customers tell us our American Dollar Graph Finance PowerPoint Templates PPT Backgrounds For Slides 1112 are Breathtaking. Customers tell us our map PowerPoint templates and PPT Slides are readymade to fit into any presentation structure.

Computer Tablet With Business Graph Sales PowerPoint Templates Ppt Backgrounds For Slides 1212
We present our Computer Tablet With Business Graph Sales PowerPoint Templates PPT Backgrounds For Slides 1212.Download our Technology PowerPoint Templates because you have the ideas and plans on how to achieve success. Present our Money PowerPoint Templates because you can Show them the way, be Captain of the ship and lead them to new shores. Download our Marketing PowerPoint Templates because The marketplace is the merger of your dreams and your ability. Download and present our Computer PowerPoint Templates because this shows ideas to get the different elements of your Business to mesh and coalesce into a focused team driven by a common goal to achieve the common aim with Excellence. Download our Success PowerPoint Templates because iT outlines the entire thought process for the benefit of others. Tell it to the world with your characteristic aplomb.Use these PowerPoint slides for presentations relating to Modern financial analysis, technology, money, marketing, computer, success. The prominent colors used in the PowerPoint template are Blue, Red, Green. Professionals tell us our Computer Tablet With Business Graph Sales PowerPoint Templates PPT Backgrounds For Slides 1212 provide great value for your money. Be assured of finding the best projection to highlight your words. Use our computer PowerPoint templates and PPT Slides are designed by professionals We assure you our Computer Tablet With Business Graph Sales PowerPoint Templates PPT Backgrounds For Slides 1212 are Bold. We assure you our PowerPoint templates and PPT Slides will make the presenter look like a pro even if they are not computer savvy. Presenters tell us our Computer Tablet With Business Graph Sales PowerPoint Templates PPT Backgrounds For Slides 1212 are Zippy. PowerPoint presentation experts tell us our money PowerPoint templates and PPT Slides are Chic.

Bar Graph Dollar Finance PowerPoint Templates Ppt Backgrounds For Slides 1212
We present our Bar Graph Dollar Finance PowerPoint Templates PPT Backgrounds For Slides 1212.Use our Money PowerPoint Templates because in this Slide Various threads are joining up and being stitched together providing necessary strength Now you have to take the last leap. Present our Finance PowerPoint Templates because you envisage some areas of difficulty in the near future. The overall financial situation could be a source of worry. Use our Marketing PowerPoint Templates because it can illustrate your chain of ideas focusing on that aspect or resource in order to enhance the quality of your product. Use our Business PowerPoint Templates because it helps you to explain your plans in all earnest to your colleagues and raise the bar for all. Use our Success PowerPoint Templates because you have come up with a brilliant breakthrough idea. you can also visualise the interest it will generate.Use these PowerPoint slides for presentations relating to Money marketing chart, business, money, finance, marketing, success. The prominent colors used in the PowerPoint template are Green, Black, Gray. Customers tell us our Bar Graph Dollar Finance PowerPoint Templates PPT Backgrounds For Slides 1212 are Chic. Presenters tell us our chart PowerPoint templates and PPT Slides are Handsome. Use our Bar Graph Dollar Finance PowerPoint Templates PPT Backgrounds For Slides 1212 are Radiant. PowerPoint presentation experts tell us our PowerPoint templates and PPT Slides are Radiant. Customers tell us our Bar Graph Dollar Finance PowerPoint Templates PPT Backgrounds For Slides 1212 are Dynamic. Presenters tell us our success PowerPoint templates and PPT Slides are Stylish.

Bar Graph With Growth Arrow Global Business PowerPoint Templates Ppt Backgrounds For Slides 1112
We present our Bar Graph With Growth Arrow Global Business PowerPoint Templates PPT Backgrounds For Slides 1112.Present our Globe PowerPoint Templates because our ready backdrops leave a lasting impression. Present our Finance PowerPoint Templates because you envisage some areas of difficulty in the near future. The overall financial situation could be a source of worry. Download our Arrows PowerPoint Templates because the ideas and plans are on your finger tips. Download and present our Success PowerPoint Templates because the choices you make today will determine the future growth of your enterprise. Download and present our New year PowerPoint Templates because you can Set out the goals and your plan of action for teamwork.Use these PowerPoint slides for presentations relating to Growth Chart with globe, Globe, Finance, Arrows, Success, New year. The prominent colors used in the PowerPoint template are Blue, Yellow, Gray. You can be sure our Bar Graph With Growth Arrow Global Business PowerPoint Templates PPT Backgrounds For Slides 1112 are Glamorous. Professionals tell us our Arrows PowerPoint templates and PPT Slides are the best it can get when it comes to presenting. We assure you our Bar Graph With Growth Arrow Global Business PowerPoint Templates PPT Backgrounds For Slides 1112 are designed to make your presentations professional. PowerPoint presentation experts tell us our Success PowerPoint templates and PPT Slides are No-nonsense. The feedback we get is that our Bar Graph With Growth Arrow Global Business PowerPoint Templates PPT Backgrounds For Slides 1112 are Wistful. PowerPoint presentation experts tell us our Success PowerPoint templates and PPT Slides are Glamorous.

Quarterly Financial Performance Ratio Analysis Ppt PowerPoint Presentation Model Format Ideas
This is a quarterly financial performance ratio analysis ppt powerpoint presentation model format ideas. This is a four stage process. The stages in this process are financial analysis, quantitative, statistical modelling.

Effective Financial Risk Management Strategies Decrease In Non Performing Loans Of The Banks Rules PDF
This slide shows an decrease in non performing loans of XYZ bank with other competitor banks with key notes. Deliver an awe inspiring pitch with this creative V bundle. Topics like Non Performing Loans can be discussed with this completely editable template. It is available for immediate download depending on the needs and requirements of the user.

Line Graph For Year To Year Comparison Ppt PowerPoint Presentation Show Graphics Example
Presenting this set of slides with name line graph for year to year comparison ppt powerpoint presentation show graphics example. The topics discussed in these slides are revenue trend, bar chart, financial. This is a completely editable PowerPoint presentation and is available for immediate download. Download now and impress your audience.
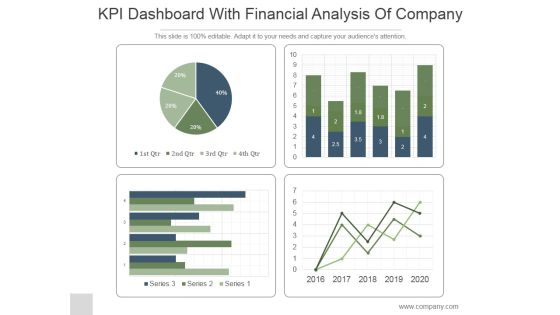
KPI Dashboard With Financial Analysis Of Company Ppt PowerPoint Presentation Backgrounds
This is a kpi dashboard with financial analysis of company ppt powerpoint presentation backgrounds. This is a four stage process. The stages in this process are business, strategy, marketing, line graph, finance.

Bar Graph Representing Macroeconomic Analysis Employment Change By Industry Background PDF
This slide focuses on the graphical presentation of macroeconomic indicator such as employment rate of different industries which includes service providing and goods producing industries which includes healthcare and social assistance, construction, manufacturing industry, etc. Pitch your topic with ease and precision using this Bar Graph Representing Macroeconomic Analysis Employment Change By Industry Background PDF. This layout presents information on Goods Producing, Service Providing, Financial, Business. It is also available for immediate download and adjustment. So, changes can be made in the color, design, graphics or any other component to create a unique layout.

Customer Relationship Management Marketing Dashboard With Revenue Graph And Deals Funnel Ideas PDF
The following slides highlights the CRM marketing dashboard with provides key details about new contacts, campaign email sent, revenue graph and worth of new deals. Showcasing this set of slides titled customer relationship management marketing dashboard with revenue graph and deals funnel ideas pdf. The topics addressed in these templates are funnel, revenue graph, campaign. All the content presented in this PPT design is completely editable. Download it and make adjustments in color, background, font etc. as per your unique business setting.

Community Capitalization Pitch Deck Shareholding Structure Graph Pre And Post Funding Template Pdf
The Slide Provides the Graph of Shareholding Structure at the Time Of Founding, Before Crowdfunding and After Crowdfunding. Deliver an awe inspiring pitch with this creative community capitalization pitch deck shareholding structure graph pre and post funding template pdf bundle. Topics like shareholding structure graph pre and post funding can be discussed with this completely editable template. It is available for immediate download depending on the needs and requirements of the user.
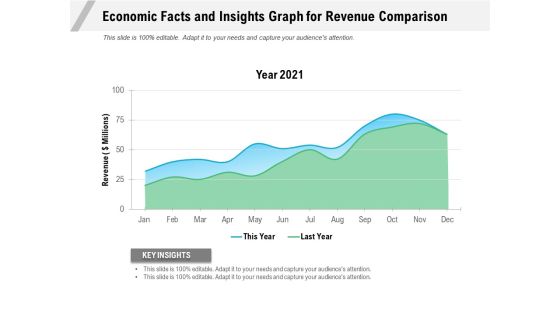
Economic Facts And Insights Graph For Revenue Comparison Ppt PowerPoint Presentation Gallery Portfolio PDF
Pitch your topic with ease and precision using this economic facts and insights graph for revenue comparison ppt powerpoint presentation gallery portfolio pdf. This layout presents information on year 2021, revenue, key insights. It is also available for immediate download and adjustment. So, changes can be made in the color, design, graphics or any other component to create a unique layout.

Economic Outlook Graph With Percentage Analysis Ppt PowerPoint Presentation Show Demonstration PDF
Presenting this set of slides with name economic outlook graph with percentage analysis ppt powerpoint presentation show demonstration pdf. The topics discussed in these slide is economic outlook graph with percentage analysis. This is a completely editable PowerPoint presentation and is available for immediate download. Download now and impress your audience.
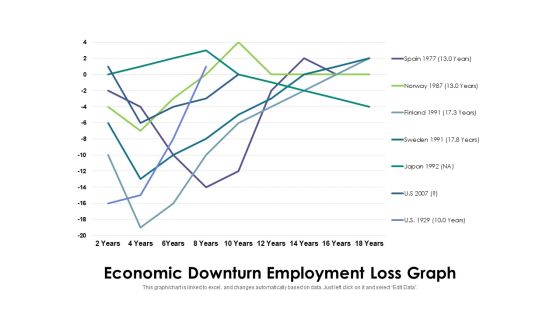
Economic Downturn Employment Loss Graph Ppt PowerPoint Presentation Outline Example File PDF
Pitch your topic with ease and precision using this economic downturn employment loss graph ppt powerpoint presentation outline example file pdf. This layout presents information on economic downturn employment loss graph. It is also available for immediate download and adjustment. So, changes can be made in the color, design, graphics or any other component to create a unique layout.

Data Driven Economic Facts And Insights Graph For Product Ppt PowerPoint Presentation Pictures Slide Download PDF
Pitch your topic with ease and precision using this data driven economic facts and insights graph for product ppt powerpoint presentation pictures slide download pdf. This layout presents information on year 2021, product, data driven economic. It is also available for immediate download and adjustment. So, changes can be made in the color, design, graphics or any other component to create a unique layout.

Graph Showing Revenue Through Social Media Marketing Ppt PowerPoint Presentation Gallery Professional PDF
Presenting this set of slides with name graph showing revenue through social media marketing ppt powerpoint presentation gallery professional pdf. The topics discussed in these slide is graph showing revenue through social media marketing. This is a completely editable PowerPoint presentation and is available for immediate download. Download now and impress your audience.

Bar Graph Revenue Performance Analysis Ppt PowerPoint Presentation Pictures Samples PDF
Presenting this set of slides with name bar graph revenue performance analysis ppt powerpoint presentation pictures samples pdf. The topics discussed in these slide is bar graph revenue performance analysis. This is a completely editable PowerPoint presentation and is available for immediate download. Download now and impress your audience.

Bar Graph Depicting Business Sales Revenue With Cagr Value Ppt PowerPoint Presentation File Outline PDF
Showcasing this set of slides titled bar graph depicting business sales revenue with cagr value ppt powerpoint presentation file outline pdf. The topics addressed in these templates are bar graph depicting business sales revenue with cagr value. All the content presented in this PPT design is completely editable. Download it and make adjustments in color, background, font etc. as per your unique business setting.

Sales By Area Graph Showing Revenue From Top Countries Inspiration PDF
Showcasing this set of slides titled Sales By Area Graph Showing Revenue From Top Countries Inspiration PDF. The topics addressed in these templates are Sales Area, Graph Showing, Revenue Countries. All the content presented in this PPT design is completely editable. Download it and make adjustments in color, background, font etc. as per your unique business setting.

Bar Graph Showing Revenues Generated By Sales Department Ppt Portfolio Graphics Example PDF
This graph or chart is linked to excel, and changes automatically based on data. Just left click on it and select edit data. Showcasing this set of slides titled bar graph showing revenues generated by sales department ppt portfolio graphics example pdf. The topics addressed in these templates are yearly sales revenues, sales team, profits. All the content presented in this PPT design is completely editable. Download it and make adjustments in color, background, font etc. as per your unique business setting.
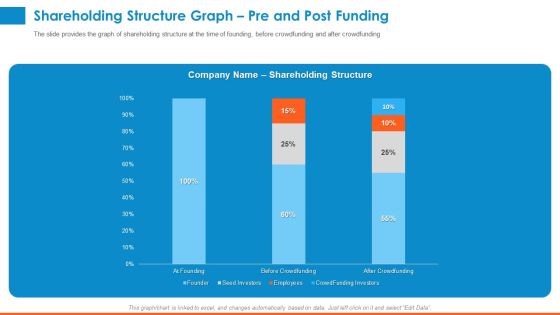
Raising Company Capital From Public Funding Sources Shareholding Structure Graph Pre And Post Funding Diagrams PDF
The slide provides the graph of shareholding structure at the time of founding, before crowdfunding and after crowdfunding. Deliver an awe-inspiring pitch with this creative raising company capital from public funding sources shareholding structure graph pre and post funding diagrams pdf bundle. Topics like founder, seed investors, employees, crowdfunding investors, before crowdfunding, after crowdfunding can be discussed with this completely editable template. It is available for immediate download depending on the needs and requirements of the user.
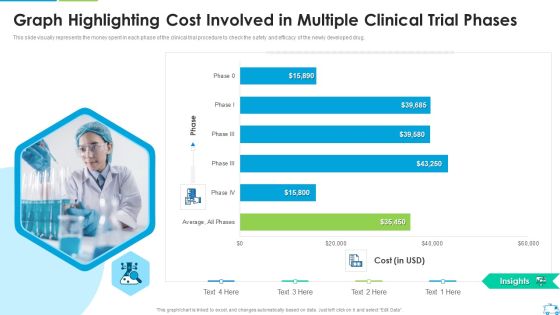
Graph Highlighting Cost Involved In Multiple Clinical Trial Phases Microsoft PDF
This slide visually represents the money spent in each phase of the clinical trial procedure to check the safety and efficacy of the newly developed drug.Deliver an awe inspiring pitch with this creative Graph Highlighting Cost Involved In Multiple Clinical Trial Phases Microsoft PDF bundle. Topics like Graph Highlighting Cost Involved In Multiple Clinical Trial Phases can be discussed with this completely editable template. It is available for immediate download depending on the needs and requirements of the user.
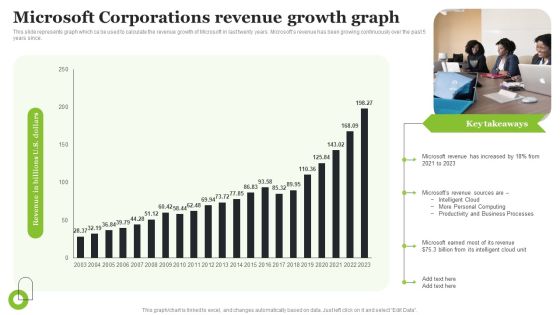
Microsoft Strategic Plan To Become Market Leader Microsoft Corporations Revenue Growth Graph Portrait PDF
This slide represents graph which ca be used to calculate the revenue growth of Microsoft in last twenty years. Microsofts revenue has been growing continuously over the past 5 years since. Whether you have daily or monthly meetings, a brilliant presentation is necessary. Microsoft Strategic Plan To Become Market Leader Microsoft Corporations Revenue Growth Graph Portrait PDF can be your best option for delivering a presentation. Represent everything in detail using Microsoft Strategic Plan To Become Market Leader Microsoft Corporations Revenue Growth Graph Portrait PDF and make yourself stand out in meetings. The template is versatile and follows a structure that will cater to your requirements. All the templates prepared by Slidegeeks are easy to download and edit. Our research experts have taken care of the corporate themes as well. So, give it a try and see the results.

Business Revenue Bar Graph With Business Operational Expenditure Details Summary PDF
This slide represents business revenue bar graph with OPEX details which can be referred by companies to earn more revenue by controlling expenditures. It also provides information about marketing and sales, research and development, administration, total revenue, etc. Pitch your topic with ease and precision using this Business Revenue Bar Graph With Business Operational Expenditure Details Summary PDF. This layout presents information on Cost Of Marketing, Sales, Highest Amount. It is also available for immediate download and adjustment. So, changes can be made in the color, design, graphics or any other component to create a unique layout.
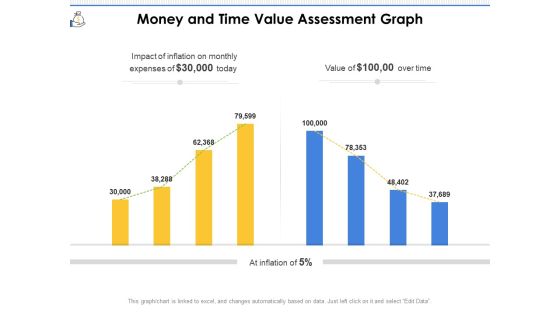
Money And Time Value Assessment Graph Ppt PowerPoint Presentation File Outline PDF
Presenting this set of slides with name money and time value assessment graph ppt powerpoint presentation file outline pdf. The topics discussed in these slides are inflation, expenses, value. This is a completely editable PowerPoint presentation and is available for immediate download. Download now and impress your audience.
Gross And Net Revenue Comparison Shown By Graph Ppt PowerPoint Presentation File Icons PDF
Presenting this set of slides with name gross and net revenue comparison shown by graph ppt powerpoint presentation file icons pdf. The topics discussed in these slides are gross profit, net profit. This is a completely editable PowerPoint presentation and is available for immediate download. Download now and impress your audience.

Corporate Training Program Employee Productivity And Efficiency Graph For Last 5 Years Elements PDF
The following slide showcases he employees productivity and efficiency graph for last years which shows that employees productivity has declined during this time period because of lack of training programs and high attrition rate. Make sure to capture your audiences attention in your business displays with our gratis customizable Corporate Training Program Employee Productivity And Efficiency Graph For Last 5 Years Elements PDF. These are great for business strategies, office conferences, capital raising or task suggestions. If you desire to acquire more customers for your tech business and ensure they stay satisfied, create your own sales presentation with these plain slides.
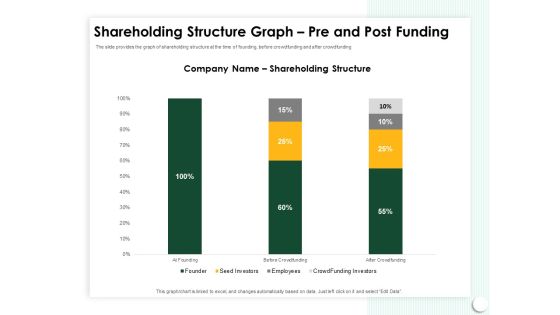
Startup Presentation For Collaborative Capital Funding Shareholding Structure Graph Pre And Post Funding Background PDF
Presenting this set of slides with name startup presentation for collaborative capital funding shareholding structure graph pre and post funding background pdf. The topics discussed in these slides are employee, shareholding structure, seed investors, crowd funding investors. This is a completely editable PowerPoint presentation and is available for immediate download. Download now and impress your audience.
Startup Pitch To Raise Capital From Crowdfunding Shareholding Structure Graph Pre And Post Funding Icons PDF
Deliver an awe-inspiring pitch with this creative startup pitch to raise capital from crowdfunding shareholding structure graph pre and post funding icons pdf bundle. Topics like founder, employee, seed investors, crowdfunding investors can be discussed with this completely editable template. It is available for immediate download depending on the needs and requirements of the user.

Bar Graph Showing Profit Analysis Ppt PowerPoint Presentation Icon Deck PDF
Presenting this set of slides with name bar graph showing profit analysis ppt powerpoint presentation icon deck pdf. The topics discussed in these slides are gross revenue, income. This is a completely editable PowerPoint presentation and is available for immediate download. Download now and impress your audience.
Bar Graph Showing Of Business Income And Expenditure Ppt PowerPoint Presentation Icon Show PDF
Presenting this set of slides with name bar graph showing of business income and expenditure ppt powerpoint presentation icon show pdf. The topics discussed in these slides are expenses, revenue. This is a completely editable PowerPoint presentation and is available for immediate download. Download now and impress your audience.

Business Sales Graph With Target Per Sales Representation Ppt PowerPoint Presentation Gallery Templates PDF
Presenting this set of slides with name business sales graph with target per sales representation ppt powerpoint presentation gallery templates pdf. The topics discussed in these slides are revenue, sales, target. This is a completely editable PowerPoint presentation and is available for immediate download. Download now and impress your audience.

Competitor Analysis Competitor Revenue And Profit Graph Ppt PowerPoint Presentation Gallery Vector
This is a competitor analysis competitor revenue and profit graph ppt powerpoint presentation gallery vector. This is a five stage process. The stages in this process are bar graph, marketing, management, business, presentation.

Graph Highlighting Cost Involved In Multiple Clinical Trial Phases New Clinical Drug Trial Process Mockup PDF
This slide visually represents the money spent in each phase of the clinical trial procedure to check the safety and efficacy of the newly developed drug. Find highly impressive Graph Highlighting Cost Involved In Multiple Clinical Trial Phases New Clinical Drug Trial Process Mockup PDF on Slidegeeks to deliver a meaningful presentation. You can save an ample amount of time using these presentation templates. No need to worry to prepare everything from scratch because Slidegeeks experts have already done a huge research and work for you. You need to download Graph Highlighting Cost Involved In Multiple Clinical Trial Phases New Clinical Drug Trial Process Mockup PDF for your upcoming presentation. All the presentation templates are 100 percent editable and you can change the color and personalize the content accordingly. Download now.

Technology Companies Market Cap Declining Graph Ppt PowerPoint Presentation File Smartart PDF
This slide shows the multiple companies capital that is invested by them in the market for making profits and advancing the technologies. It shows the decline of their capital amount in the following month. Pitch your topic with ease and precision using this Technology Companies Market Cap Declining Graph Ppt PowerPoint Presentation File Smartart PDF. This layout presents information on Overall Decline, Companies Low, Incurred Mor. It is also available for immediate download and adjustment. So, changes can be made in the color, design, graphics or any other component to create a unique layout.
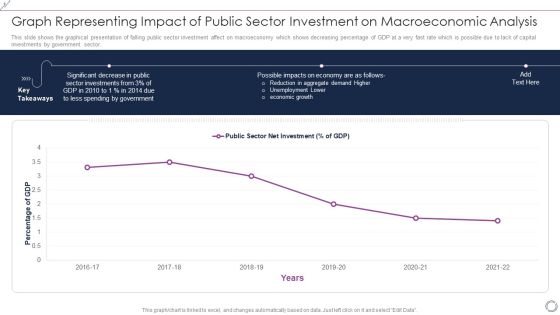
Graph Representing Impact Of Public Sector Investment On Macroeconomic Analysis Themes PDF
This slide shows the graphical presentation of falling public sector investment affect on macroeconomy which shows decreasing percentage of GDP at a very fast rate which is possible due to lack of capital investments by government sector. Showcasing this set of slides titled Graph Representing Impact Of Public Sector Investment On Macroeconomic Analysis Themes PDF. The topics addressed in these templates are Percentage GDP, 2016 to 2022, Public Sector Net Investment. All the content presented in this PPT design is completely editable. Download it and make adjustments in color, background, font etc. as per your unique business setting.

Bar Graph Representing Accomplishment Metrics For Customer Service Team Icons PDF
This slide shows the graphical representation of success metrics that helps to measure the customer service team which includes customer lifetime value, customer churn, net promoter score, revenues churn, customer experience score, customer renewals, etc. Showcasing this set of slides titled bar graph representing accomplishment metrics for customer service team icons pdf. The topics addressed in these templates are importance level, least important. All the content presented in this PPT design is completely editable. Download it and make adjustments in color, background, font etc. as per your unique business setting.

Graph Highlighting Cost Involved In Multiple Clinical Trial Phases Clinical Research Trial Phases Infographics PDF
This slide visually represents the money spent in each phase of the clinical trial procedure to check the safety and efficacy of the newly developed drug. Retrieve professionally designed Graph Highlighting Cost Involved In Multiple Clinical Trial Phases Clinical Research Trial Phases Infographics PDF to effectively convey your message and captivate your listeners. Save time by selecting pre-made slideshows that are appropriate for various topics, from business to educational purposes. These themes come in many different styles, from creative to corporate, and all of them are easily adjustable and can be edited quickly. Access them as PowerPoint templates or as Google Slides themes. You do not have to go on a hunt for the perfect presentation because Slidegeeks got you covered from everywhere.

Information Technology Expenditure Summary Dashboard Ppt PowerPoint Presentation Diagram Graph Charts PDF
The following slide showcases the cyber security expense overview to better allocate budget. It includes elements such as IT cost, revenue, security incidents, services down, issue status summary, total business hours lost etc. This Information Technology Expenditure Summary Dashboard Ppt PowerPoint Presentation Diagram Graph Charts PDF from Slidegeeks makes it easy to present information on your topic with precision. It provides customization options, so you can make changes to the colors, design, graphics, or any other component to create a unique layout. It is also available for immediate download, so you can begin using it right away. Slidegeeks has done good research to ensure that you have everything you need to make your presentation stand out. Make a name out there for a brilliant performance.
Business Dollar Graph Growth Success PowerPoint Templates And PowerPoint Themes 0712
Business Dollar Graph Growth Success PowerPoint Templates And PowerPoint Themes Business Power Points-Microsoft Powerpoint Templates and Background with dollars graph

Business People Walking 3d Men On Top Of Graph PowerPoint Templates
We present our business people walking 3d men on top of graph PowerPoint templates.Download and present our Business PowerPoint Templates because our PowerPoint Templates and Slides are a looking glass. Train them on the magnificent future you have in mind. Download our People PowerPoint Templates because Our PowerPoint Templates and Slides will Activate the energies of your audience. Get their creative juices flowing with your words. Download our Flow Chart PowerPoint Templates because Our PowerPoint Templates and Slides will provide weight to your words. They will bring out the depth of your thought process. Present our Shapes PowerPoint Templates because You can Hit a home run with our PowerPoint Templates and Slides. See your ideas sail into the minds of your audience. Download and present our Future PowerPoint Templates because you should once Tap the ingenuity of our PowerPoint Templates and Slides. They are programmed to succeed.Use these PowerPoint slides for presentations relating to 3d, abstract, agreement, art, background, bank, banking, bargraph, business,businessman, cartoon, cash, cg, cgi, character, concept, conceptual, contract,deal, figure, finance, financial, growth, guy, handshake, human, humanoid, icon,illustration, man, market, money, partnership, person, presentation, render, stylized, success, suit, symbolic, tie. The prominent colors used in the PowerPoint template are White, Yellow, Red. We assure you our business people walking 3d men on top of graph PowerPoint templates will make you look like a winner. You can be sure our banking PowerPoint templates and PPT Slides help you meet deadlines which are an element of today's workplace. Just browse and pick the slides that appeal to your intuitive senses. Use our business people walking 3d men on top of graph PowerPoint templates are readymade to fit into any presentation structure. We assure you our background PowerPoint templates and PPT Slides are readymade to fit into any presentation structure. Use our business people walking 3d men on top of graph PowerPoint templates are aesthetically designed to attract attention. We guarantee that they will grab all the eyeballs you need. Professionals tell us our banking PowerPoint templates and PPT Slides are specially created by a professional team with vast experience. They diligently strive to come up with the right vehicle for your brilliant Ideas.
Business Bar Graph Upward Arrow Success PowerPoint Templates And PowerPoint Themes 0912
Business Bar Graph Upward Arrow Success PowerPoint Templates And PowerPoint Themes 0912-Microsoft Powerpoint Templates and Background with bar graph with upwards arrows-Bar graph with upwards arrows, success, money, arrows, finance, business

Profit And Loss Graph Concept Finance PowerPoint Templates And PowerPoint Themes 0912
Profit And Loss Graph Concept Finance PowerPoint Templates And PowerPoint Themes 0912-Microsoft Powerpoint Templates and Background with profit and loss graph-Profit and loss graph, business, finance, money, sales, marketing

3d Pie Chart Graph And Dollar PowerPoint Templates And PowerPoint Themes 0912
3d Pie Chart Graph And Dollar PowerPoint Templates And PowerPoint Themes 0912-Microsoft Powerpoint Templates and Background with pie chart graph and dollar-Pie chart graph and dollar, business, signs, marketing, money, finance
Pie Chart Graph Dollar Business PowerPoint Templates And PowerPoint Themes 0912
Pie Chart Graph Dollar Business PowerPoint Templates And PowerPoint Themes 0912-Microsoft Powerpoint Templates and Background with pie chart graph and dollar-Pie chart graph and dollar, business, signs, marketing, money, finance
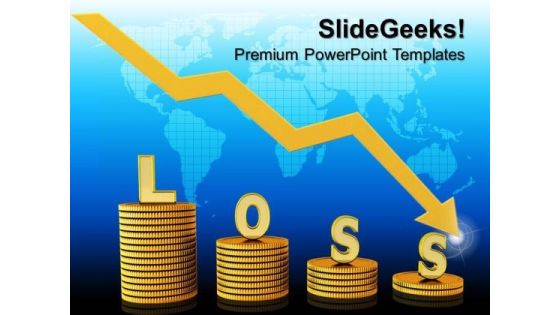
Loss In Money Graph Finance PowerPoint Templates And PowerPoint Themes 0812
Loss In Money Graph Finance PowerPoint Templates And PowerPoint Themes 0812-Microsoft Powerpoint Templates and Background with graph moving down and showing money loss

 Home
Home