Financial Graphs
Service Level Agreement KPI Dashboard With Graph And Analytics Icon Inspiration PDF
Persuade your audience using this Service Level Agreement KPI Dashboard With Graph And Analytics Icon Inspiration PDF. This PPT design covers three stages, thus making it a great tool to use. It also caters to a variety of topics including Service Level, Agreement KPI Dashboard, Graph And Analytics, Icon. Download this PPT design now to present a convincing pitch that not only emphasizes the topic but also showcases your presentation skills.
Graph Icon For Quick And Current Liquidity Ratio Analysis Template PDF
Persuade your audience using this Graph Icon For Quick And Current Liquidity Ratio Analysis Template PDF. This PPT design covers Three stages, thus making it a great tool to use. It also caters to a variety of topics including Graph Icon, Quick And Current, Liquidity Ratio Analysis. Download this PPT design now to present a convincing pitch that not only emphasizes the topic but also showcases your presentation skills.

Digital Money Cash Inflow And Outflow Icon Ppt PowerPoint Presentation Diagram Graph Charts PDF
Presenting Digital Money Cash Inflow And Outflow Icon Ppt PowerPoint Presentation Diagram Graph Charts PDF to dispense important information. This template comprises three stages. It also presents valuable insights into the topics including Digital Money, Cash Inflow, Outflow Icon. This is a completely customizable PowerPoint theme that can be put to use immediately. So, download it and address the topic impactfully.

Insurance Claim Procedure For Asset Insurance Proposal Ppt PowerPoint Presentation Diagram Graph Charts
Presenting this set of slides with name insurance claim procedure for asset insurance proposal ppt powerpoint presentation diagram graph charts. This is a ten stage process. The stages in this process are reimbursement claim process, cashless claim process, asset. This is a completely editable PowerPoint presentation and is available for immediate download. Download now and impress your audience.
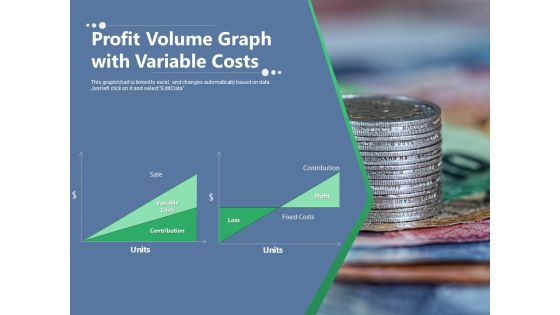
Profit Volume Graph With Variable Costs Ppt PowerPoint Presentation Outline Brochure PDF
Presenting this set of slides with name profit volume graph with variable costs ppt powerpoint presentation outline brochure pdf. This is a one stage process. The stages in this process are sale, contribution, variable costs, profit, fixed costs, loss, units. This is a completely editable PowerPoint presentation and is available for immediate download. Download now and impress your audience.

Business Graph Showing Market Sales And Customers Ppt PowerPoint Presentation Ideas Inspiration PDF
Presenting this set of slides with name business graph showing market sales and customers ppt powerpoint presentation ideas inspiration pdf. This is a two stage process. The stages in this process are Short Head, Customers, Sales, Long Tail, Short Head, Products. This is a completely editable PowerPoint presentation and is available for immediate download. Download now and impress your audience.
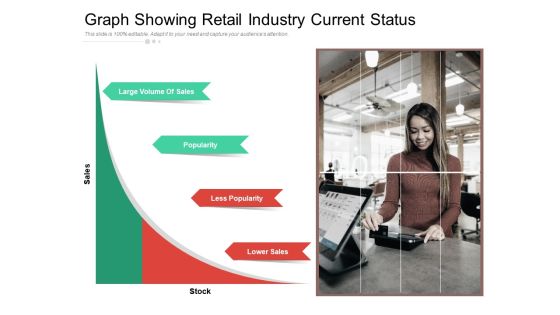
Graph Showing Retail Industry Current Status Ppt PowerPoint Presentation Styles Design Inspiration PDF
Presenting this set of slides with name graph showing retail industry current status ppt powerpoint presentation styles design inspiration pdf. This is a one stage process. The stages in this process are large volume of sales, popularity, less popularity, lower sales, stock, sales. This is a completely editable PowerPoint presentation and is available for immediate download. Download now and impress your audience.
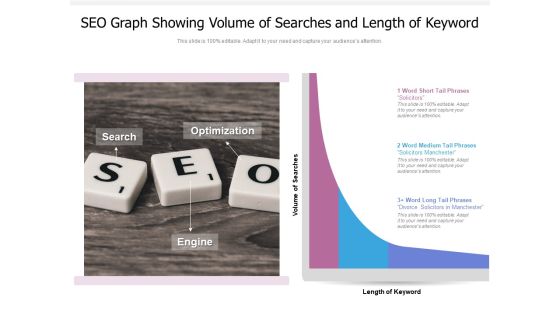
SEO Graph Showing Volume Of Searches And Length Of Keyword Ppt PowerPoint Presentation File Layouts PDF
Presenting this set of slides with name seo graph showing volume of searches and length of keyword ppt powerpoint presentation file layouts pdf. This is a three stage process. The stages in this process are search, optimization, engine, length of keyword, volume of searches. This is a completely editable PowerPoint presentation and is available for immediate download. Download now and impress your audience.

Bar Graph Showing Five Option For Business Expansion Ppt PowerPoint Presentation Portfolio Brochure PDF
Presenting this set of slides with name bar graph showing five option for business expansion ppt powerpoint presentation portfolio brochure pdf. This is a five stage process. The stages in this process are exporting, licencing, franchising, contract manufacturing, joint ventures. This is a completely editable PowerPoint presentation and is available for immediate download. Download now and impress your audience.
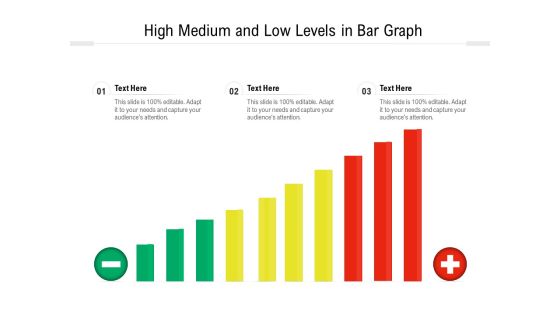
High Medium And Low Levels In Bar Graph Ppt PowerPoint Presentation Professional Design Ideas PDF
Presenting high medium and low levels in bar graph ppt powerpoint presentation professional design ideas pdf to dispense important information. This template comprises one stages. It also presents valuable insights into the topics including low, medium, high. This is a completely customizable PowerPoint theme that can be put to use immediately. So, download it and address the topic impactfully.
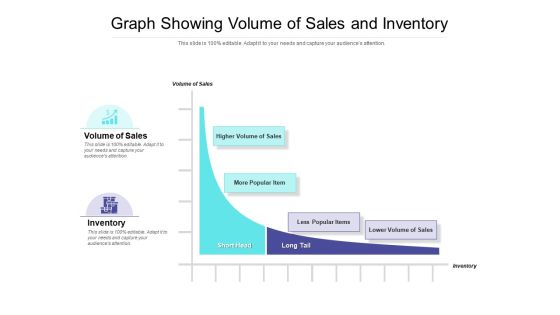
Graph Showing Volume Of Sales And Inventory Ppt PowerPoint Presentation Outline Professional PDF
Presenting this set of slides with name graph showing volume of sales and inventory ppt powerpoint presentation outline professional pdf. This is a two stage process. The stages in this process are volume of sales, inventory, higher volume of sales, higher volume of sales, less popular items, lower volume of sales. This is a completely editable PowerPoint presentation and is available for immediate download. Download now and impress your audience.
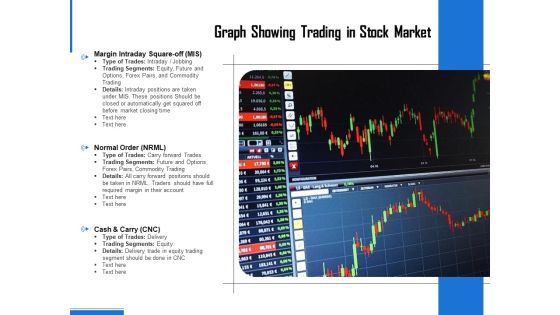
Graph Showing Trading In Stock Market Ppt PowerPoint Presentation Professional Backgrounds PDF
Persuade your audience using this graph showing trading in stock market ppt powerpoint presentation professional backgrounds pdf. This PPT design covers one stages, thus making it a great tool to use. It also caters to a variety of topics including margin intraday square off mis, normal order nrml, cash and carry cnc. Download this PPT design now to present a convincing pitch that not only emphasizes the topic but also showcases your presentation skills.
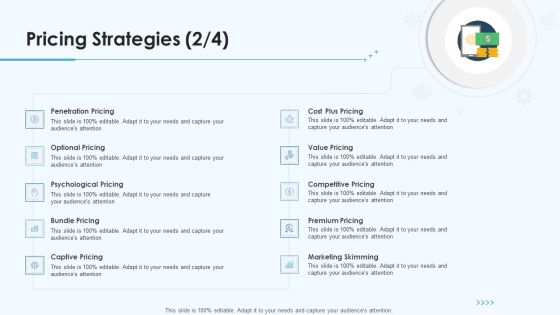
Product Pricing Strategies Pricing Strategies Skimming Ppt Diagram Graph Charts PDF
This is a product pricing strategies pricing strategies skimming ppt diagram graph charts pdf template with various stages. Focus and dispense information on ten stages using this creative set, that comes with editable features. It contains large content boxes to add your information on topics like psychological pricing, captive pricing, marketing skimming, premium pricing, value pricing. You can also showcase facts, figures, and other relevant content using this PPT layout. Grab it now.
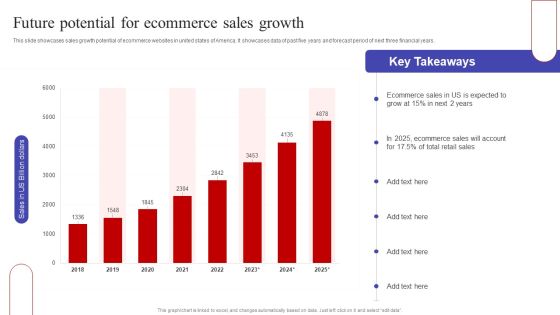
Future Potential For Ecommerce Sales Growth Ppt PowerPoint Presentation Diagram Graph Charts PDF
This slide showcases sales growth potential of ecommerce websites in united states of America. It showcases data of past five years and forecast period of next three financial years. Here you can discover an assortment of the finest PowerPoint and Google Slides templates. With these templates, you can create presentations for a variety of purposes while simultaneously providing your audience with an eye catching visual experience. Download Future Potential For Ecommerce Sales Growth Ppt PowerPoint Presentation Diagram Graph Charts PDF to deliver an impeccable presentation. These templates will make your job of preparing presentations much quicker, yet still, maintain a high level of quality. Slidegeeks has experienced researchers who prepare these templates and write high quality content for you. Later on, you can personalize the content by editing the Future Potential For Ecommerce Sales Growth Ppt PowerPoint Presentation Diagram Graph Charts PDF.

Bar Graph With Dollar Marketing PowerPoint Templates And PowerPoint Themes 1012
Bar Graph with Dollar Marketing PowerPoint Templates And PowerPoint Themes 1012-Emphatically define your message with our above template which contains a graphic of bar graph with dollar notes. This image clearly defines the concept of business statistics and financial reviews. Our stunning image makes your presentations professional showing that you care about even the smallest details. Create captivating presentations to deliver comparative and weighted arguments.-Bar Graph with Dollar Marketing PowerPoint Templates And PowerPoint Themes 1012-This PowerPoint template can be used for presentations relating to-Business graph and dollar, money, finance, success, business, marketing

Pie Chart For Financial Planning And Distribution Ppt PowerPoint Presentation File Deck
Presenting this set of slides with name pie chart for financial planning and distribution ppt powerpoint presentation file deck. The topics discussed in these slides are pie chart, finance, donut chart. This is a completely editable PowerPoint presentation and is available for immediate download. Download now and impress your audience.

Circular Bar Graph Business Success PowerPoint Templates And PowerPoint Themes 1012
Circular Bar Graph Business Success PowerPoint Templates And PowerPoint Themes 1012-The above template displays a diagram of blue circular progress bars. This image represent the concept of business growth and success. This template imitates economy, finance, global, goal, growth, ideas, information, management, profit and statistics. This image has been conceived to enable you to emphatically communicate your ideas in your Business and Marketing PPT presentations. Use this template for financial analysis, business reviews and statistics. Go ahead and add charm to your presentations with our high quality template.-Circular Bar Graph Business Success PowerPoint Templates And PowerPoint Themes 1012-This PowerPoint template can be used for presentations relating to-Circular success graph, marketing, business, finance, success, circle charts

Steps For Sales Risk Management Process Ppt Diagram Graph Charts PDF
The following slide illustrates some steps to optimize sales risk administration process improving organizations overall financial performance. It includes activities such as identifying , assessing, prioritizing, treating and monitoring issues etc. The Steps For Sales Risk Management Process Ppt Diagram Graph Charts PDF is a compilation of the most recent design trends as a series of slides. It is suitable for any subject or industry presentation, containing attractive visuals and photo spots for businesses to clearly express their messages. This template contains a variety of slides for the user to input data, such as structures to contrast two elements, bullet points, and slides for written information. Slidegeeks is prepared to create an impression.
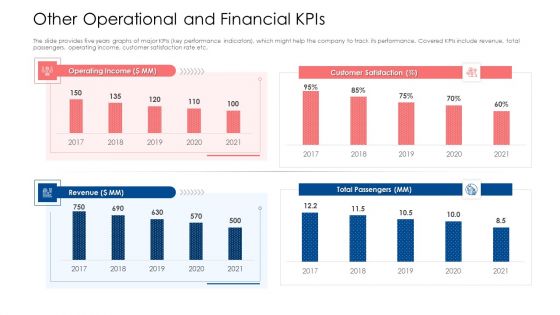
Building Brand Image Of A Railway Firm Other Operational And Financial Kpis Structure PDF
The slide provides five years graphs of major KPIs key performance indicators, which might help the company to track its performance. Covered KPIs include revenue, total passengers, operating income, customer satisfaction rate etc. Deliver and pitch your topic in the best possible manner with this building brand image of a railway firm other operational and financial kpis structure pdf. Use them to share invaluable insights on operating income, customer satisfaction, revenue and impress your audience. This template can be altered and modified as per your expectations. So, grab it now.

Post Implementation Other Operation And Financial Kpis Ppt Infographic Template PDF
The slide provides five years graphs 2020F-2024F forecasted number of major KPIs key performance indicators, that might help to track the performance of ABC Railway. Covered KPIs include Revenue, Total Passengers, operating income, customer satisfaction rate etc. Deliver an awe inspiring pitch with this creative post implementation other operation and financial kpis ppt infographic template pdf bundle. Topics like operating income, revenue, customer satisfaction can be discussed with this completely editable template. It is available for immediate download depending on the needs and requirements of the user.

Computer Tablet With Graph Business PowerPoint Templates And PowerPoint Themes 1012
Computer Tablet With Graph Business PowerPoint Templates And PowerPoint Themes 1012-Develop competitive advantage with our above template which contains a diagram of computer tablet with bra graph showing success and growth. It portrays the concept of account, balance, business, data, economy, finance, graph, growth, information, investment, market, profit, report, research, statistics and success. Adjust the above image in your PPT presentations to visually support your content in your Business and Financial PPT slideshows. Present your views using our innovative slides and be assured of leaving a lasting impression.-Computer Tablet With Graph Business PowerPoint Templates And PowerPoint Themes 1012-This PowerPoint template can be used for presentations relating to-Computer Tablet With Graph, Arrows, Finance, Business, Marketing, Symbol

Company Quarterly Financial Highlights With Key Insights Ppt Styles Background Images PDF
This slide shows the graph related to quarterly decreasing trend of the net sales and operating profit margin for the year 2021, along with the key insights. Deliver an awe inspiring pitch with this creative company quarterly financial highlights with key insights ppt styles background images pdf bundle. Topics like company quarterly financial highlights with key insights can be discussed with this completely editable template. It is available for immediate download depending on the needs and requirements of the user.

Upselling Technique Additional Product Company Quarterly Financial Highlights Insights Template PDF
This slide shows the graph related to quarterly decreasing trend of the net sales and operating profit margin for the year 2020, along with the key insights Deliver and pitch your topic in the best possible manner with this upselling technique additional product company quarterly financial highlights insights template pdf. Use them to share invaluable insights on company quarterly financial highlights with key insights and impress your audience. This template can be altered and modified as per your expectations. So, grab it now.
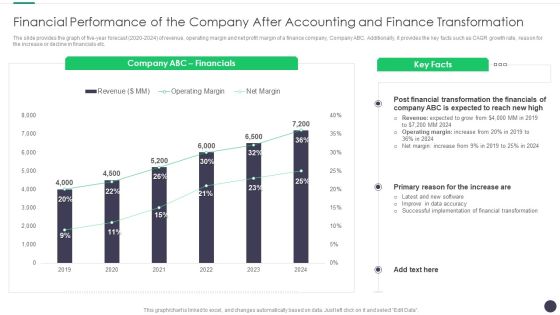
Finance And Accounting Online Conversion Plan Financial Performance Of The Company Brochure PDF
The slide provides the graph of five year forecast 2020 to 2024 of revenue, operating margin and net profit margin of a finance company, Company ABC. Additionally, it provides the key facts such as CAGR growth rate, reason for the increase or decline in financials etc. Deliver and pitch your topic in the best possible manner with this Finance And Accounting Online Conversion Plan Financial Performance Of The Company Brochure PDF. Use them to share invaluable insights on Company, Financials, Financial Transformation and impress your audience. This template can be altered and modified as per your expectations. So, grab it now.

Financial Performance Of The Company After Accounting And Finance Transformation Mockup PDF
The slide provides the graph of five year forecast 2020 to 2024 of revenue, operating margin and net profit margin of a finance company, Company ABC. Additionally, it provides the key facts such as CAGR growth rate, reason for the increase or decline in financials etc. Deliver and pitch your topic in the best possible manner with this Financial Performance Of The Company After Accounting And Finance Transformation Mockup PDF. Use them to share invaluable insights on Financial, Revenue, Margin, Implementation and impress your audience. This template can be altered and modified as per your expectations. So, grab it now.

Biotech Firm Investor Funding Addressing Financial Projections Of Biotech Platform Diagrams PDF
This slide caters details about financial projections of biotech platform in terms of total test performed, total revenues, total royalties, along with financial assumptions. Deliver and pitch your topic in the best possible manner with this biotech firm investor funding addressing financial projections of biotech platform diagrams pdf. Use them to share invaluable insights on financial assumptions, geographical presence, royalties, price, revenues and impress your audience. This template can be altered and modified as per your expectations. So, grab it now.

Biotechnology Startup Funding Elevator Pitch Deck Addressing Financial Projections Of Biotech Platform Designs PDF
This slide caters details about financial projections of biotech platform in terms of total test performed, total revenues, total royalties, along with financial assumptions.Deliver an awe inspiring pitch with this creative biotechnology startup funding elevator pitch deck addressing financial projections of biotech platform designs pdf bundle. Topics like addressing financial projections of biotech platform can be discussed with this completely editable template. It is available for immediate download depending on the needs and requirements of the user.

Fundraising Pitch Deck For Genetic Science Firms Addressing Financial Projections Of Biotech Introduction PDF
This slide caters details about financial projections of biotech platform in terms of total test performed, total revenues, total royalties, along with financial assumptions.Deliver an awe inspiring pitch with this creative Fundraising Pitch Deck For Genetic Science Firms Addressing Financial Projections Of Biotech Introduction PDF bundle. Topics like Financial Assumptions, Geographical Presence, Based On Diagnostics can be discussed with this completely editable template. It is available for immediate download depending on the needs and requirements of the user.

Achieving Proactive From Reactive Kpis For Financial Service Delivery Background PDF
This slide represents the KPIs for financial service delivery and how machine learning and AI can help to foresee the processes, insights that can benefit the financial sector. Deliver an awe inspiring pitch with this creative Achieving Proactive From Reactive Kpis For Financial Service Delivery Background PDF bundle. Topics like Financial KPI Dashboard, Current Working Capital, Working Capital can be discussed with this completely editable template. It is available for immediate download depending on the needs and requirements of the user.

Advance IT Service Delivery Kpis For Financial Service Delivery Ideas PDF
This slide represents the KPIs for financial service delivery and how machine learning and AI can help to foresee the processes, insights that can benefit the financial sector. Deliver an awe inspiring pitch with this creative advance it service delivery kpis for financial service delivery ideas pdf bundle. Topics like financial kpi dashboard, current working capital, cash conversion cycle can be discussed with this completely editable template. It is available for immediate download depending on the needs and requirements of the user.
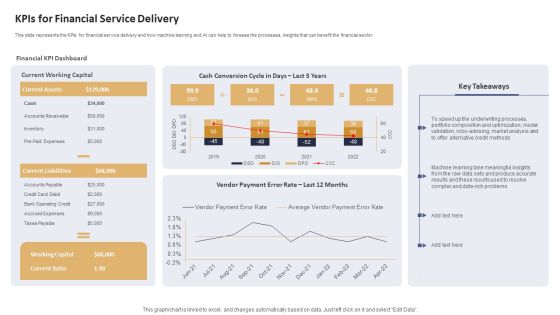
Data Processing Services Delivery Kpis For Financial Service Delivery Diagrams PDF
This slide represents the KPIs for financial service delivery and how machine learning and AI can help to foresee the processes, insights that can benefit the financial sector. Deliver an awe inspiring pitch with this creative Data Processing Services Delivery Kpis For Financial Service Delivery Diagrams PDF bundle. Topics like Financial KPI Dashboard, Current Working Capital, Cash Conversion can be discussed with this completely editable template. It is available for immediate download depending on the needs and requirements of the user.

Cyber Attacks Experienced By Company In Previous Financial Year IT Security IT Ppt Icon Information PDF
This slide shows the impact on the organizations financial condition due to cyber attacks in the past financial year 2021. Deliver and pitch your topic in the best possible manner with this cyber attacks experienced by company in previous financial year it security it ppt icon information pdf. Use them to share invaluable insights on cyber attacks experienced by company in previous financial year and impress your audience. This template can be altered and modified as per your expectations. So, grab it now.
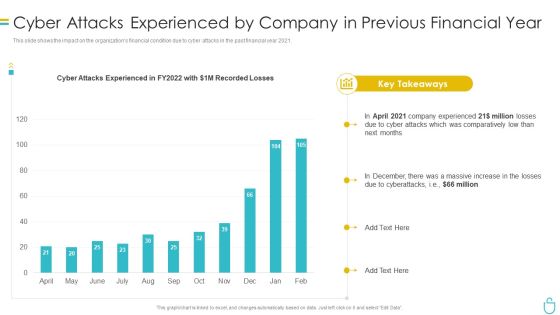
Information Security Cyber Attacks Experienced By Company In Previous Financial Year Ppt Summary Samples PDF
This slide shows the impact on the organizations financial condition due to cyber attacks in the past financial year 2021. Deliver and pitch your topic in the best possible manner with this information security cyber attacks experienced by company in previous financial year ppt summary samples pdf. Use them to share invaluable insights on cyber attacks experienced by company in previous financial year and impress your audience. This template can be altered and modified as per your expectations. So, grab it now.

Cybersecurity Cyber Attacks Experienced By Company In Previous Financial Year Ppt Layouts Infographic Template PDF
This slide shows the impact on the organizations financial condition due to cyber attacks in the past financial year 2022. Deliver and pitch your topic in the best possible manner with this cybersecurity cyber attacks experienced by company in previous financial year ppt layouts infographic template pdf. Use them to share invaluable insights on cyber attacks experienced by company in previous financial year and impress your audience. This template can be altered and modified as per your expectations. So, grab it now.
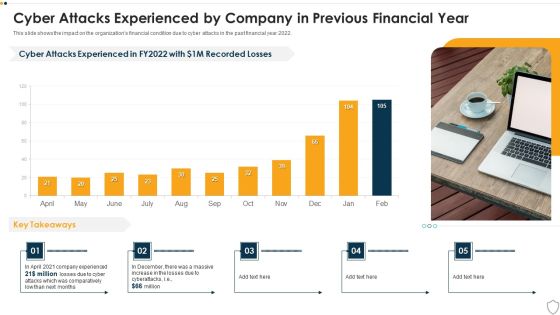
IT Security Cyber Attacks Experienced By Company In Previous Financial Year Ppt Outline Gallery PDF
This slide shows the impact on the organizations financial condition due to cyber attacks in the past financial year 2022. Deliver and pitch your topic in the best possible manner with this it security cyber attacks experienced by company in previous financial year ppt outline gallery pdf. Use them to share invaluable insights on cyber attacks experienced by company in previous financial year and impress your audience. This template can be altered and modified as per your expectations. So, grab it now.

Due Diligence Process In Merger And Acquisition Agreement Key Financial Highlights Inspiration PDF
This slide provides the financial highlights the key financial highlights of the firm. It covers gross profit margin, OPEX ratio, operating profit margin and net profit margin. Deliver and pitch your topic in the best possible manner with this due diligence process in merger and acquisition agreement key financial highlights inspiration pdf Use them to share invaluable insights on key financial highlights and impress your audience. This template can be altered and modified as per your expectations. So, grab it now.
Optimize Enterprise Core Assessing Financial Ratios Of Firm At Present Icons PDF
This slide portrays information regarding the assessment of financial ratios of firm. The financial ratios such as profitability ratio, asset management ratio and debt management ratio determines the firms financial performance. Deliver an awe inspiring pitch with this creative Optimize Enterprise Core Assessing Financial Ratios Of Firm At Present Icons PDF bundle. Topics like Profitability Ratio, Asset Management, Debt Management can be discussed with this completely editable template. It is available for immediate download depending on the needs and requirements of the user.

Proactive Consumer Solution And How To Perform It Kpis For Financial Service Delivery Designs PDF
This slide represents the KPIs for financial service delivery and how machine learning and AI can help to foresee the processes, insights that can benefit the financial sector.Deliver an awe inspiring pitch with this creative Proactive Consumer Solution And How To Perform It Kpis For Financial Service Delivery Designs PDF bundle. Topics like Financial Dashboard, Machine Learning, Portfolio Composition can be discussed with this completely editable template. It is available for immediate download depending on the needs and requirements of the user.

Company Profitability Financial Ratios Chart Comparison With Industry Average Download PDF
This slide illustrates graph for profitability ratio that can help to evaluate how efficiently a company generates profit and value for shareholders. It showcases ratio comparison of four companies with industry average Showcasing this set of slides titled company profitability financial ratios chart comparison with industry average download pdf. The topics addressed in these templates are company profitability financial ratios chart comparison with industry average. All the content presented in this PPT design is completely editable. Download it and make adjustments in color, background, font etc. as per your unique business setting.

Sales Promotion Of Upgraded Product Through Upselling Company Quarterly Financial Highlights With Key Insights Ideas PDF
This slide shows the graph related to quarterly decreasing trend of the net sales and operating profit margin for the year 2022, along with the key insights. Deliver an awe inspiring pitch with this creative sales promotion of upgraded product through upselling company quarterly financial highlights with key insights ideas pdf bundle. Topics like company quarterly financial highlights with key insights can be discussed with this completely editable template. It is available for immediate download depending on the needs and requirements of the user.
Key Financial Ratios Mergers And Acquisitions Synergy Ppt Icon Shapes PDF
The following key ratios shows the current financial condition of company. Deliver an awe inspiring pitch with this creative key financial ratios mergers and acquisitions synergy ppt icon shapes pdf bundle. Topics like key financial ratios can be discussed with this completely editable template. It is available for immediate download depending on the needs and requirements of the user.
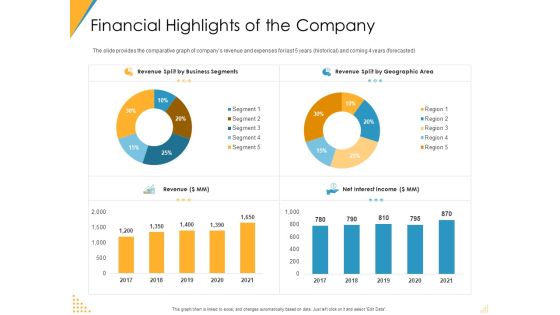
Investor Pitch Deck Post Market Financing Financial Highlights Of The Company Demonstration PDF
The slide provides the comparative graph of companys revenue and expenses for last 5 years historical and coming 4 years forecasted. Deliver an awe-inspiring pitch with this creative investor pitch deck post market financing financial highlights of the company demonstration pdf bundle. Topics like revenue, revenue split by business segments, revenue split by geographic area, net interest income can be discussed with this completely editable template. It is available for immediate download depending on the needs and requirements of the user.
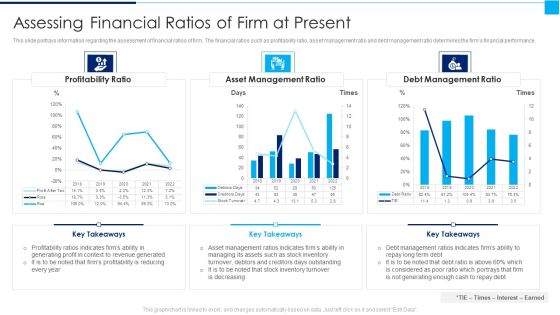
Ways To Enhance Organizations Profitability Assessing Financial Ratios Of Firm At Present Demonstration PDF
This slide portrays information regarding the assessment of financial ratios of firm. The financial ratios such as profitability ratio, asset management ratio and debt management ratio determines the firms financial performance.Deliver an awe inspiring pitch with this creative ways to enhance organizations profitability assessing financial ratios of firm at present demonstration pdf bundle. Topics like assessing financial ratios of firm at present can be discussed with this completely editable template. It is available for immediate download depending on the needs and requirements of the user.
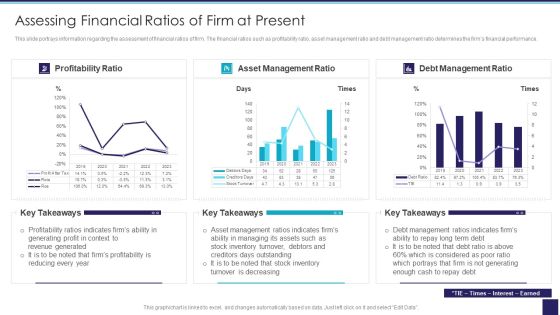
Organizational Issue Resolution Tool Assessing Financial Ratios Of Firm At Present Template PDF
This slide portrays information regarding the assessment of financial ratios of firm. The financial ratios such as profitability ratio, asset management ratio and debt management ratio determines the firms financial performance. Deliver and pitch your topic in the best possible manner with this Organizational Issue Resolution Tool Assessing Financial Ratios Of Firm At Present Template PDF. Use them to share invaluable insights on Profitability Ratio, Management Ratio, Assessing Financial and impress your audience. This template can be altered and modified as per your expectations. So, grab it now.

Healthcare Financial Analysis Scorecard Cost And Patient Ppt Pictures Rules PDF
This graph or chart is linked to excel, and changes automatically based on data. Just left click on it and select Edit Data. Deliver an awe inspiring pitch with this creative Healthcare Financial Analysis Scorecard Cost And Patient Ppt Pictures Rules PDF bundle. Topics like Total Patient Admissions, Average Stay Hosp, Cardiac Arrest Revenue, Total Patient Admitted can be discussed with this completely editable template. It is available for immediate download depending on the needs and requirements of the user.
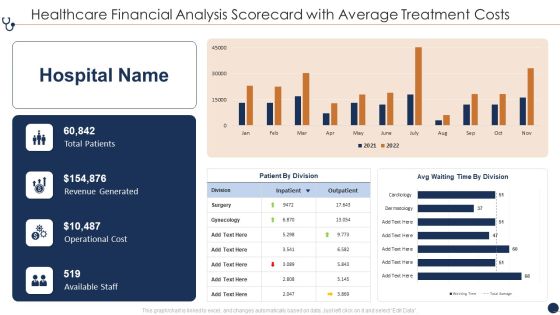
Healthcare Financial Analysis Scorecard With Average Treatment Costs Ppt Gallery Inspiration PDF
This graph or chart is linked to excel, and changes automatically based on data. Just left click on it and select Edit Data. Deliver and pitch your topic in the best possible manner with this Healthcare Financial Analysis Scorecard With Average Treatment Costs Ppt Gallery Inspiration PDF. Use them to share invaluable insights on Total Patients Revenue, Generated Operational Cost, Available Staff Outpatient and impress your audience. This template can be altered and modified as per your expectations. So, grab it now.

Healthcare Financial Analysis Scorecard With Outpatient Satisfaction Ppt Professional Background Image PDF
This graph or chart is linked to excel, and changes automatically based on data. Just left click on it and select Edit Data. Deliver and pitch your topic in the best possible manner with this Healthcare Financial Analysis Scorecard With Outpatient Satisfaction Ppt Professional Background Image PDF. Use them to share invaluable insights on Net Promoter Score, Outpatient Satisfaction Employee, Revenue Satisfaction Patients and impress your audience. This template can be altered and modified as per your expectations. So, grab it now.
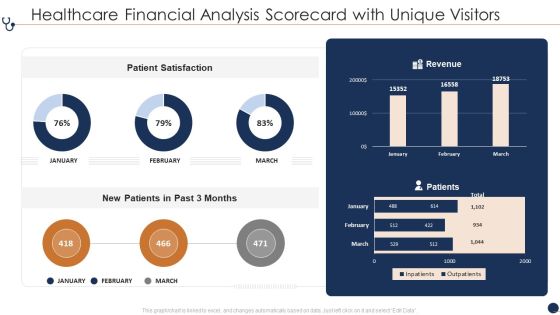
Healthcare Financial Analysis Scorecard With Unique Visitors Ppt File Visuals PDF
This graph or chart is linked to excel, and changes automatically based on data. Just left click on it and select Edit Data. Deliver an awe inspiring pitch with this creative Healthcare Financial Analysis Scorecard With Unique Visitors Ppt File Visuals PDF bundle. Topics like Patient Satisfaction Revenue, New Patients Past can be discussed with this completely editable template. It is available for immediate download depending on the needs and requirements of the user.

Return On Equity Indicators To Measure Company Financial Performance Mockup PDF
This slide showcases a graph of return on equity that represents how well the firm can manage the capital invested by shareholders. Pitch your topic with ease and precision using this Return On Equity Indicators To Measure Company Financial Performance Mockup PDF. This layout presents information on Return On Equity, Key Insights, Positive Return. It is also available for immediate download and adjustment. So, changes can be made in the color, design, graphics or any other component to create a unique layout.
Upselling Strategies For Business Quarterly Financial Highlights Ppt Icon Vector PDF
This graph shows the quarterly decreasing trend of the net sales and operating profit margin for FY 2019 along with key insights. Deliver and pitch your topic in the best possible manner with this upselling strategies for business quarterly financial highlights ppt icon vector pdf. Use them to share invaluable insights on techniques, cross selling, sales, profit margin and impress your audience. This template can be altered and modified as per your expectations. So, grab it now.

Summary Financial Accounting Statement Profit And Loss Analysis Dashboard Elements PDF
This graph or chart is linked to excel, and changes automatically based on data. Just left click on it and select Edit Data. Deliver an awe inspiring pitch with this creative Summary Financial Accounting Statement Profit And Loss Analysis Dashboard Elements PDF bundle. Topics like P And L Structure Dynamics, Dupont Rations, Debt Coverage Ratios, Creditworthiness Assessment can be discussed with this completely editable template. It is available for immediate download depending on the needs and requirements of the user.

Healthcare Financial Analysis Scorecard With Overall Patient Satisfaction Ppt File Graphics PDF
This graph or chart is linked to excel, and changes automatically based on data. Just left click on it and select Edit Data. Deliver an awe inspiring pitch with this creative Healthcare Financial Analysis Scorecard With Overall Patient Satisfaction Ppt File Graphics PDF bundle. Topics like Average Wait Times, Admission By Division, Admission Vs Cost, Overall Patient Satisfaction can be discussed with this completely editable template. It is available for immediate download depending on the needs and requirements of the user.
Healthcare Financial Analysis Scorecard With Turnover And Net Income Ppt Icon Show PDF
This graph or chart is linked to excel, and changes automatically based on data. Just left click on it and select Edit Data. Deliver and pitch your topic in the best possible manner with this Healthcare Financial Analysis Scorecard With Turnover And Net Income Ppt Icon Show PDF. Use them to share invaluable insights on Planned Turnover Net, 2016 To 2020 and impress your audience. This template can be altered and modified as per your expectations. So, grab it now.

Financial Performance Highlights With Net Profit Margin Ppt Model Ideas PDF
This graph or chart is linked to excel, and changes automatically based on data. Just left click on it and select Edit Data. Pitch your topic with ease and precision using this Financial Performance Highlights With Net Profit Margin Ppt Model Ideas PDF. This layout presents information on Net Profit, Accounts Receivable, Accounts Payable. It is also available for immediate download and adjustment. So, changes can be made in the color, design, graphics or any other component to create a unique layout.
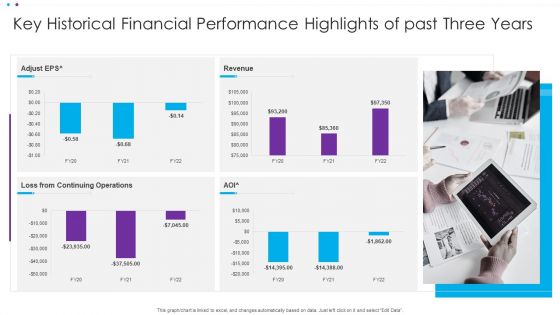
Key Historical Financial Performance Highlights Of Past Three Years Ppt Ideas Background PDF
This graph or chart is linked to excel, and changes automatically based on data. Just left click on it and select Edit Data. Showcasing this set of slides titled Key Historical Financial Performance Highlights Of Past Three Years Ppt Ideas Background PDF. The topics addressed in these templates are Continuing Operations, Adjust EP. All the content presented in this PPT design is completely editable. Download it and make adjustments in color, background, font etc. as per your unique business setting.
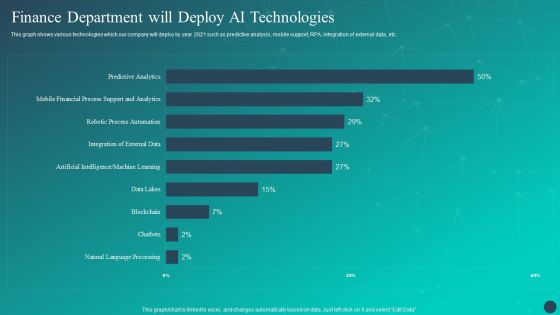
Optimizing AI Strategies To Improve Financial Services Finance Department Will Deploy AI Technologies Professional PDF
This graph shows various technologies which our company will deploy by year 2021 such as predictive analysis, mobile support, RPA, integration of external data, etc. There are so many reasons you need a Optimizing AI Strategies To Improve Financial Services Finance Department Will Deploy AI Technologies Professional PDF. The first reason is you can not spend time making everything from scratch, Thus, Slidegeeks has made presentation templates for you too. You can easily download these templates from our website easily.

Real Time Incident Management Solution Investor Funding Pitch Deck Financial Performance Information PDF
This slide showcases the financial performance of the company which provides an incident management platform with intelligent slack integration. It include graph that shows the annualized revenue of the company and NPS Net Promoter Score. Crafting an eye catching presentation has never been more straightforward. Let your presentation shine with this tasteful yet straightforward Real Time Incident Management Solution Investor Funding Pitch Deck Financial Performance Information PDF template. It offers a minimalistic and classy look that is great for making a statement. The colors have been employed intelligently to add a bit of playfulness while still remaining professional. Construct the ideal Real Time Incident Management Solution Investor Funding Pitch Deck Financial Performance Information PDF that effortlessly grabs the attention of your audience. Begin now and be certain to wow your customers.

Optimizing AI Strategies To Improve Financial Services Company Brand Value Over Time Formats PDF
This graph shows the current situation of our company, where it lies according to other brands. This leads to implementing AI in the organization. Presenting this PowerPoint presentation, titled Optimizing AI Strategies To Improve Financial Services Company Brand Value Over Time Formats PDF, with topics curated by our researchers after extensive research. This editable presentation is available for immediate download and provides attractive features when used. Download now and captivate your audience. Presenting this Optimizing AI Strategies To Improve Financial Services Company Brand Value Over Time Formats PDF. Our researchers have carefully researched and created these slides with all aspects taken into consideration. This is a completely customizable Optimizing AI Strategies To Improve Financial Services Company Brand Value Over Time Formats PDF that is available for immediate downloading. Download now and make an impact on your audience. Highlight the attractive features available with our PPTs.

Summary Financial Performance Of The Company After Accounting And Finance Ideas PDF
The slide provides the graph of five-year forecast 2020 to 2024 of revenue, operating margin and net profit margin of a finance company, Company ABC. Additionally, it provides the key facts such as CAGR growth rate, reason for the increase or decline in financials etc. Deliver and pitch your topic in the best possible manner with this Summary Financial Performance Of The Company After Accounting And Finance Ideas PDF. Use them to share invaluable insights on Financials, Revenue, Operating Margin, Net Margin, 2019 To 2024 and impress your audience. This template can be altered and modified as per your expectations. So, grab it now.
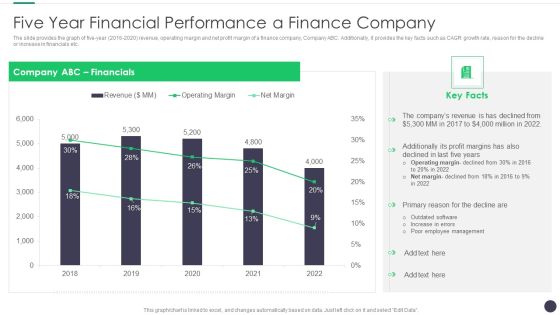
Finance And Accounting Online Conversion Plan Five Year Financial Performance A Finance Company Professional PDF
The slide provides the graph of five-year 2016 to 2020 revenue, operating margin and net profit margin of a finance company, Company ABC. Additionally, it provides the key facts such as CAGR growth rate, reason for the decline or increase in financials etc. Deliver and pitch your topic in the best possible manner with this Finance And Accounting Online Conversion Plan Five Year Financial Performance A Finance Company Professional PDF. Use them to share invaluable insights on Company, Financials, Revenue and impress your audience. This template can be altered and modified as per your expectations. So, grab it now.

 Home
Home