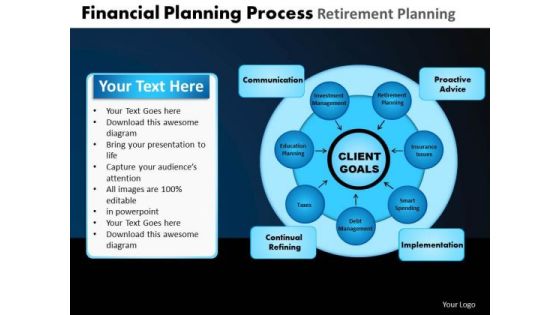
Financial Graphs

Circles With Business Deal Financial Strategy Icons Powerpoint Templates
This PPT slide displays diagram of circles with financial strategy icons. This PowerPoint template has been designed to exhibit how to work together to achieve a common goal. You can present your opinions using this impressive slide

3d Growth Graph Finance Business PowerPoint Templates Ppt Backgrounds For Slides 1212
We present our 3d Growth Graph Finance Business PowerPoint Templates PPT Backgrounds For Slides 1212.Use our Finance PowerPoint Templates because you have the ideas, you have got a brainwave. Use our Business PowerPoint Templates because you are sure you have the right people for your plans. Download our Marketing PowerPoint Templates because customer satisfaction is a mantra of the marketplace. Building a loyal client base is an essential element of your business. Use our Success PowerPoint Templates because you have the right arrows in your quiver. Present our New year PowerPoint Templates because you have the right attitude and great ideas to chart the way in the new year.Use these PowerPoint slides for presentations relating to Financial stat chart business graph, finance, business, new year, success, marketing. The prominent colors used in the PowerPoint template are Blue light, Green, Gray. We assure you our 3d Growth Graph Finance Business PowerPoint Templates PPT Backgrounds For Slides 1212 are Lush. Customers tell us our business PowerPoint templates and PPT Slides are Splendid. Customers tell us our 3d Growth Graph Finance Business PowerPoint Templates PPT Backgrounds For Slides 1212 are Sparkling. The feedback we get is that our graph PowerPoint templates and PPT Slides are second to none. PowerPoint presentation experts tell us our 3d Growth Graph Finance Business PowerPoint Templates PPT Backgrounds For Slides 1212 are Excellent. PowerPoint presentation experts tell us our business PowerPoint templates and PPT Slides are Functional.

Real Estate Property Graph PowerPoint Templates Ppt Backgrounds For Slides 0413
We present our Real Estate Property Graph PowerPoint Templates PPT Backgrounds For Slides 0413.Use our Real Estate PowerPoint Templates because It can Conjure up grand ideas with our magical PowerPoint Templates and Slides. Leave everyone awestruck by the end of your presentation. Present our People PowerPoint Templates because Our PowerPoint Templates and Slides are Clear and concise. Use them and dispel any doubts your team may have. Download and present our Finance PowerPoint Templates because Our PowerPoint Templates and Slides ensures Effective communication. They help you put across your views with precision and clarity. Use our Business PowerPoint Templates because Our PowerPoint Templates and Slides will steer your racing mind. Hit the right buttons and spur on your audience. Present our Marketing PowerPoint Templates because Our PowerPoint Templates and Slides help you pinpoint your timelines. Highlight the reasons for your deadlines with their use.Use these PowerPoint slides for presentations relating to Graph showing financial real estate, real estate, people, finance, business, marketing. The prominent colors used in the PowerPoint template are Red, Gray, White.

Line Comparison Graph For Yearly Liquidity Ratio Analysis Comparison Topics PDF
This slide showcases liquidity ratios graph that can help in identifying cash richness and financial position of organization. It showcases comparison for last 6 years and it key components are current ratio, quick ratio and cash ratio. Showcasing this set of slides titled Line Comparison Graph For Yearly Liquidity Ratio Analysis Comparison Topics PDF. The topics addressed in these templates are Term Financing, Cash Shortage, Cash Ratio. All the content presented in this PPT design is completely editable. Download it and make adjustments in color, background, font etc. as per your unique business setting.

Periodic Revenue Model Our Financial Performance Over The Year Themes PDF
The purpose of the following slide is to analyze the financial performance of the organization. The provided graph highlight the revenues, Gross profit and net profit margin of the organization for the year 2016,17,18 and 19. Create an editable Periodic Revenue Model Our Financial Performance Over The Year Themes PDF that communicates your idea and engages your audience. Whether youre presenting a business or an educational presentation, pre designed presentation templates help save time. Periodic Revenue Model Our Financial Performance Over The Year Themes PDF is highly customizable and very easy to edit, covering many different styles from creative to business presentations. Slidegeeks has creative team members who have crafted amazing templates. So, go and get them without any delay.

Deploying And Managing Recurring Our Financial Performance Over The Year Infographics PDF
The purpose of the following slide is to analyze the financial performance of the organization. The provided graph highlight the revenues, Gross profit and net profit margin of the organization for the year 2016,17,18 and 19. If you are looking for a format to display your unique thoughts, then the professionally designed Deploying And Managing Recurring Our Financial Performance Over The Year Infographics PDF is the one for you. You can use it as a Google Slides template or a PowerPoint template. Incorporate impressive visuals, symbols, images, and other charts. Modify or reorganize the text boxes as you desire. Experiment with shade schemes and font pairings. Alter, share or cooperate with other people on your work. Download Deploying And Managing Recurring Our Financial Performance Over The Year Infographics PDF and find out how to give a successful presentation. Present a perfect display to your team and make your presentation unforgettable.
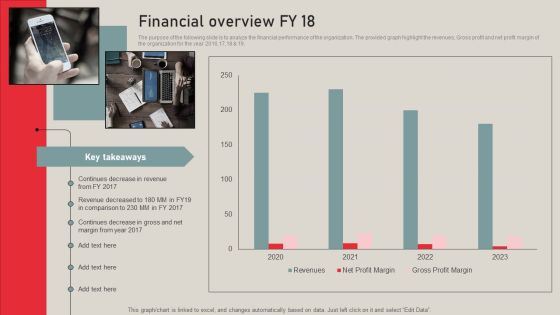
Individualized Pricing Approach For Managed Services Financial Overview FY 18 Structure PDF
The purpose of the following slide is to analyze the financial performance of the organization. The provided graph highlight the revenues, Gross profit and net profit margin of the organization for the year 2016,17,18 and 19. Create an editable Individualized Pricing Approach For Managed Services Financial Overview FY 18 Structure PDF that communicates your idea and engages your audience. Whether you are presenting a business or an educational presentation, pre designed presentation templates help save time. Individualized Pricing Approach For Managed Services Financial Overview FY 18 Structure PDF is highly customizable and very easy to edit, covering many different styles from creative to business presentations. Slidegeeks has creative team members who have crafted amazing templates. So, go and get them without any delay.

A LA Carte Business Strategy Financial Overview FY 18 Topics PDF
The purpose of the following slide is to analyze the financial performance of the organization. The provided graph highlight the revenues, Gross profit and net profit margin of the organization for the year 2016,17,18 and 19. This A LA Carte Business Strategy Financial Overview FY 18 Topics PDF is perfect for any presentation, be it in front of clients or colleagues. It is a versatile and stylish solution for organizing your meetings. The A LA Carte Business Strategy Financial Overview FY 18 Topics PDF features a modern design for your presentation meetings. The adjustable and customizable slides provide unlimited possibilities for acing up your presentation. Slidegeeks has done all the homework before launching the product for you. So, do not wait, grab the presentation templates today

Per Device Pricing Strategy For Managed Solutions Financial Overview FY23 Ideas PDF
The purpose of the following slide is to analyze the financial performance of the organization. The provided graph highlight the revenues, Gross profit and net profit margin of the organization for the year 2020,21,22 and 23. Find highly impressive Per Device Pricing Strategy For Managed Solutions Financial Overview FY23 Ideas PDF on Slidegeeks to deliver a meaningful presentation. You can save an ample amount of time using these presentation templates. No need to worry to prepare everything from scratch because Slidegeeks experts have already done a huge research and work for you. You need to download Per Device Pricing Strategy For Managed Solutions Financial Overview FY23 Ideas PDF for your upcoming presentation. All the presentation templates are 100 percent editable and you can change the color and personalize the content accordingly. Download now.
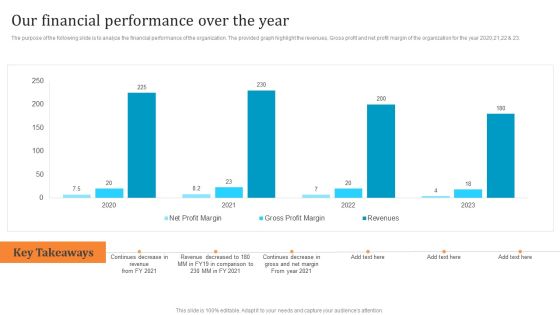
Membership Based Revenue Plan Our Financial Performance Over The Year Mockup PDF
The purpose of the following slide is to analyze the financial performance of the organization. The provided graph highlight the revenues, Gross profit and net profit margin of the organization for the year 2020,21,22 and 23. Are you in need of a template that can accommodate all of your creative concepts This one is crafted professionally and can be altered to fit any style. Use it with Google Slides or PowerPoint. Include striking photographs, symbols, depictions, and other visuals. Fill, move around, or remove text boxes as desired. Test out color palettes and font mixtures. Edit and save your work, or work with colleagues. Download Membership Based Revenue Plan Our Financial Performance Over The Year Mockup PDF and observe how to make your presentation outstanding. Give an impeccable presentation to your group and make your presentation unforgettable.
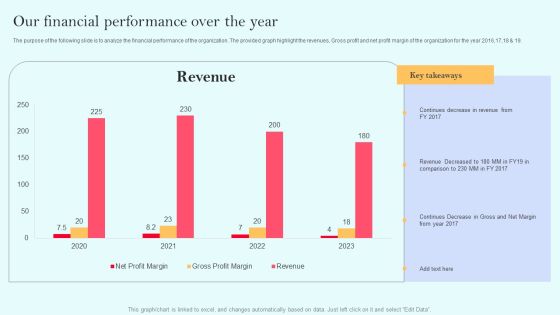
Recurring Income Generation Model Our Financial Performance Over The Year Clipart PDF
The purpose of the following slide is to analyze the financial performance of the organization. The provided graph highlight the revenues, Gross profit and net profit margin of the organization for the year 2016,17,18 and 19. Welcome to our selection of the Recurring Income Generation Model Our Financial Performance Over The Year Clipart PDF. These are designed to help you showcase your creativity and bring your sphere to life. Planning and Innovation are essential for any business that is just starting out. This collection contains the designs that you need for your everyday presentations. All of our PowerPoints are 100 percent editable, so you can customize them to suit your needs. This multi purpose template can be used in various situations. Grab these presentation templates today.

Saas Continuous Income Generation Model For Software Startup Our Financial Performance Over The Year Download PDF
The purpose of the following slide is to analyze the financial performance of the organization. The provided graph highlight the revenues, Gross profit and net profit margin of the organization for the year 2020,21,22 and 23. Welcome to our selection of the Saas Continuous Income Generation Model For Software Startup Our Financial Performance Over The Year Download PDF. These are designed to help you showcase your creativity and bring your sphere to life. Planning and Innovation are essential for any business that is just starting out. This collection contains the designs that you need for your everyday presentations. All of our PowerPoints are 100 percent editable, so you can customize them to suit your needs. This multi purpose template can be used in various situations. Grab these presentation templates today.
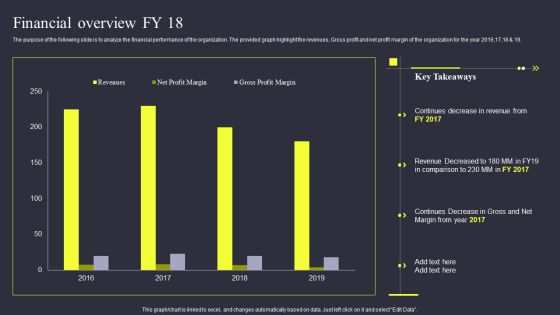
Strategies To Enhance Managed Service Business Financial Overview Fy 18 Information PDF
The purpose of the following slide is to analyze the financial performance of the organization. The provided graph highlight the revenues, Gross profit and net profit margin of the organization for the year 2016,17,18 and 19. Coming up with a presentation necessitates that the majority of the effort goes into the content and the message you intend to convey. The visuals of a PowerPoint presentation can only be effective if it supplements and supports the story that is being told. Keeping this in mind our experts created Strategies To Enhance Managed Service Business Financial Overview Fy 18 Information PDF to reduce the time that goes into designing the presentation. This way, you can concentrate on the message while our designers take care of providing you with the right template for the situation.

Consumption Based Pricing Model Our Financial Performance Over The Year Elements PDF
The purpose of the following slide is to analyze the financial performance of the organization. The provided graph highlight the revenues, gross profit and net profit margin of the organization for the year 2016,17,18 and 19. This Consumption Based Pricing Model Key Metrices For Forecasting In Recurring Revenue Model Clipart PDF is perfect for any presentation, be it in front of clients or colleagues. It is a versatile and stylish solution for organizing your meetings. The Consumption Based Pricing Model Key Metrices For Forecasting In Recurring Revenue Model Clipart PDF features a modern design for your presentation meetings. The adjustable and customizable slides provide unlimited possibilities for acing up your presentation. Slidegeeks has done all the homework before launching the product for you. So, do not wait, grab the presentation templates today

Assessing Financial And Capital Structure Of Organization Effective Planning For Monetary Microsoft PDF
This slide provides glimpse about current financing sources that our business is using to finance assets and run operations. It includes funding sources such as debt, equity capital, preferred stock, share of funding sources graph, etc.Retrieve professionally designed Assessing Financial And Capital Structure Of Organization Effective Planning For Monetary Microsoft PDF to effectively convey your message and captivate your listeners. Save time by selecting pre-made slideshows that are appropriate for various topics, from business to educational purposes. These themes come in many different styles, from creative to corporate, and all of them are easily adjustable and can be edited quickly. Access them as PowerPoint templates or as Google Slides themes. You do not have to go on a hunt for the perfect presentation because Slidegeeks got you covered from everywhere.

Financial Predictions Template Ppt PowerPoint Presentation Professional Objects
This is a financial predictions template ppt powerpoint presentation professional objects. This is a four stage process. The stages in this process are monthly breakeven, aggregate breakeven, graph, business, marketing.
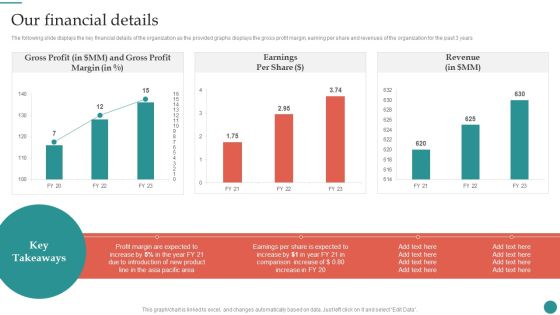
Our Financial Details Company Process Administration And Optimization Playbook Microsoft PDF
The following slide displays the key financial details of the organization as the provided graphs displays the gross profit margin, earning per share and revenues of the organization for the past 3 years.Crafting an eye-catching presentation has never been more straightforward. Let your presentation shine with this tasteful yet straightforward Our Financial Details Company Process Administration And Optimization Playbook Microsoft PDF template. It offers a minimalistic and classy look that is great for making a statement. The colors have been employed intelligently to add a bit of playfulness while still remaining professional. Construct the ideal Our Financial Details Company Process Administration And Optimization Playbook Microsoft PDF that effortlessly grabs the attention of your audience Begin now and be certain to wow your customers.
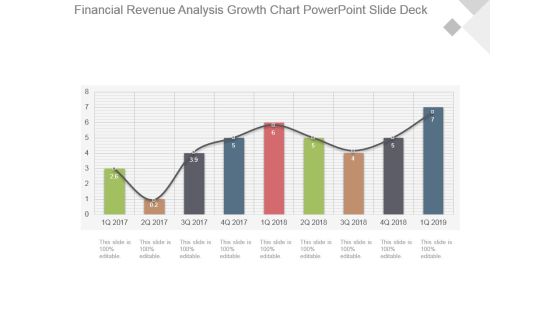
Financial Revenue Analysis Growth Chart Powerpoint Slide Deck
This is a financial revenue analysis growth chart powerpoint slide deck. This is a nine stage process. The stages in this process are growth, success, business, marketing, bar graph.
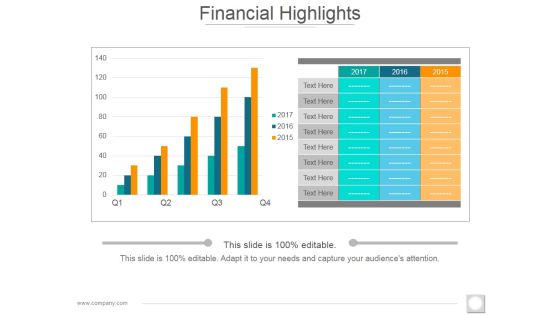
Financial Highlights Template 2 Ppt PowerPoint Presentation Slides Ideas
This is a financial highlights template 2 ppt powerpoint presentation slides ideas. This is a two stage process. The stages in this process are bar graph, growth, success, business, marketing.

Ppt Puzzle Financial Communication Process PowerPoint Presentation Flow Diagarm Templates
PPT puzzle financial communication process powerpoint presentation flow diagarm Templates-The above template contains a graphic of interlocking puzzle pieces. This diagram can be used to represent the relationship and interconnectivity between various concepts. -PPT puzzle financial communication process powerpoint presentation flow diagarm Templates-Abstract, Arrow, Backgrounds, Business, Computer, Concepts, Connection, Cooperation, Creativity, Crowd, Design, Digital, Digitally, Electric, Equalizer, Generated, Graph, Graphic, Group, Icon, Ideas, Illustration, Image, Individuality, Isolated, Leader, Leadership, Link, Motivation, Music, Objects, Order, Part, Pattern, Piece, Playing, Puzzle

Corporate Financial Strategy Key Elements Involved Portrait PDF
This slide showcases major elements which are crucial for organizations to include their strategic financial management. It provides details about financial resilience, financial capacity and capability, managing financial resources and coordinating. Create an editable Corporate Financial Strategy Key Elements Involved Portrait PDF that communicates your idea and engages your audience. Whether you are presenting a business or an educational presentation, pre-designed presentation templates help save time. Corporate Financial Strategy Key Elements Involved Portrait PDF is highly customizable and very easy to edit, covering many different styles from creative to business presentations. Slidegeeks has creative team members who have crafted amazing templates. So, go and get them without any delay.
Financial Analytics Vector Icon Ppt PowerPoint Presentation Ideas Objects
Presenting this set of slides with name financial analytics vector icon ppt powerpoint presentation ideas objects. The topics discussed in these slides are loss, decrease graph, stock market. This is a completely editable PowerPoint presentation and is available for immediate download. Download now and impress your audience.
Financial Downfall Vector Icon Ppt PowerPoint Presentation Slides Download
Presenting this set of slides with name financial downfall vector icon ppt powerpoint presentation slides download. This is a three stage process. The stages in this process are loss, decrease graph, stock market. This is a completely editable PowerPoint presentation and is available for immediate download. Download now and impress your audience.

Financial Activities To Ensure Coordination Across Organization Sample PDF
This slide showcases coordinating financial activities across organization to build comprehensive collaboration amongst stakeholders. It provides details about cross-functional teams, financial training, education, etc. Whether you have daily or monthly meetings, a brilliant presentation is necessary. Financial Activities To Ensure Coordination Across Organization Sample PDF can be your best option for delivering a presentation. Represent everything in detail using Financial Activities To Ensure Coordination Across Organization Sample PDF and make yourself stand out in meetings. The template is versatile and follows a structure that will cater to your requirements. All the templates prepared by Slidegeeks are easy to download and edit. Our research experts have taken care of the corporate themes as well. So, give it a try and see the results.
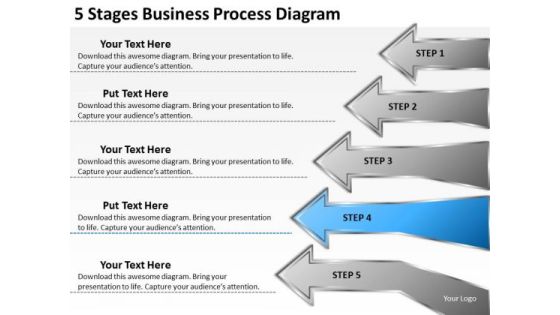
PowerPoint Presentation Process Diagram Financial Business Plan Templates
We present our powerpoint presentation process diagram financial business plan templates.Present our Arrows PowerPoint Templates because You can Channelise the thoughts of your team with our PowerPoint Templates and Slides. Urge them to focus on the goals you have set. Use our Leadership PowerPoint Templates because You have a driving passion to excel in your field. Our PowerPoint Templates and Slides will prove ideal vehicles for your ideas. Present our Shapes PowerPoint Templates because Our PowerPoint Templates and Slides will provide you the cutting edge. Slice through the doubts in the minds of your listeners. Download and present our Business PowerPoint Templates because Our PowerPoint Templates and Slides team portray an attitude of elegance. Personify this quality by using them regularly. Use our Process and Flows PowerPoint Templates because You should Bet on your luck with our PowerPoint Templates and Slides. Be assured that you will hit the jackpot.Use these PowerPoint slides for presentations relating to abstract, arrow, background, buttons, circle, clean, communication, concept, conceptual, design, diagram, direction, elements, exchange, flow, flowchart, graph, graphic, icon, illustration, internet, precise, process, red, sign, simple, symbol, ultimate, web. The prominent colors used in the PowerPoint template are Gray, Blue, Black. Presenters tell us our powerpoint presentation process diagram financial business plan templates are aesthetically designed to attract attention. We guarantee that they will grab all the eyeballs you need. PowerPoint presentation experts tell us our circle PowerPoint templates and PPT Slides will make the presenter successul in his career/life. People tell us our powerpoint presentation process diagram financial business plan templates are incredible easy to use. You can be sure our buttons PowerPoint templates and PPT Slides are effectively colour coded to prioritise your plans They automatically highlight the sequence of events you desire. The feedback we get is that our powerpoint presentation process diagram financial business plan templates are designed by professionals You can be sure our concept PowerPoint templates and PPT Slides will make the presenter successul in his career/life.

Financial Evaluation Report Project Location And Design Layout Clipart PDF
This slide explains about the location and design layout of the proposed project. It covers details about site location, its coordinates, elevation and area information of owned land and proposed land for project. Coming up with a presentation necessitates that the majority of the effort goes into the content and the message you intend to convey. The visuals of a PowerPoint presentation can only be effective if it supplements and supports the story that is being told. Keeping this in mind our experts created Financial Evaluation Report Project Location And Design Layout Clipart PDF to reduce the time that goes into designing the presentation. This way, you can concentrate on the message while our designers take care of providing you with the right template for the situation.

Financial Budget Ppt PowerPoint Presentation Complete Deck With Slides
Share a great deal of information on the topic by deploying this financial budget ppt powerpoint presentation complete deck with slides. Support your ideas and thought process with this prefabricated set. It includes a set of twelve slides, all fully modifiable and editable. Each slide can be restructured and induced with the information and content of your choice. You can add or remove large content boxes as well, to make this PPT slideshow more personalized. Its high-quality graphics and visuals help in presenting a well-coordinated pitch. This PPT template is also a resourceful tool to take visual cues from and implement the best ideas to help your business grow and expand. The main attraction of this well-formulated deck is that everything is editable, giving you the freedom to adjust it to your liking and choice. Changes can be made in the background and theme as well to deliver an outstanding pitch. Therefore, click on the download button now to gain full access to this multifunctional set.

Commercial Agreement Financial Project Ppt PowerPoint Presentation Complete Deck
Share a great deal of information on the topic by deploying this commercial agreement financial project ppt powerpoint presentation complete deck. Support your ideas and thought process with this prefabricated set. It includes a set of eleven slides, all fully modifiable and editable. Each slide can be restructured and induced with the information and content of your choice. You can add or remove large content boxes as well, to make this PPT slideshow more personalized. Its high-quality graphics and visuals help in presenting a well-coordinated pitch. This PPT template is also a resourceful tool to take visual cues from and implement the best ideas to help your business grow and expand. The main attraction of this well-formulated deck is that everything is editable, giving you the freedom to adjust it to your liking and choice. Changes can be made in the background and theme as well to deliver an outstanding pitch. Therefore, click on the download button now to gain full access to this multifunctional set.

Fund Raise Business Financial Ppt PowerPoint Presentation Complete Deck
Share a great deal of information on the topic by deploying this fund raise business financial ppt powerpoint presentation complete deck. Support your ideas and thought process with this prefabricated set. It includes a set of eleven slides, all fully modifiable and editable. Each slide can be restructured and induced with the information and content of your choice. You can add or remove large content boxes as well, to make this PPT slideshow more personalized. Its high-quality graphics and visuals help in presenting a well-coordinated pitch. This PPT template is also a resourceful tool to take visual cues from and implement the best ideas to help your business grow and expand. The main attraction of this well-formulated deck is that everything is editable, giving you the freedom to adjust it to your liking and choice. Changes can be made in the background and theme as well to deliver an outstanding pitch. Therefore, click on the download button now to gain full access to this multifunctional set.

Time Saving Financial Service Ppt PowerPoint Presentation Complete Deck
Share a great deal of information on the topic by deploying this time saving financial service ppt powerpoint presentation complete deck. Support your ideas and thought process with this prefabricated set. It includes a set of twelve slides, all fully modifiable and editable. Each slide can be restructured and induced with the information and content of your choice. You can add or remove large content boxes as well, to make this PPT slideshow more personalized. Its high-quality graphics and visuals help in presenting a well-coordinated pitch. This PPT template is also a resourceful tool to take visual cues from and implement the best ideas to help your business grow and expand. The main attraction of this well-formulated deck is that everything is editable, giving you the freedom to adjust it to your liking and choice. Changes can be made in the background and theme as well to deliver an outstanding pitch. Therefore, click on the download button now to gain full access to this multifunctional set.

Financial Challenges Ppt PowerPoint Presentation Complete Deck With Slides
Share a great deal of information on the topic by deploying this Financial Challenges Ppt PowerPoint Presentation Complete Deck With Slides. Support your ideas and thought process with this prefabricated set. It includes a set of fourteen slides, all fully modifiable and editable. Each slide can be restructured and induced with the information and content of your choice. You can add or remove large content boxes as well, to make this PPT slideshow more personalized. Its high-quality graphics and visuals help in presenting a well-coordinated pitch. This PPT template is also a resourceful tool to take visual cues from and implement the best ideas to help your business grow and expand. The main attraction of this well-formulated deck is that everything is editable, giving you the freedom to adjust it to your liking and choice. Changes can be made in the background and theme as well to deliver an outstanding pitch. Therefore, click on the download button now to gain full access to this multifunctional set.

Financial Sector Ppt PowerPoint Presentation Complete Deck With Slides
Share a great deal of information on the topic by deploying this Financial Sector Ppt PowerPoint Presentation Complete Deck With Slides. Support your ideas and thought process with this prefabricated set. It includes a set of twenty three slides, all fully modifiable and editable. Each slide can be restructured and induced with the information and content of your choice. You can add or remove large content boxes as well, to make this PPT slideshow more personalized. Its high-quality graphics and visuals help in presenting a well-coordinated pitch. This PPT template is also a resourceful tool to take visual cues from and implement the best ideas to help your business grow and expand. The main attraction of this well-formulated deck is that everything is editable, giving you the freedom to adjust it to your liking and choice. Changes can be made in the background and theme as well to deliver an outstanding pitch. Therefore, click on the download button now to gain full access to this multifunctional set.

Men At Work Business As Usual Graph Discussion PowerPoint Templates Ppt Backgrounds For Slides
We present our men at work business as usual graph discussion PowerPoint templates PPT backgrounds for slides.Use our Business PowerPoint Templates because Watching this your Audience will Grab their eyeballs, they wont even blink. Download and present our People PowerPoint Templates because Our PowerPoint Templates and Slides are effectively colour coded to prioritise your plans They automatically highlight the sequence of events you desire. Present our Success PowerPoint Templates because You can Stir your ideas in the cauldron of our PowerPoint Templates and Slides. Cast a magic spell on your audience. Present our Finance PowerPoint Templates because Our PowerPoint Templates and Slides help you meet the demand of the Market. Just browse and pick the slides that appeal to your intuitive senses. Download and present our Success PowerPoint Templates because You canTake a leap off the starting blocks with our PowerPoint Templates and Slides. They will put you ahead of the competition in quick time.Use these PowerPoint slides for presentations relating to 3d, accounting, achievement, ascending, bar, briefcase, businessman,businessmen, clipboard, colleagues, colourful, corporate, data, decisions,diagram, discuss, figure, finance, financial, forecast, gains, graph, green, group,growth, illustration, improvement, increasing, information, leader, leadership, men,performance, planning, presentation, profit, progress, projection, red, rising,series, show, statistics, strategy, success, team, teamwork, tie, yellow. The prominent colors used in the PowerPoint template are Blue , White, Green. We assure you our men at work business as usual graph discussion PowerPoint templates PPT backgrounds for slides help you meet deadlines which are an element of today's workplace. Just browse and pick the slides that appeal to your intuitive senses. You can be sure our bar PowerPoint templates and PPT Slides are topically designed to provide an attractive backdrop to any subject. Use our men at work business as usual graph discussion PowerPoint templates PPT backgrounds for slides effectively help you save your valuable time. We assure you our bar PowerPoint templates and PPT Slides will help them to explain complicated concepts. Use our men at work business as usual graph discussion PowerPoint templates PPT backgrounds for slides provide great value for your money. Be assured of finding the best projection to highlight your words. Professionals tell us our clipboard PowerPoint templates and PPT Slides will generate and maintain the level of interest you desire. They will create the impression you want to imprint on your audience.

Business People Clip Art 3d Men With Colorful Graph PowerPoint Slides
We present our business people clip art 3d men with colorful graph PowerPoint Slides.Download and present our Business PowerPoint Templates because Our PowerPoint Templates and Slides will let Your superior ideas hit the target always and everytime. Present our Shapes PowerPoint Templates because Our PowerPoint Templates and Slides will fulfill your every need. Use them and effectively satisfy the desires of your audience. Download our Success PowerPoint Templates because Our PowerPoint Templates and Slides will generate and maintain the level of interest you desire. They will create the impression you want to imprint on your audience. Download our Future PowerPoint Templates because They will Put the wind in your sails. Skim smoothly over the choppy waters of the market. Download our Marketing PowerPoint Templates because Our PowerPoint Templates and Slides will let you Leave a lasting impression to your audiences. They possess an inherent longstanding recall factor.Use these PowerPoint slides for presentations relating to 3d, accounting, analysis, bar,business,cartoon, character, chart, clipart, clipart, committee, company, concept,conceptual, corporate, council, directors, display, document, economics, executive,figure, finance, financial, goal, gold, graph, group, growth, guy, human, humanoid,man, management, market, meeting, office, percentage, performance, presentation, report, statistics, table, team. The prominent colors used in the PowerPoint template are Maroon, White, Black. Professionals tell us our business people clip art 3d men with colorful graph PowerPoint Slides provide you with a vast range of viable options. Select the appropriate ones and just fill in your text. Professionals tell us our analysis PowerPoint templates and PPT Slides are specially created by a professional team with vast experience. They diligently strive to come up with the right vehicle for your brilliant Ideas. People tell us our business people clip art 3d men with colorful graph PowerPoint Slides will make you look like a winner. Customers tell us our character PowerPoint templates and PPT Slides will help you be quick off the draw. Just enter your specific text and see your points hit home. The feedback we get is that our business people clip art 3d men with colorful graph PowerPoint Slides are effectively colour coded to prioritise your plans They automatically highlight the sequence of events you desire. Use our bar PowerPoint templates and PPT Slides will help you be quick off the draw. Just enter your specific text and see your points hit home.

Area Graph Showing Sales Trends Over Time Ppt PowerPoint Presentation Model Background Designs
This is a area graph showing sales trends over time ppt powerpoint presentation model background designs. This is a three stage process. The stages in this process are financial analysis, quantitative, statistical modelling.

Adjusting Financial Strategies And Planning Examining Business Ability To Pay Short Term Liabilities Guidelines PDF
This slide provides glimpse about current ratio analysis for calculating our firms capacity to clear our short term debt on time. It includes quarterly current ratio graph, quarterly quick ratio graph, etc. Welcome to our selection of the Adjusting Financial Strategies And Planning Examining Business Ability To Pay Short Term Liabilities Guidelines PDF. These are designed to help you showcase your creativity and bring your sphere to life. Planning and Innovation are essential for any business that is just starting out. This collection contains the designs that you need for your everyday presentations. All of our PowerPoints are 100 percent editable, so you can customize them to suit your needs. This multi purpose template can be used in various situations. Grab these presentation templates today.
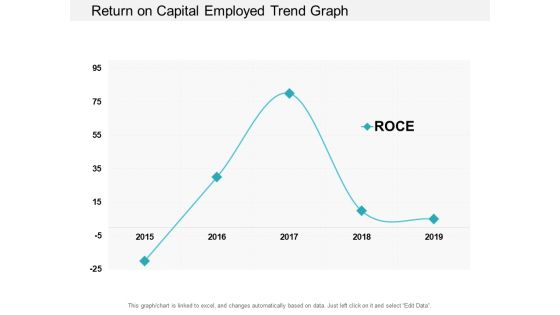
Return On Capital Employed Trend Graph Ppt PowerPoint Presentation Professional Example Topics
This is a return on capital employed trend graph ppt powerpoint presentation professional example topics. This is a one stage process. The stages in this process are accounting ratio, roce, return on capital employed.

Bar Graph Icon For Data Analysis Ppt PowerPoint Presentation Pictures Ideas
This is a bar graph icon for data analysis ppt powerpoint presentation pictures ideas. This is a four stage process. The stages in this process are financial analysis, quantitative, statistical modelling.

Houses Graph Made From Dollar Bills PowerPoint Templates Ppt Backgrounds For Slides 0213
We present our Houses Graph Made From Dollar Bills PowerPoint Templates PPT Backgrounds For Slides 0213.Present our Money PowerPoint Templates because You have the co-ordinates for your destination of success. Let our PowerPoint Templates and Slides map out your journey. Present our Finance PowerPoint Templates because You have a driving passion to excel in your field. Our PowerPoint Templates and Slides will prove ideal vehicles for your ideas. Download our Marketing PowerPoint Templates because Our PowerPoint Templates and Slides are effectively colour coded to prioritise your plans They automatically highlight the sequence of events you desire. Download and present our Future PowerPoint Templates because Our PowerPoint Templates and Slides will weave a web of your great ideas. They are gauranteed to attract even the most critical of your colleagues. Download our Success PowerPoint Templates because Our PowerPoint Templates and Slides are like the strings of a tennis racquet. Well strung to help you serve aces.Use these PowerPoint slides for presentations relating to House graph made from dollars bill financial, business, finance, money, future, success . The prominent colors used in the PowerPoint template are Green, Black, Gray.
Return On Capital Employed Graph Vector Icon Ppt PowerPoint Presentation Portfolio Design Inspiration
This is a return on capital employed graph vector icon ppt powerpoint presentation portfolio design inspiration. This is a three stage process. The stages in this process are accounting ratio, roce, return on capital employed.

Capital Fundraising And Financial Forecast Pitch Deck Company Overview Vision Mission And Financials Elements PDF
Following slide provides information about the company covering details about its vision, mission and financials. Financials covered are revenue in millions and EBITDA. Deliver an awe inspiring pitch with this creative capital fundraising and financial forecast pitch deck company overview vision mission and financials elements pdf bundle. Topics like company overview vision mission and financials can be discussed with this completely editable template. It is available for immediate download depending on the needs and requirements of the user.

BPO Managing Enterprise Financial Transactions Company Financials Dashboard Profit Diagrams PDF
Presenting this set of slides with name bpo managing enterprise financial transactions company financials dashboard profit diagrams pdf. The topics discussed in these slide is company financials dashboard. This is a completely editable PowerPoint presentation and is available for immediate download. Download now and impress your audience.

Outsource Bookkeeping Service Manage Financial Transactions Company Financials Dashboard Profit Information PDF
Presenting this set of slides with name outsource bookkeeping service manage financial transactions company financials dashboard profit information pdf. The topics discussed in these slide is company financials dashboard. This is a completely editable PowerPoint presentation and is available for immediate download. Download now and impress your audience.
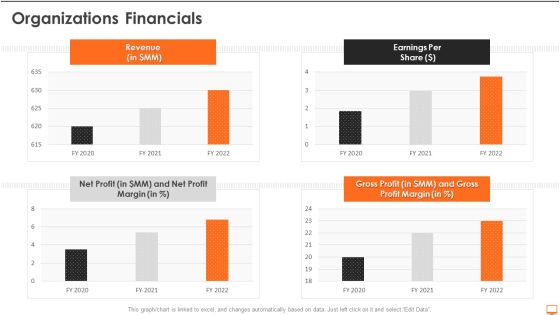
Financial Operational System Pitch Deck Organizations Financials Ppt Professional Aids PDF
Deliver an awe inspiring pitch with this creative financial operational system pitch deck organizations financials ppt professional aids pdf bundle. Topics like organizations financials can be discussed with this completely editable template. It is available for immediate download depending on the needs and requirements of the user.

Financial Services Enterprise Transformation Company Financials After The Implementation Rules PDF
This slide identifies the company Financials Total branches and total Research and development expenses of the ABC Bank after the successful implementation of the strategies.Deliver and pitch your topic in the best possible manner with this Financial Services Enterprise Transformation Company Financials After The Implementation Rules PDF Use them to share invaluable insights on Company Financials After The Implementation Of Strategies and impress your audience. This template can be altered and modified as per your expectations. So, grab it now.
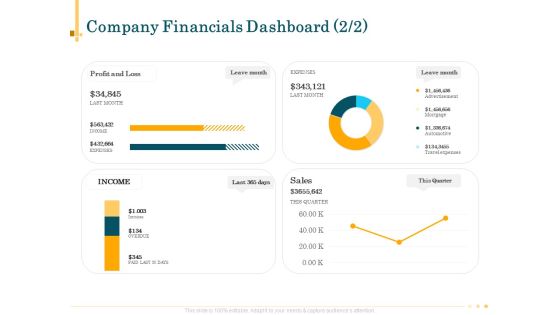
Outsource Bookkeeping Service Manage Financial Transactions Company Financials Dashboard Topics PDF
Presenting this set of slides with name outsource bookkeeping service manage financial transactions company financials dashboard topics pdf. The topics discussed in these slides are performance, revenue, expense, profit. This is a completely editable PowerPoint presentation and is available for immediate download. Download now and impress your audience.
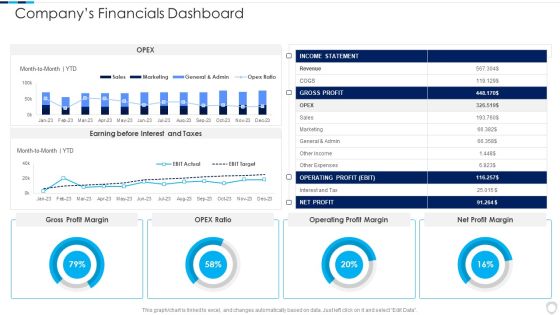
Financial Report Of An IT Firm Companys Financials Dashboard Infographics PDF
Deliver an awe inspiring pitch with this creative Financial Report Of An IT Firm Companys Financials Dashboard Infographics PDF bundle. Topics like Operating Profit, Gross Profit, Income Statement can be discussed with this completely editable template. It is available for immediate download depending on the needs and requirements of the user.
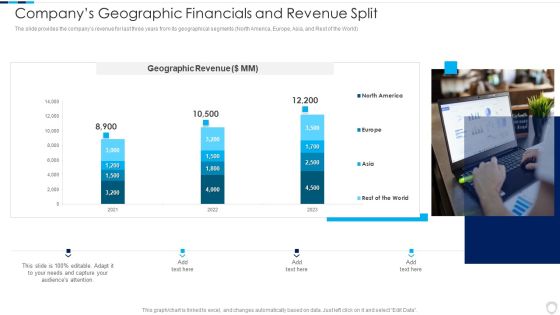
Financial Report Of An IT Firm Companys Geographic Financials And Revenue Split Elements PDF
The slide provides the companys revenue for last three years from its geographical segments North America, Europe, Asia, and Rest of the World.Deliver an awe inspiring pitch with this creative Financial Report Of An IT Firm Companys Geographic Financials And Revenue Split Elements PDF bundle. Topics like Companys Geographic, Financials Revenue can be discussed with this completely editable template. It is available for immediate download depending on the needs and requirements of the user.
Financial Report Of An IT Firm Companys Income Statement Financials Icons PDF
The slide provides the key financials revenue, operating income and margin, net income and margin from the companys income statement along with the basic details.Deliver an awe inspiring pitch with this creative Financial Report Of An IT Firm Companys Income Statement Financials Icons PDF bundle. Topics like Reported Strong, Operating Income, Operating Margin can be discussed with this completely editable template. It is available for immediate download depending on the needs and requirements of the user.
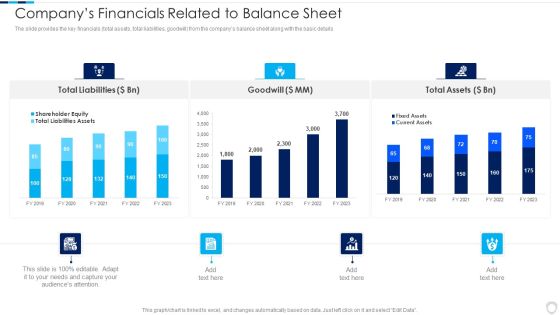
Financial Report Of An IT Firm Companys Financials Related To Balance Sheet Introduction PDF
The slide provides the key financials total assets, total liabilities, goodwill from the companys balance sheet along with the basic details.Deliver and pitch your topic in the best possible manner with this Financial Report Of An IT Firm Companys Financials Related To Balance Sheet Introduction PDF Use them to share invaluable insights on Total Liabilities, Total Assets, Liabilities Assets and impress your audience. This template can be altered and modified as per your expectations. So, grab it now.

Financial Report Of An IT Firm Companys Segment Financials And Revenue Split Rules PDF
The slide provides the companys revenue for last three years from three operating segments software for business customers, hardware products, and entertainment.Deliver an awe inspiring pitch with this creative Financial Report Of An IT Firm Companys Segment Financials And Revenue Split Rules PDF bundle. Topics like Software Business, Customers Entertainment, Hardware Products can be discussed with this completely editable template. It is available for immediate download depending on the needs and requirements of the user.
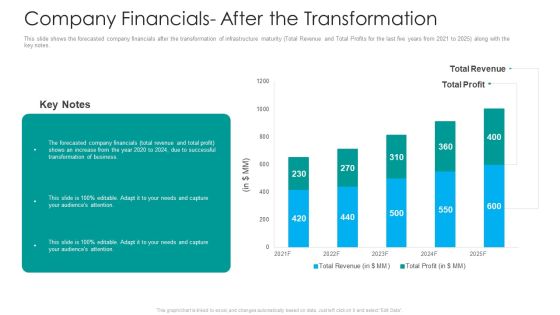
IT Facilities Maturity Framework For Strong Business Financial Position Company Financials After The Transformation Brochure PDF
This slide shows the forecasted company financials after the transformation of infrastructure maturity Total Revenue and Total Profits for the last five years from 2021 to 2025 along with the key notes. Deliver an awe inspiring pitch with this creative it facilities maturity framework for strong business financial position company financials after the transformation brochure pdf bundle. Topics like business, financials, revenue can be discussed with this completely editable template. It is available for immediate download depending on the needs and requirements of the user.

IT Facilities Maturity Framework For Strong Business Financial Position Historical Company Financials Before Microsoft PDF
This slide shows the company financials before the transformation in infrastructure maturity Total Revenue and Total Profits for the last five years from 2017 to 2021 along with the key notes. Deliver and pitch your topic in the best possible manner with this it facilities maturity framework for strong business financial position historical company financials before microsoft pdf. Use them to share invaluable insights on historical company financials before infrastructure transformation and impress your audience. This template can be altered and modified as per your expectations. So, grab it now.

Bar Graph With Arrow For Career Planning Ppt PowerPoint Presentation Gallery
This is a bar graph with arrow for career planning ppt powerpoint presentation gallery. This is a six stage process. The stages in this process are business, finance, marketing, strategy, planning, success, arrow.
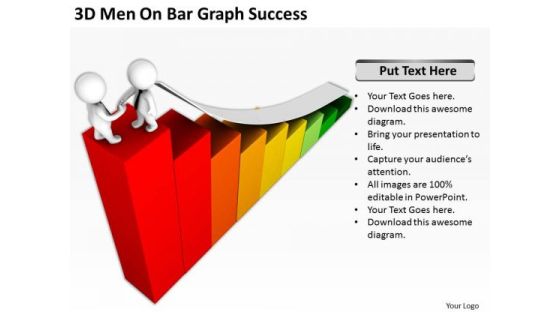
Business People Images 3d Men On Bar Graph Success PowerPoint Templates Ppt Backgrounds For Slides
We present our business people images 3d men on bar graph success PowerPoint templates PPT backgrounds for slides.Use our Finance PowerPoint Templates because You should Bet on your luck with our PowerPoint Templates and Slides. Be assured that you will hit the jackpot. Download and present our People PowerPoint Templates because Our PowerPoint Templates and Slides are created with admirable insight. Use them and give your group a sense of your logical mind. Use our Teamwork PowerPoint Templates because Our PowerPoint Templates and Slides team portray an attitude of elegance. Personify this quality by using them regularly. Use our Arrows PowerPoint Templates because Watching this your Audience will Grab their eyeballs, they wont even blink. Download our Success PowerPoint Templates because You can Zap them with our PowerPoint Templates and Slides. See them reel under the impact.Use these PowerPoint slides for presentations relating to Accounting, 3d, analyst, bar, business, chart, commerce, company, corporate, data, diagram, economy, factor, figure, finance, financial, forecast, futur, goal, gradient, graph, graphic, grow, growth, guy, human, illustration, image, industry, invest, market, money, people, progress, render, rendered, statistic, success, three-dimensional, vector, white, wireless. The prominent colors used in the PowerPoint template are Red, White, Green. Presenters tell us our business people images 3d men on bar graph success PowerPoint templates PPT backgrounds for slides will generate and maintain the level of interest you desire. They will create the impression you want to imprint on your audience. Professionals tell us our business PowerPoint templates and PPT Slides will get their audience's attention. Professionals tell us our business people images 3d men on bar graph success PowerPoint templates PPT backgrounds for slides provide you with a vast range of viable options. Select the appropriate ones and just fill in your text. We assure you our analyst PowerPoint templates and PPT Slides are designed by professionals You can be sure our business people images 3d men on bar graph success PowerPoint templates PPT backgrounds for slides will generate and maintain the level of interest you desire. They will create the impression you want to imprint on your audience. PowerPoint presentation experts tell us our analyst PowerPoint templates and PPT Slides are visually appealing.

Data Analysis Template Driven Line Chart Business Graph PowerPoint Slides Templates
Bottle Your Thoughts In Our data analysis template driven line chart business graph powerpoint slides Templates . Pass It Around For Your Audience To Sip.
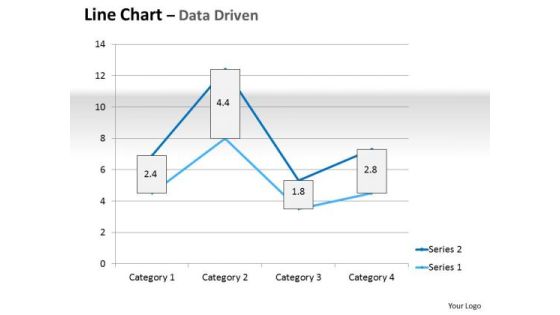
Multivariate Data Analysis Driven Line Chart Market Graph PowerPoint Slides Templates
Plan For All Contingencies With Our multivariate data analysis driven line chart market graph powerpoint slides Templates . Douse The Fire Before It Catches.

Business Diagram 3d Colorful Pie Graph With Magnifier Data Search PowerPoint Slide
This business slide displays 3d colorful pie graph with magnifier. This diagram is a data visualization tool that gives you a simple way to present statistical information. This slide helps your audience examine and interpret the data you present.
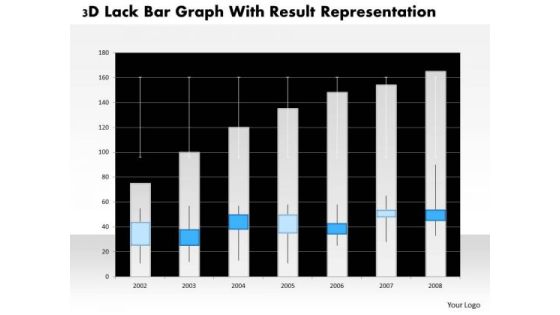
Business Diagram 3d Lack Bar Graph With Result Representation PowerPoint Slide
This business diagram has graphic of 3d lack bar graph. This diagram is a data visualization tool that gives you a simple way to present statistical information. This slide helps your audience examine and interpret the data you present.
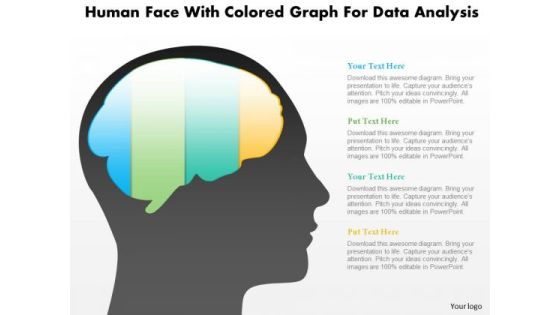
Business Diagram Human Face With Colored Graph For Data Analysis PowerPoint Slide
This diagram displays human face graphic with colored graph. This diagram can be used to represent strategy, planning, thinking of business plan. Display business options in your presentations by using this creative diagram.

Business Diagram 3d Lock With Pie Graph For Result Representation PowerPoint Slide
This Power Point diagram has been crafted with pie chart in shape of lock. It contains diagram of lock pie chart to compare and present data in an effective manner. Use this diagram to build professional presentations for your viewers.
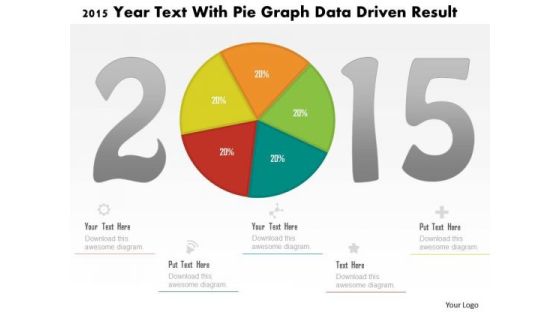
Business Diagram 2015 Year Text With Pie Graph Data Driven Result PowerPoint Slide
This business diagram displays 2015 year numbers with pie chart. This diagram is suitable to display business strategy for year 2015. Download this professional slide to present information in an attractive manner
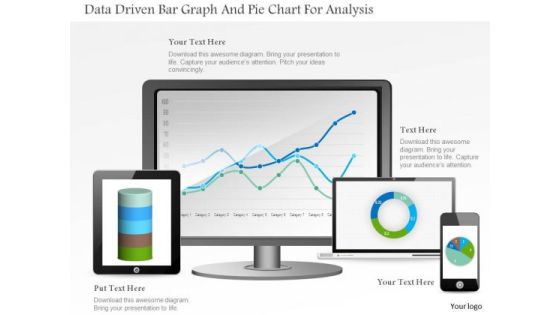
Business Diagram Data Driven Bar Graph And Pie Chart For Analysis PowerPoint Slide
This PowerPoint template displays technology gadgets with various business charts. Use this diagram slide, in your presentations to make business reports for statistical analysis. You may use this diagram to impart professional appearance to your presentations.
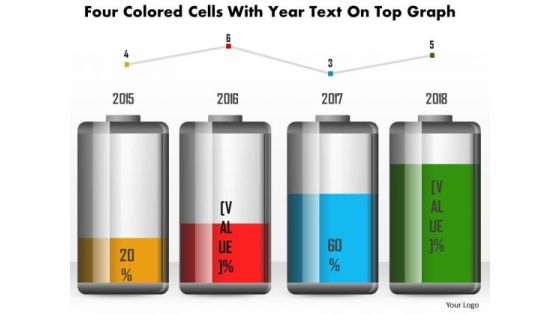
Business Diagram Four Colored Cells With Year Text On Top Graph PowerPoint Slide
This business diagram has been designed with battery cell graphic for business timeline. This slide can be used for business planning and management. Use this diagram for your business and success milestones related presentations.

Business Diagram Human Mind Diagram With Pie Graph For Representation PowerPoint Slide
This diagram displays human face graphic divided into sections. This section can be used for data display. Use this diagram to build professional presentations for your viewers.

Business Diagram Tablet With Pie And Business Bar Graph For Result Analysis PowerPoint Slide
This PowerPoint template displays technology gadgets with various business charts. Use this diagram slide, in your presentations to make business reports for statistical analysis. You may use this diagram to impart professional appearance to your presentations.

Business Diagram Three Staged Pencil Diagram For Graph Formation PowerPoint Slide
This business diagram displays set of pencils. This Power Point template has been designed to compare and present business data. Download this diagram to represent stages of business growth.

Business Diagram Two Tablets With Growth Bar Graph Data Driven PowerPoint Slide
This business diagram has been designed with comparative charts on tablets. This slide suitable for data representation. You can also use this slide to present business reports and information. Use this diagram to present your views in a wonderful manner.

Stages Diagram Illustrates Series Of Activities Business Financial Planning PowerPoint Slides
We present our stages diagram illustrates series of activities business financial planning PowerPoint Slides.Use our Arrows PowerPoint Templates because You can Be the star of the show with our PowerPoint Templates and Slides. Rock the stage with your ideas. Use our Leadership PowerPoint Templates because you should Experience excellence with our PowerPoint Templates and Slides. They will take your breath away. Download our Shapes PowerPoint Templates because It will get your audience in sync. Download our Business PowerPoint Templates because They will bring a lot to the table. Their alluring flavours will make your audience salivate. Download and present our Process and Flows PowerPoint Templates because Our PowerPoint Templates and Slides will provide you a launch platform. Give a lift off to your ideas and send them into orbit.Use these PowerPoint slides for presentations relating to abstract, achievement, action, arrow, arrowhead, aspiration, background, business, career, competition, concept, development, direction, dots, effect, financial, forecast, forward, graph, group, growth, idea, increase, investment, leader, leadership, moving, onwards, plan, prediction, price, profit, progress, property, sales, solution, speed, style, success, symbol, target, teamwork, vector, winner Activities. The prominent colors used in the PowerPoint template are Gray, Yellow, Black. Presenters tell us our stages diagram illustrates series of activities business financial planning PowerPoint Slides are specially created by a professional team with vast experience. They diligently strive to come up with the right vehicle for your brilliant Ideas. PowerPoint presentation experts tell us our action PowerPoint templates and PPT Slides will impress their bosses and teams. People tell us our stages diagram illustrates series of activities business financial planning PowerPoint Slides will generate and maintain the level of interest you desire. They will create the impression you want to imprint on your audience. You can be sure our career PowerPoint templates and PPT Slides are designed by a team of presentation professionals. The feedback we get is that our stages diagram illustrates series of activities business financial planning PowerPoint Slides are designed by professionals You can be sure our business PowerPoint templates and PPT Slides will help you be quick off the draw. Just enter your specific text and see your points hit home.

Bar Graph For Four Years Business Result Analysis Ppt PowerPoint Presentation Icon Show
Presenting this set of slides with name bar graph for four years business result analysis ppt powerpoint presentation icon show. The topics discussed in these slides are financial targets, financial goals, growth profitability. This is a completely editable PowerPoint presentation and is available for immediate download. Download now and impress your audience.
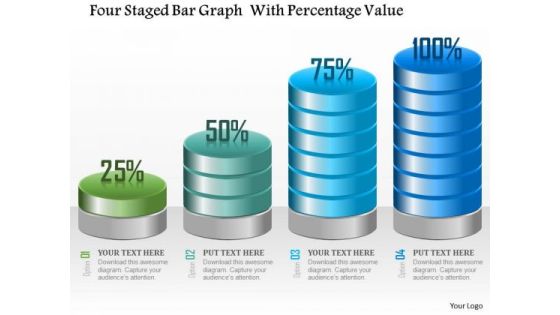
Business Diagram Four Staged Bar Graph With Percentage Value Presentation Template
Four staged bar graph with percentage value has been used to craft this power point template. This PPT contains the concept of making financial timeline and result analysis. This PPT can be used for business and finance related presentations.
Stock Market Trend Dollar Sign On Bar Graph Ppt Powerpoint Presentation Show Deck
This is a stock market trend dollar sign on bar graph ppt powerpoint presentation show deck. This is a four stage process. The stages in this process are stock market, financial market, bull market.

Stock Trading Graph With Bull Showing Upward Trend Ppt Powerpoint Presentation Pictures Outfit
This is a stock trading graph with bull showing upward trend ppt powerpoint presentation pictures outfit. This is a four stage process. The stages in this process are stock market, financial market, bull market.
Growth Arrow On Bar Graph Icon Ppt Powerpoint Presentation Infographic Template Clipart
This is a growth arrow on bar graph icon ppt powerpoint presentation infographic template clipart. This is a three stage process. The stages in this process are financial statements icon, accounting ratio icon, balance sheet icon.

Pie Graph Layer Showing Sector Wise Sales In 2022 Microsoft PDF
Pitch your topic with ease and precision using this pie graph layer showing sector wise sales in 2022 microsoft pdf. This layout presents information on consumer goods, information technology, automobile, financial services, engineering. It is also available for immediate download and adjustment. So, changes can be made in the color, design, graphics or any other component to create a unique layout.
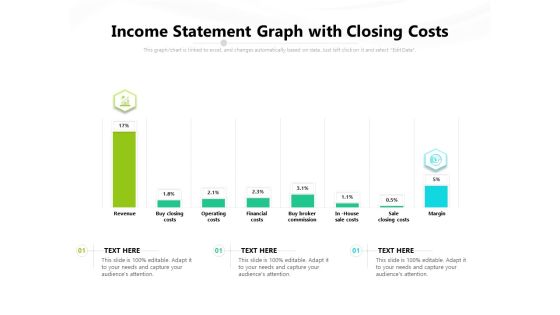
Income Statement Graph With Closing Costs Ppt PowerPoint Presentation Gallery Example Topics PDF
Presenting this set of slides with name income statement graph with closing costs ppt powerpoint presentation gallery example topics pdf. The topics discussed in these slides are revenue, buy closing costs, operating costs, financial costs, buy broker commission, in house sale costs, sale closing costs, margin. This is a completely editable PowerPoint presentation and is available for immediate download. Download now and impress your audience.

Learning And Experience Graph With Three Milestones Ppt PowerPoint Presentation Model Introduction
This is a learning and experience graph with three milestones ppt powerpoint presentation model introduction. This is a three stage process. The stages in this process are experience curve, learning curve.
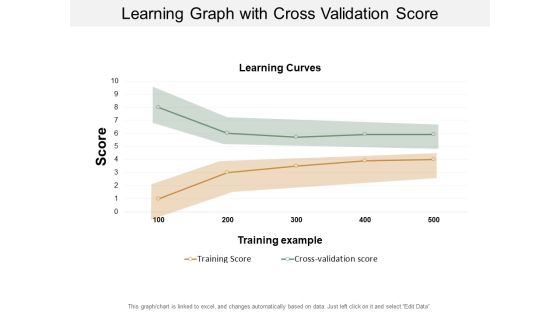
Learning Graph With Cross Validation Score Ppt PowerPoint Presentation Visual Aids Inspiration
This is a learning graph with cross validation score ppt powerpoint presentation visual aids inspiration. This is a two stage process. The stages in this process are experience curve, learning curve.
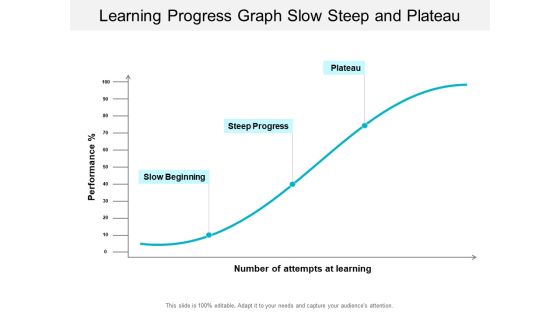
Learning Progress Graph Slow Steep And Plateau Ppt PowerPoint Presentation Professional Gallery
This is a learning progress graph slow steep and plateau ppt powerpoint presentation professional gallery. This is a three stage process. The stages in this process are experience curve, learning curve.

Bar Graph Icon For Research Analysis Ppt PowerPoint Presentation Summary Portfolio
Presenting this set of slides with name bar graph icon for research analysis ppt powerpoint presentation summary portfolio. This is a three stage process. The stages in this process are data visualization icon, research analysis, business focus. This is a completely editable PowerPoint presentation and is available for immediate download. Download now and impress your audience.

Bar Graph Companys Business Model Canvas Ppt PowerPoint Presentation Visual Aids Model
This is a bar graph companys business model canvas ppt powerpoint presentation visual aids model. This is a three stage process. The stages in this process are bar graph, finance, marketing, strategy, analysis, business.

Graph Showing Technical Analysis Of Stock Trading Ppt PowerPoint Presentation Infographic Template Portrait PDF
Presenting this set of slides with name graph showing technical analysis of stock trading ppt powerpoint presentation infographic template portrait pdf. This is a three stage process. The stages in this process are graph showing technical analysis of stock trading. This is a completely editable PowerPoint presentation and is available for immediate download. Download now and impress your audience.
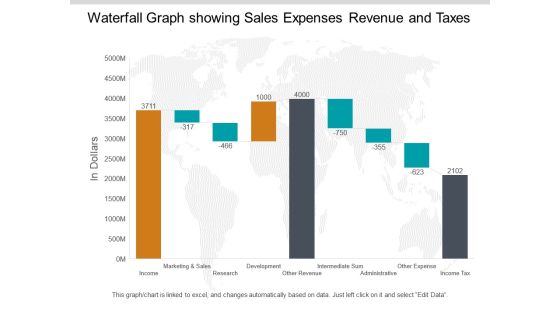
Waterfall Graph Showing Sales Expenses Revenue And Taxes Ppt PowerPoint Presentation Pictures Summary
This is a waterfall graph showing sales expenses revenue and taxes ppt powerpoint presentation pictures summary. This is a three stage process. The stages in this process are profit and loss, balance sheet, income statement, benefit and loss.
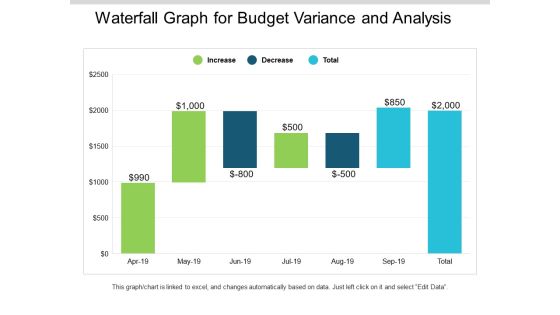
Waterfall Graph For Budget Variance And Analysis Ppt PowerPoint Presentation Slides Mockup
This is a waterfall graph for budget variance and analysis ppt powerpoint presentation slides mockup. This is a three stage process. The stages in this process are profit and loss, balance sheet, income statement, benefit and loss.

Waterfall Graph Summarize Budget 2018 To 2019 Ppt PowerPoint Presentation Summary Slides
This is a waterfall graph summarize budget 2018 to 2019 ppt powerpoint presentation summary slides. This is a three stage process. The stages in this process are profit and loss, balance sheet, income statement, benefit and loss.
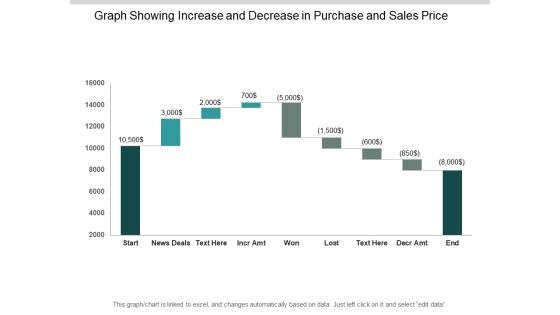
Graph Showing Increase And Decrease In Purchase And Sales Price Ppt PowerPoint Presentation Outline Gallery
This is a graph showing increase and decrease in purchase and sales price ppt powerpoint presentation outline gallery. This is a nine stage process. The stages in this process are sales waterfall, waterfall chart, business.

Sales Graph Showing Payouts Losses And Wins Ppt PowerPoint Presentation Pictures Designs Download
This is a sales graph showing payouts losses and wins ppt powerpoint presentation pictures designs download. This is a eight stage process. The stages in this process are sales waterfall, waterfall chart, business.

Waterfall Graph For Income And Expense Analysis Ppt PowerPoint Presentation File Deck
This is a waterfall graph for income and expense analysis ppt powerpoint presentation file deck. This is a eight stage process. The stages in this process are sales waterfall, waterfall chart, business.

Waterfall Graph Showing Births Deaths And Population Change Ppt PowerPoint Presentation Infographic Template Visual Aids
This is a waterfall graph showing births deaths and population change ppt powerpoint presentation infographic template visual aids. This is a three stage process. The stages in this process are profit and loss, balance sheet, income statement, benefit and loss.

Waterfall Graph Showing Net Sales And Gross Profit Ppt PowerPoint Presentation Infographics Format
This is a waterfall graph showing net sales and gross profit ppt powerpoint presentation infographics format. This is a three stage process. The stages in this process are profit and loss, balance sheet, income statement, benefit and loss.
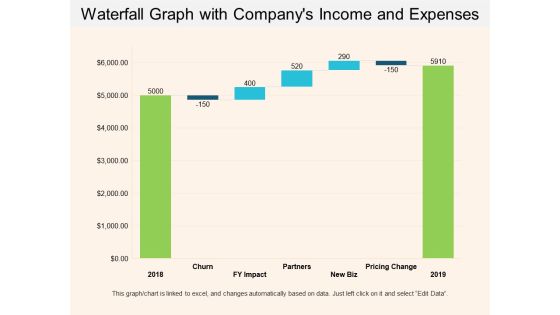
Waterfall Graph With Companys Income And Expenses Ppt PowerPoint Presentation Show Example Introduction
This is a waterfall graph with companys income and expenses ppt powerpoint presentation show example introduction. This is a three stage process. The stages in this process are profit and loss, balance sheet, income statement, benefit and loss.

Waterfall Graph With Monthly Expenses And Savings Ppt PowerPoint Presentation Layouts Clipart Images
This is a waterfall graph with monthly expenses and savings ppt powerpoint presentation layouts clipart images. This is a three stage process. The stages in this process are profit and loss, balance sheet, income statement, benefit and loss.

Bar Graph Finance Planning Ppt PowerPoint Presentation Infographic Template Master Slide
This is a bar graph finance planning ppt powerpoint presentation infographic template master slide. This is a two stage process. The stages in this process are finance, analysis, business, investment, marketing.
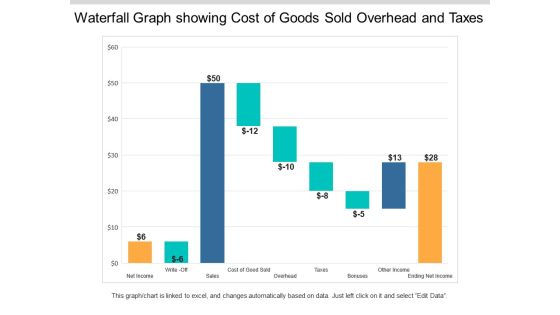
Waterfall Graph Showing Cost Of Goods Sold Overhead And Taxes Ppt PowerPoint Presentation Styles Example Topics
This is a waterfall graph showing cost of goods sold overhead and taxes ppt powerpoint presentation styles example topics. This is a three stage process. The stages in this process are profit and loss, balance sheet, income statement, benefit and loss.

Current And Quick Ratio Comparison Graph For Liquidity Assessment Structure PDF
This slide showcases current and quick ratio graph that can help to evaluate companys liquidity and and assess the company abilities to pay off debt. It also showcases comparison of ratio with previous financial year. Showcasing this set of slides titled Current And Quick Ratio Comparison Graph For Liquidity Assessment Structure PDF. The topics addressed in these templates are Short Term Debt, Delayed Payments, Cash Shortage. All the content presented in this PPT design is completely editable. Download it and make adjustments in color, background, font etc. as per your unique business setting.

6 Year Revenue Declining Graph Ppt PowerPoint Presentation Outline Sample PDF
This slide shows the revenues of the company over the last years to have a clear idea of organization growth and financial status . It includes the 6 year 2017 to 2022 revenue earned by the company.Showcasing this set of slides titled 6 Year Revenue Declining Graph Ppt PowerPoint Presentation Outline Sample PDF. The topics addressed in these templates are Revenue Company, Highest Comparison, Conditions Restrictions. All the content presented in this PPT design is completely editable. Download it and make adjustments in color, background, font etc. as per your unique business setting.

Yearly Net Income Statement Graph With Revenue And Operating Profit Margin Download PDF
This slide showcases chart that can help organization compare and analyze the operating profits generated by organization in different financial years. It also showcases yearly comparison of net income, revenue and operating profit margin. Pitch your topic with ease and precision using this Yearly Net Income Statement Graph With Revenue And Operating Profit Margin Download PDF. This layout presents information on Revenue, Net Income, Operating Profit Margin. It is also available for immediate download and adjustment. So, changes can be made in the color, design, graphics or any other component to create a unique layout.

Oil Barrel With Finance Graph Industrial PowerPoint Templates And PowerPoint Themes 1012
The above template displays a diagram of black barrels of oil by a colorful bar graph with an arrow. This image signifies business concept. This image has been conceived to enable you to emphatically communicate your ideas in your Business and Financial PPT presentation. Our PPT images are so perfectly/ideally designed that it reveals the very basis of our PPT template to make your clients understand.
Graph For Money Flow Assessment With Magnifying Glass Ppt PowerPoint Presentation Gallery Design Templates PDF
Presenting this set of slides with name graph for money flow assessment with magnifying glass ppt powerpoint presentation gallery design templates pdf. This is a three stage process. The stages in this process are graph for money flow assessment with magnifying glass. This is a completely editable PowerPoint presentation and is available for immediate download. Download now and impress your audience.
Money Flow Liquidity Icon With Dollar Symbol And Graph Formats PDF
Presenting money flow liquidity icon with dollar symbol and graph formats pdf to dispense important information. This template comprises four stages. It also presents valuable insights into the topics including money flow liquidity icon with dollar symbol and graph. This is a completely customizable PowerPoint theme that can be put to use immediately. So, download it and address the topic impactfully.

Bar Graph Showing Growth In Money Flow Ppt PowerPoint Presentation File Show PDF
Presenting this set of slides with name bar graph showing growth in money flow ppt powerpoint presentation file show pdf. This is a three stage process. The stages in this process are bar graph showing growth in money flow. This is a completely editable PowerPoint presentation and is available for immediate download. Download now and impress your audience.

Bar Graph Showing Negative Trend Ppt PowerPoint Presentation Summary Master Slide
Presenting this set of slides with name bar graph showing negative trend ppt powerpoint presentation summary master slide. This is a one stage process. The stages in this process are bar graph showing negative trend. This is a completely editable PowerPoint presentation and is available for immediate download. Download now and impress your audience.

Bar Graph Analyzing Company Performance Vector Icon Ppt PowerPoint Presentation Ideas Slides PDF
Presenting this set of slides with name bar graph analyzing company performance vector icon ppt powerpoint presentation ideas slides pdf. This is a three stage process. The stages in this process are bar graph analyzing company performance vector icon. This is a completely editable PowerPoint presentation and is available for immediate download. Download now and impress your audience.

Bar Graph Showing Business Performance With Downward Arrow Ppt PowerPoint Presentation Show Format Ideas PDF
Presenting this set of slides with name bar graph showing business performance with downward arrow ppt powerpoint presentation show format ideas pdf. This is a three stage process. The stages in this process are bar graph showing business performance with downward arrow. This is a completely editable PowerPoint presentation and is available for immediate download. Download now and impress your audience.
Downward Arrow Trend Graph Vector Icon Ppt PowerPoint Presentation Pictures PDF
Presenting this set of slides with name downward arrow trend graph vector icon ppt powerpoint presentation pictures pdf. This is a three stage process. The stages in this process are downward arrow trend graph vector icon. This is a completely editable PowerPoint presentation and is available for immediate download. Download now and impress your audience.

Bar Graph Showing Business Loss Vector Icon Ppt PowerPoint Presentation Gallery Example Topics PDF
Presenting this set of slides with name bar graph showing business loss vector icon ppt powerpoint presentation gallery example topics pdf. This is a three stage process. The stages in this process are bar graph showing business loss vector icon. This is a completely editable PowerPoint presentation and is available for immediate download. Download now and impress your audience.

Business Graph Showing Company Growth Vector Icon Ppt PowerPoint Presentation Gallery Slide Portrait PDF
Presenting this set of slides with name business graph showing company growth vector icon ppt powerpoint presentation gallery slide portrait pdf. This is a three stage process. The stages in this process are business graph showing company growth vector icon. This is a completely editable PowerPoint presentation and is available for immediate download. Download now and impress your audience.

Company Share Analysis Pie Graph Ppt PowerPoint Presentation Styles Slides PDF
Presenting this set of slides with name company share analysis pie graph ppt powerpoint presentation styles slides pdf. This is a four stage process. The stages in this process are company share analysis pie graph. This is a completely editable PowerPoint presentation and is available for immediate download. Download now and impress your audience.

Monitoring Showing Stock Trading And Analysis Graph Ppt PowerPoint Presentation Ideas Slideshow PDF
Presenting this set of slides with name monitoring showing stock trading and analysis graph ppt powerpoint presentation ideas slideshow pdf. This is a one stage process. The stage in this process is monitoring showing stock trading and analysis graph. This is a completely editable PowerPoint presentation and is available for immediate download. Download now and impress your audience.
Dollar Graph For Sale Growth Ppt PowerPoint Presentation Gallery Example PDF
Presenting dollar graph for sale growth ppt powerpoint presentation gallery example pdf to dispense important information. This template comprises four stages. It also presents valuable insights into the topics including dollar graph for sale growth. This is a completely customizable PowerPoint theme that can be put to use immediately. So, download it and address the topic impactfully.
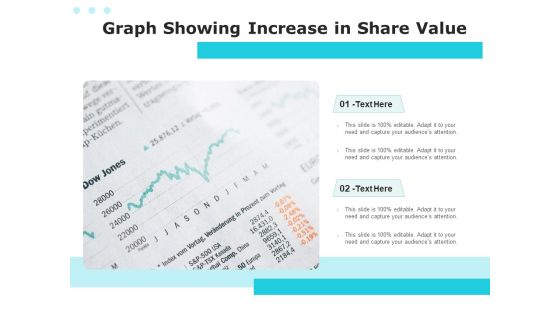
Graph Showing Increase In Share Value Ppt PowerPoint Presentation Backgrounds PDF
Presenting graph showing increase in share value ppt powerpoint presentation backgrounds pdf to dispense important information. This template comprises two stages. It also presents valuable insights into the topics including graph showing increase in share value. This is a completely customizable PowerPoint theme that can be put to use immediately. So, download it and address the topic impactfully.

Bar Graph For Sales Revenue Over The Years Ppt PowerPoint Presentation Professional
This is a bar graph for sales revenue over the years ppt powerpoint presentation professional. This is a nine stage process. The stages in this process are business, marketing, growth, bar, years.
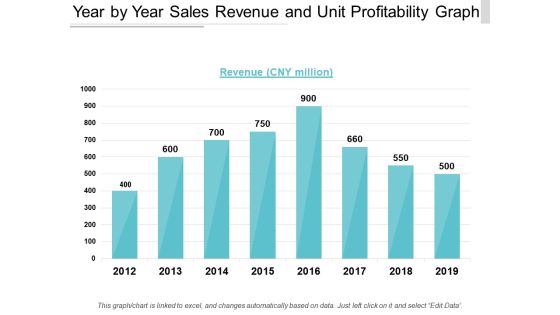
Year By Year Sales Revenue And Unit Profitability Graph Ppt PowerPoint Presentation Show Professional
This is a year by year sales revenue and unit profitability graph ppt powerpoint presentation show professional. This is a eight stage process. The stages in this process are business unit profitability, profitable organization, corporate unit profitability.
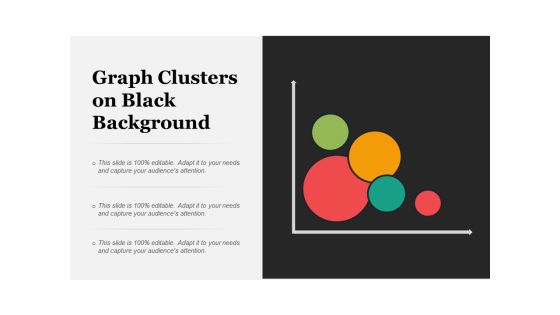
Graph Clusters On Black Background Ppt PowerPoint Presentation Ideas Slide Portrait
This is a graph clusters on black background ppt powerpoint presentation ideas slide portrait. This is a four stage process. The stages in this process are radial cluster diagram, radial circular diagram, radial circle diagram.
Bar Graph Icon Showing Operating Rhythm Ppt Powerpoint Presentation Ideas Templates
This is a bar graph icon showing operating rhythm ppt powerpoint presentation ideas templates. This is a three stage process. The stages in this process are six sigma, operating rhythm, business rhythm.
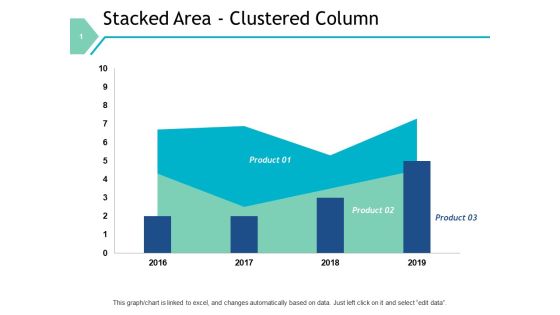
Stacked Area Clustered Column Graph Ppt PowerPoint Presentation File Designs Download
This is a stacked area clustered column graph ppt powerpoint presentation file designs download. This is a three stage process. The stages in this process are finance, marketing, management, investment, analysis.

Business Fluctuations Graph With Two Arrow Ppt PowerPoint Presentation Tips PDF
Persuade your audience using this business fluctuations graph with two arrow ppt powerpoint presentation tips pdf. This PPT design covers three stages, thus making it a great tool to use. It also caters to a variety of topics including business fluctuations graph with two arrow. Download this PPT design now to present a convincing pitch that not only emphasizes the topic but also showcases your presentation skills.

Stock Market Growth Rate Graph Image Ppt PowerPoint Presentation Professional Influencers PDF
Persuade your audience using this stock market growth rate graph image ppt powerpoint presentation professional influencers pdf. This PPT design covers two stages, thus making it a great tool to use. It also caters to a variety of topics including stock market growth rate graph image. Download this PPT design now to present a convincing pitch that not only emphasizes the topic but also showcases your presentation skills.

Bar Graph With Arrows For Data Representation Vector Icon Ppt PowerPoint Presentation Summary Picture PDF
Presenting bar graph with arrows for data representation vector icon ppt powerpoint presentation summary picture pdf to dispense important information. This template comprises three stages. It also presents valuable insights into the topics including bar graph with arrows for data representation vector icon. This is a completely customizable PowerPoint theme that can be put to use immediately. So, download it and address the topic impactfully.

 Home
Home