Financial Graphs

Competitor Analysis Template 2 Ppt PowerPoint Presentation File Picture
This is a competitor analysis template 2 ppt powerpoint presentation file picture. This is a four stage process. The stages in this process are your company, market share, competitor, analysis.

Competitor Analysis Template 3 Ppt PowerPoint Presentation Infographic Template Shapes
This is a competitor analysis template 3 ppt powerpoint presentation infographic template shapes. This is a four stage process. The stages in this process are your company, market share, competitor, analysis.

Area Chart Ppt PowerPoint Presentation Visual Aids Show
This is a area chart ppt powerpoint presentation visual aids show. This is a two stage process. The stages in this process are area chart, growth, strategy, finance, business.
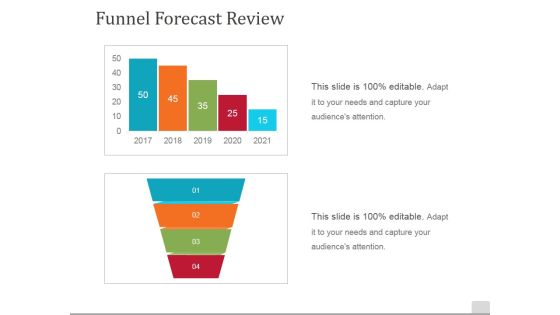
Funnel Forecast Review Template 1 Ppt PowerPoint Presentation Portfolio Deck
This is a funnel forecast review template 1 ppt powerpoint presentation portfolio deck. This is a two stage process. The stages in this process are funnel, forecast review, process, marketing, business.
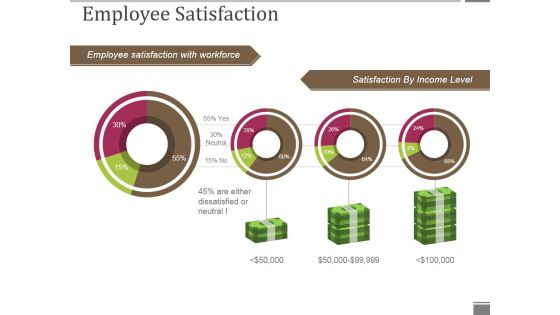
Employee Satisfaction Ppt PowerPoint Presentation Gallery Graphics
This is a employee satisfaction ppt powerpoint presentation gallery graphics. This is a four stage process. The stages in this process are employee satisfaction with workforce, satisfaction by income level.

Employee Who Leave Within First 6 Months Ppt PowerPoint Presentation Model Layout Ideas
This is a employee who leave within first 6 months ppt powerpoint presentation model layout ideas. This is a two stage process. The stages in this process are barely on board, top 3 reasons why they left, business, process, marketing.

Combo Chart Ppt PowerPoint Presentation Infographic Template Graphic Images
This is a combo chart ppt powerpoint presentation infographic template graphic images. This is a three stage process. The stages in this process are market size, growth rate, percentage, business, marketing.

Combo Chart Ppt PowerPoint Presentation Portfolio Template
This is a combo chart ppt powerpoint presentation portfolio template. This is a three stage process. The stages in this process are product, business, marketing, combo chart, percentage.

Scatter Chart Template 3 Ppt PowerPoint Presentation Styles Demonstration
This is a scatter chart template 3 ppt powerpoint presentation styles demonstration. This is a one stage process. The stages in this process are sales in percentage, finance, business, marketing, growth.

Area Chart Ppt PowerPoint Presentation Outline Deck
This is a area chart ppt powerpoint presentation outline deck. This is a two stage process. The stages in this process are area chart, finance, marketing, analysis, business.

Combo Chart Ppt PowerPoint Presentation Icon Portrait
This is a combo chart ppt powerpoint presentation icon portrait. This is a three stage process. The stages in this process are combo chart, finance, marketing, strategy, analysis.
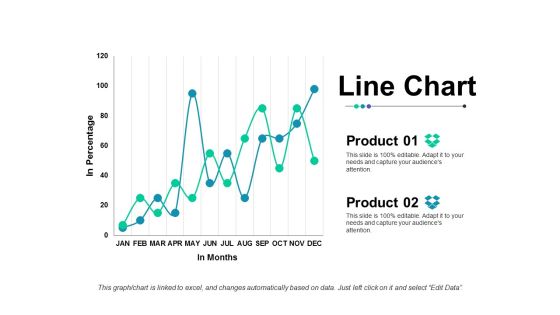
Line Chart Ppt Powerpoint Presentation Outline Slide Portrait
This is a line chart ppt powerpoint presentation outline slide portrait. This is a two stage process. The stages in this process are line chart, finance, strategy, business, analysis.
Key Tactics To Improve Corporate Economics After COVID 19 Ppt PowerPoint Presentation Icon Model PDF
This slide exhibits key strategies to improve company Financials after COIVD-19. It includes major elements such as- analyzing and reducing cost, utilizing working capital, monitoring supplier and third party risk etc. Persuade your audience using this key tactics to improve corporate economics after covid 19 ppt powerpoint presentation icon model pdf. This PPT design covers four stages, thus making it a great tool to use. It also caters to a variety of topics including reposition, cash focus, strengthen position. Download this PPT design now to present a convincing pitch that not only emphasizes the topic but also showcases your presentation skills.
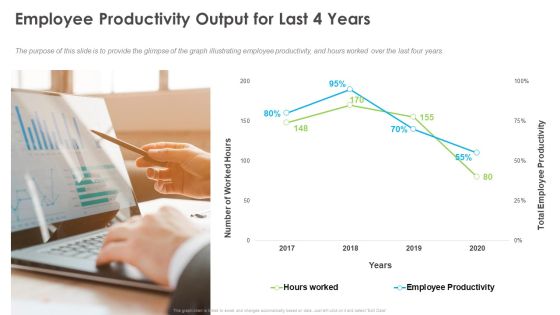
Outstanding Employee Employee Productivity Output For Last 4 Years Guidelines PDF
The purpose of this slide is to provide the glimpse of the graph illustrating employee productivity, and hours worked over the last four years. This is a outstanding employee employee productivity output for last 4 years guidelines pdf template with various stages. Focus and dispense information on one stage using this creative set, that comes with editable features. It contains large content boxes to add your information on topics like employee productivity, worked hours. You can also showcase facts, figures, and other relevant content using this PPT layout. Grab it now.
Supply Chain Balanced Scorecard Ppt Images Gallery
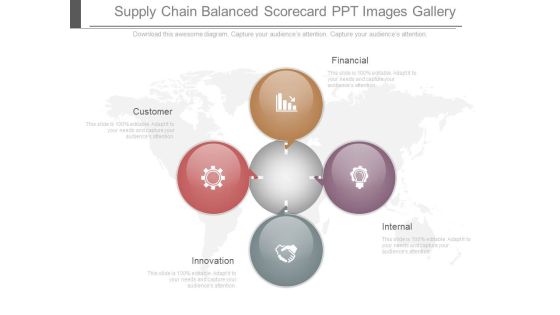
This is a supply chain balanced scorecard ppt images gallery. This is a four stage process. The stages in this process are financial, customer, internal, innovation.
Service Success Elements Ppt Slide Examples
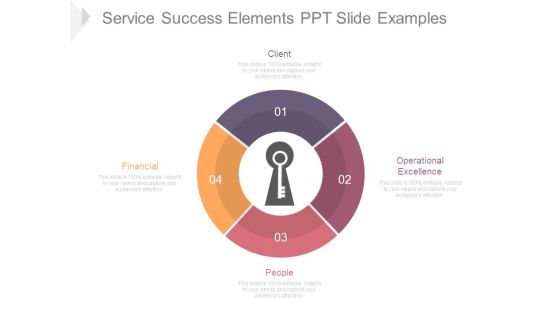
This is a service success elements ppt slide examples. This is a four stage process. The stages in this process are client, people, financial, operational excellence.
Donut Pie Chart Ppt PowerPoint Presentation Infographics Examples
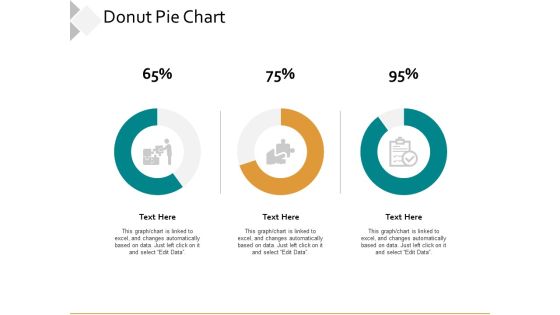
This is a donut pie chart ppt powerpoint presentation infographics examples. This is a three stage process. The stages in this process are business, management, marketing, financial.
Introduction To Mobile Money In Developing Countries Adoption Of MFS In Emerging Markets Microsoft PDF
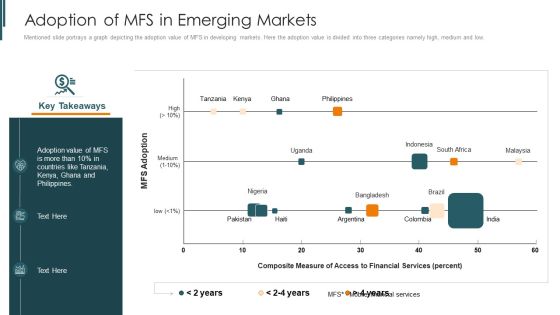
Mentioned slide portrays a graph depicting the adoption value of MFS in developing markets. Here the adoption value is divided into three categories namely high, medium and low. Deliver and pitch your topic in the best possible manner with this introduction to mobile money in developing countries adoption of mfs in emerging markets microsoft pdf Use them to share invaluable insights on composite measure, financial services, countries like tanzania and impress your audience. This template can be altered and modified as per your expectations. So, grab it now.

3d Man Global Business PowerPoint Templates And PowerPoint Themes 1012
3d Man Global Business PowerPoint Templates And PowerPoint Themes 1012-This template with an image of 3d man drawing a down bar graph helps you chart the course of your presentation. This image represents the downfall of the business or financial crisis. Our stunning and unique image makes your presentations simpler and professional showing that you care about even the smallest details. This template signifies global business, finance, marketing, statistics, strategy and success.-3d Man Global Business PowerPoint Templates And PowerPoint Themes 1012-This PowerPoint template can be used for presentations relating to-Global business man, earth, business, glabe, technology, success

Evaluating Net Funding Requirement Of Organization Developing Fundraising Techniques Diagrams PDF
This slide showcases graph that can help organization to evaluate failure rate of previously crowdfunded companies. It illustrates graph that shows failure rate at seed stage for a period of last 4 financial years.Do you know about Slidesgeeks Evaluating Net Funding Requirement Of Organization Developing Fundraising Techniques Diagrams PDF These are perfect for delivering any kind od presentation. Using it, create PowerPoint presentations that communicate your ideas and engage audiences. Save time and effort by using our pre-designed presentation templates that are perfect for a wide range of topic. Our vast selection of designs covers a range of styles, from creative to business, and are all highly customizable and easy to edit. Download as a PowerPoint template or use them as Google Slides themes.

Risk Associated With Strategic Alliances Ppt PowerPoint Presentation Portfolio Outfit
This is a risk associated with strategic alliances ppt powerpoint presentation portfolio outfit. This is a eight stage process. The stages in this process are input supply risk, surge capacity risk, quality performance risk, cost renegotiation risk, coordination risk, financial viability risk, contribution valuation risk, financial commitment risk.

Line Chart Ppt PowerPoint Presentation Styles Format Ideas
This is a line chart ppt powerpoint presentation styles format ideas. This is a two stage process. The stages in this process are line chart, financial, business, planning, marketing, management.

Hobbies Pie Chart Ppt PowerPoint Presentation Show Smartart
This is a hobbies pie chart ppt powerpoint presentation show smartart. This is a five stage process. The stages in this process are financial, business, marketing, management, pie chart.

Types Of Risks Strategic Ppt PowerPoint Presentation Pictures Example
Presenting this set of slides with name types of risks strategic ppt powerpoint presentation pictures example. This is a four stage process. The stages in this process are risk, strategies, operational, hazard, financial. This is a completely editable PowerPoint presentation and is available for immediate download. Download now and impress your audience.
Histogram Icon Showing Economic Fluctuations Ppt PowerPoint Presentation Slides Samples Cpb
This is a histogram icon showing economic fluctuations ppt powerpoint presentation slides samples cpb. This is a three stage process. The stages in this process are bar chart icon, bar graph icon, data chart icon.
Business Framework Firm S Cumulative Capital Requirement PowerPoint Presentation
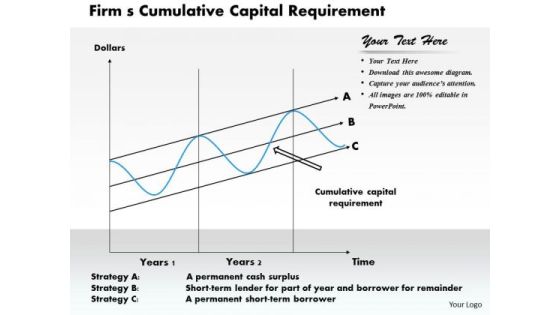
This business framework PPT has been crafted with graphic of graph with multiple stages. This PPT diagram contains the concept of firm s- cumulative capital requirements. Use this PPT diagram for your business and management related presentations.

Golden Dollar Coins Business PowerPoint Templates And PowerPoint Themes 0912
Golden Dollar Coins Business PowerPoint Templates And PowerPoint Themes 0912-Microsoft Powerpoint Templates and Background with graph made of stacks of golden coins
Profit And Loss Finance Business PowerPoint Templates And PowerPoint Themes 0812
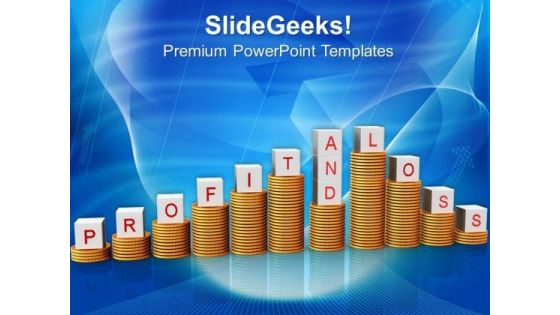
Profit And Loss Finance Business PowerPoint Templates And PowerPoint Themes 0812-Microsoft Powerpoint Templates and Background with business graph with up and fall

Business Circle Charts PowerPoint Templates Business Customer Business Product Ppt Slides
Business Circle Charts PowerPoint Templates Business customer business product PPT Slides-This PowerPoint diagram shows factors involved in a customer business product strategy -Business Circle Charts PowerPoint Templates Business customer business product PPT Slides-This template can be used for presentations relating to Aim, Arrow, Background, Business, Commerce, Conceptual, Customer, Finance, Financial, Gain, Growth, Illustration, Industry, Investment, Law, Legal, Manufacturing, Metaphor, Money, Objective, Product, Professional, Profit, Quality, Retail, Rights, Sale, Shop, Shopping, Success, Teamwork

Venture Capital Funding For Firms Organization Chart Ppt Professional Objects PDF
This is a venture capital funding for firms organization chart ppt professional objects pdf template with various stages. Focus and dispense information on two stages using this creative set, that comes with editable features. It contains large content boxes to add your information on topics like business strategy, financial, customer. You can also showcase facts, figures, and other relevant content using this PPT layout. Grab it now.

Business Chart PowerPoint Templates Business 3d Double Concentric Rings Pieces Ppt Slides
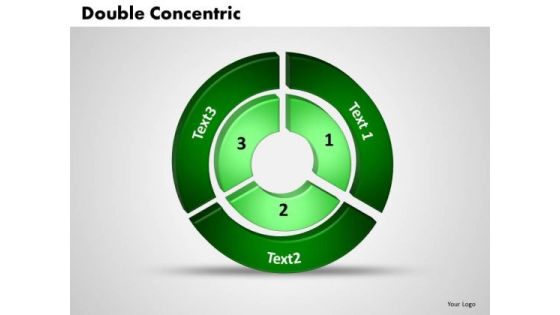
Business Chart PowerPoint Templates Business 3d double concentric rings pieces PPT Slides-Use this diagram to explain the contribution of each of the elements and how they provide impetus to the next phase. Highlight any anticipated problems, shortfalls or weak areas-Business Chart PowerPoint Templates Business 3d double concentric rings pieces PPT Slides-This ppt can be used for concepts relating to-3d, Abstract, Account, Achievement, Analyst, Annual, Background, Blue, Business, Capital, Chart, Circular, Conceptual, Data, Design, Diagram, Document, Earnings, Economic, Finance, Financial, Forecast, Icon, Illustration
Business Diagrams PowerPoint Templates Business 3d Double Concentric Rings Pieces Ppt Slides
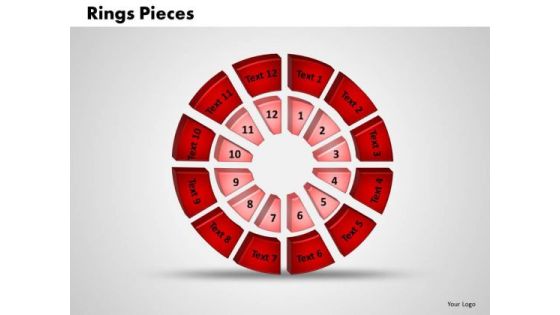
Business Diagrams PowerPoint Templates Business 3d double concentric rings pieces PPT Slides-Use this diagram to explain the contribution of each of the elements and how they provide impetus to the next phase. Highlight any anticipated problems, shortfalls or weak areas-Business Diagrams PowerPoint Templates Business 3d double concentric rings pieces PPT Slides-This ppt can be used for concepts relating to-3d, Abstract, Account, Achievement, Analyst, Annual, Background, , Business, Capital, Chart, Circular, Conceptual, Data, Design, Diagram, Document, Earnings, Economic, Finance, Financial, Forecast, Icon, Illustration etc.
Business Editable PowerPoint Templates Business 3d Double Concentric Rings Pieces Ppt Slides
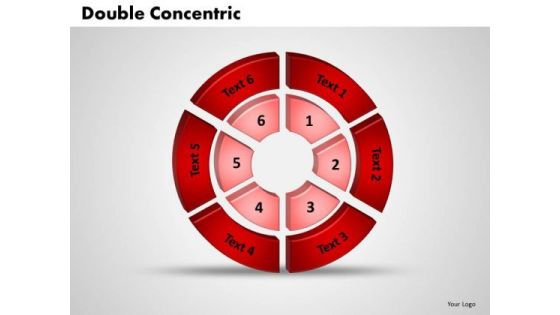
Business Editable PowerPoint Templates Business 3d double concentric rings pieces PPT Slides-Use this diagram to explain the contribution of each of the elements and how they provide impetus to the next phase. Highlight any anticipated problems, shortfalls or weak areas-Business Editable PowerPoint Templates Business 3d double concentric rings pieces PPT Slides-This ppt can be used for concepts relating to-3d, Abstract, Account, Achievement, Analyst, Annual, Background, Blue, Business, Capital, Chart, Circular, Conceptual, Data, Design, Diagram, Document, Earnings, Economic, Finance, Financial, Forecast, Icon, Illustration

Business Growth PowerPoint Templates Business 3d Double Concentric Rings Pieces Ppt Slides
Business Growth PowerPoint Templates Business 3d double concentric rings pieces PPT Slides-Use this diagram to explain the contribution of each of the elements and how they provide impetus to the next phase. Highlight any anticipated problems, shortfalls or weak areas-Business Growth PowerPoint Templates Business 3d double concentric rings pieces PPT Slides-This ppt can be used for concepts relating to-3d, Abstract, Account, Achievement, Analyst, Annual, Background, Blue, Business, Capital, Chart, Circular, Conceptual, Data, Design, Diagram, Document, Earnings, Economic, Finance, Financial, Forecast, Icon, Illustration

Business Process PowerPoint Templates Business 3d Double Concentric Rings Pieces Ppt Slides
Business Process PowerPoint Templates Business 3d double concentric rings pieces PPT Slides-Use this diagram to explain the contribution of each of the elements and how they provide impetus to the next phase. Highlight any anticipated problems, shortfalls or weak areas-Business Process PowerPoint Templates Business 3d double concentric rings pieces PPT Slides-This ppt can be used for concepts relating to-3d, Abstract, Account, Achievement, Analyst, Annual, Background, Blue, Business, Capital, Chart, Circular, Conceptual, Data, Design, Diagram, Document, Earnings, Economic, Finance, Financial, Forecast, Icon, Illustration etc.
Business Success PowerPoint Templates Business 3d Double Concentric Rings Pieces Ppt Slides
Business Success PowerPoint Templates Business 3d double concentric rings pieces PPT Slides-Use this diagram to explain the contribution of each of the elements and how they provide impetus to the next phase. Highlight any anticipated problems, shortfalls or weak areas-Business Success PowerPoint Templates Business 3d double concentric rings pieces PPT Slides-This ppt can be used for concepts relating to-3d, Abstract, Account, Achievement, Analyst, Annual, Background, Blue, Business, Capital, Chart, Circular, Conceptual, Data, Design, Diagram, Document, Earnings, Economic, Finance, Financial, Forecast, Icon, Illustration etc.

Business Teamwork PowerPoint Templates Business 3d Double Concentric Rings Pieces Ppt Slides
Business Teamwork PowerPoint Templates Business 3d double concentric rings pieces PPT Slides-Use this diagram to explain the contribution of each of the elements and how they provide impetus to the next phase. Highlight any anticipated problems, shortfalls or weak areas-Business Teamwork PowerPoint Templates Business 3d double concentric rings pieces PPT Slides-This ppt can be used for concepts relating to-3d, Abstract, Account, Achievement, Analyst, Annual, Background, Blue, Business, Capital, Chart, Circular, Conceptual, Data, Design, Diagram, Document, Earnings, Economic, Finance, Financial, Forecast, Icon, Illustration Etc.
PowerPoint Backgrounds Chart Venn Diagram Ppt Design
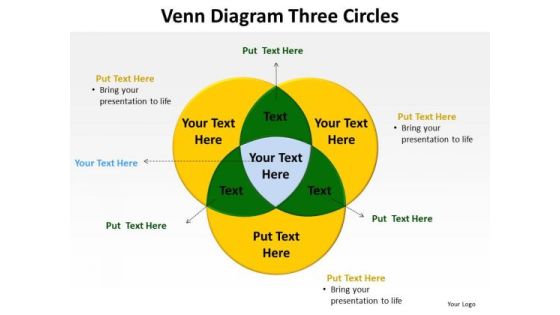
PowerPoint Backgrounds Chart Venn Diagram PPT Design-The Venn graphic comprising interlinking circles geometrically demonstrate how various functions operating independently, to a large extent, are essentially interdependent. Amplify on this basic corporate concept and forefront the benefits of overlapping processes to arrive at common goals.-Background, Black, Blue, Business, Chart, Circle, Diagram, Drop, Financial, Green, Icon, Isolated, Overlapping, Process, Red, Round, Shadow, Shape, Three, Transparency, Vector, Venn, White
PowerPoint Backgrounds Marketing Venn Diagram Ppt Slide
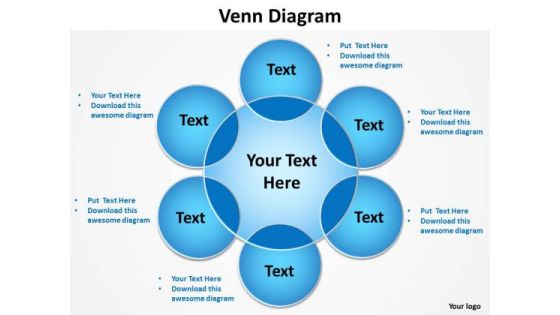
PowerPoint Backgrounds Marketing Venn Diagram PPT Slide-The Venn graphic comprising interlinking circles geometrically demonstrate how various functions operating independently, to a large extent, are essentially interdependent. Amplify on this basic corporate concept and forefront the benefits of overlapping processes to arrive at common goals.-Background, Black, Blue, Business, Chart, Circle, Diagram, Drop, Financial, Green, Icon, Isolated, Overlapping, Process, Red, Round, Shadow, Shape, Three, Transparency, Vector, Venn, White
PowerPoint Backgrounds Process Venn Diagram Ppt Template
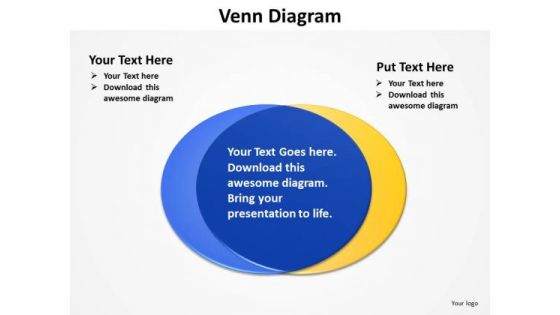
PowerPoint Backgrounds Process Venn Diagram PPT Template-The Venn graphic comprising interlinking circles geometrically demonstrate how various functions operating independently, to a large extent, are essentially interdependent. Amplify on this basic corporate concept and forefront the benefits of overlapping processes to arrive at common goals.-Background, Black, Blue, Business, Chart, Circle, Diagram, Drop, Financial, Green, Icon, Isolated, Overlapping, Process, Red, Round, Shadow, Shape, Three, Transparency, Vector, Venn, White

PowerPoint Backgrounds Strategy Venn Diagram Ppt Template
PowerPoint Backgrounds Strategy Venn Diagram PPT Template-The Venn graphic comprising interlinking circles geometrically demonstrate how various functions operating independently, to a large extent, are essentially interdependent. Amplify on this basic corporate concept and forefront the benefits of overlapping processes to arrive at common goals.-Background, Black, Blue, Business, Chart, Circle, Diagram, Drop, Financial, Green, Icon, Isolated, Overlapping, Process, Red, Round, Shadow, Shape, Three, Transparency, Vector, Venn, White
PowerPoint Design Process Venn Diagram Ppt Themes
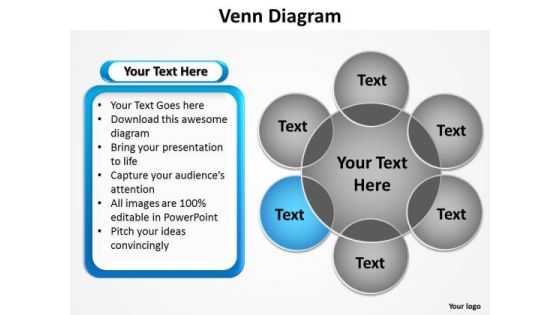
PowerPoint Design Process Venn Diagram PPT Themes-The Venn graphic comprising interlinking circles geometrically demonstrate how various functions operating independently, to a large extent, are essentially interdependent. Amplify on this basic corporate concept and forefront the benefits of overlapping processes to arrive at common goals.-Background, Black, Blue, Business, Chart, Circle, Diagram, Drop, Financial, Green, Icon, Isolated, Overlapping, Process, Red, Round, Shadow, Shape, Three, Transparency, Vector, Venn, White

PowerPoint Design Slides Process Venn Diagram Ppt Backgrounds
PowerPoint Design Slides Process Venn Diagram PPT Backgrounds-The Venn graphic comprising interlinking circles geometrically demonstrate how various functions operating independently, to a large extent, are essentially interdependent. Amplify on this basic corporate concept and forefront the benefits of overlapping processes to arrive at common goals.-Background, Black, Blue, Business, Chart, Circle, Diagram, Drop, Financial, Green, Icon, Isolated, Overlapping, Process, Red, Round, Shadow, Shape, Three, Transparency, Vector, Venn, White
PowerPoint Design Success Venn Diagram Ppt Slides
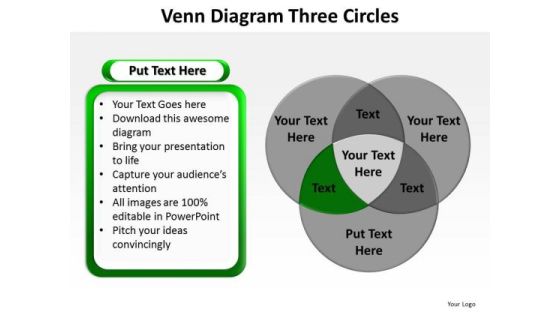
PowerPoint Design Success Venn Diagram PPT Slides-The Venn graphic comprising interlinking circles geometrically demonstrate how various functions operating independently, to a large extent, are essentially interdependent. Amplify on this basic corporate concept and forefront the benefits of overlapping processes to arrive at common goals.-Background, Black, Blue, Business, Chart, Circle, Diagram, Drop, Financial, Green, Icon, Isolated, Overlapping, Process, Red, Round, Shadow, Shape, Three, Transparency, Vector, Venn, White

PowerPoint Layout Education Venn Diagram Ppt Slide Designs
PowerPoint Layout Education Venn Diagram PPT Slide Designs-The Venn graphic comprising interlinking circles geometrically demonstrate how various functions operating independently, to a large extent, are essentially interdependent. Amplify on this basic corporate concept and forefront the benefits of overlapping processes to arrive at common goals.-Background, Black, Blue, Business, Chart, Circle, Diagram, Drop, Financial, Green, Icon, Isolated, Overlapping, Process, Red, Round, Shadow, Shape, Three, Transparency, Vector, Venn, White
PowerPoint Layouts Company Venn Diagram Ppt Design
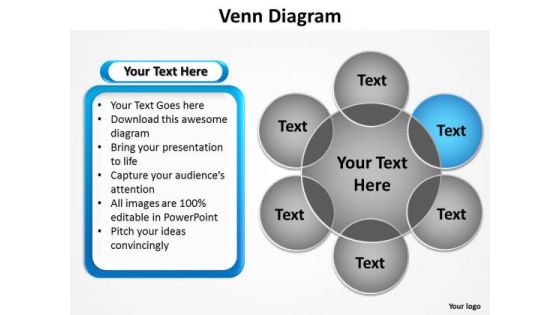
PowerPoint Layouts Company Venn Diagram PPT Design-The Venn graphic comprising interlinking circles geometrically demonstrate how various functions operating independently, to a large extent, are essentially interdependent. Amplify on this basic corporate concept and forefront the benefits of overlapping processes to arrive at common goals.-Background, Black, Blue, Business, Chart, Circle, Diagram, Drop, Financial, Green, Icon, Isolated, Overlapping, Process, Red, Round, Shadow, Shape, Three, Transparency, Vector, Venn, White

PowerPoint Slide Designs Process Chart Company Ppt Slides
PowerPoint Slide Designs process chart Company PPT Slides-This Process Chart can be used as data flow diagram to show the flow of the data as it moves from beginning process to end result.-3d, art, business, chart, circle, concept, connection, cycle, development, diagram, direction, element, environment, finance, financial, flow, graphic, group, investment, isolated, market,, movement, organization, passive income, perspective, presentation, process chart, recycle, report, sign, step, success, symbol, teamwork-PowerPoint Slide Designs process chart Company PPT Slides

PowerPoint Slide Designs Ring Process Success Ppt Theme
PowerPoint Slide Designs ring process Success PPT Theme-This Diagram is best suited to streamline the processes for your audience to follow in order to interconnect with each other. Step by step develop the entire picture and project it onto their minds.-3d, art, business, chart, circle, concept, connection, cycle, development, diagram, direction, element, environment, finance, financial, flow, graphic, group, investment, isolated, market,, movement, organization, passive income, perspective, presentation, process chart, recycle, report, sign, step, success, symbol, teamwork-PowerPoint Slide Designs ring process Success PPT Theme

PowerPoint Template Process Chart Download Ppt Theme
PowerPoint Template process chart Download PPT Theme-Life and Business is made up of processes comprising stages that flow from one to another. An excellent graphic to attract the attention of and understanding by your audience to improve earnings.-3d, arrow, art, business, chart, circle, concept, connection, cycle, development, diagram, direction, element, environment, finance, financial, flow, graphic, group, investment, isolated, market,, movement, organization, passive income, perspective, presentation, process chart, recycle, report, sign, step, success, symbol, teamwork-PowerPoint Template process chart Download PPT Theme

PowerPoint Template Process Chart Leadership Ppt Backgrounds
PowerPoint Template process chart Leadership PPT Backgrounds-Life and Business is made up of processes comprising stages that flow from one to another. An excellent graphic to attract the attention of and understanding by your audience to improve earnings.-3d, arrow, art, business, chart, circle, concept, connection, cycle, development, diagram, direction, element, environment, finance, financial, flow, graphic, group, investment, isolated, market,, movement, organization, passive income, perspective, presentation, process chart, recycle, report, sign, step, success, symbol, teamwork-PowerPoint Template process chart Leadership PPT Backgrounds
PowerPoint Themes Process Chart Graphic Ppt Template
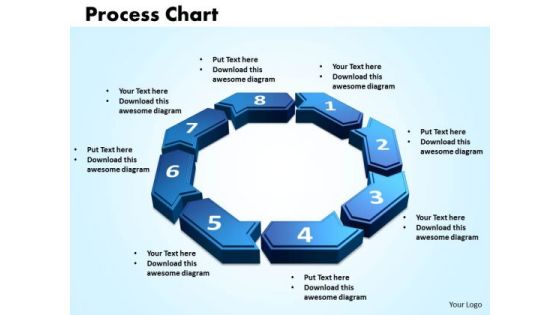
PowerPoint Themes process chart Graphic PPT Template-Life and Business is made up of processes comprising stages that flow from one to another. An excellent graphic to attract the attention of and understanding by your audience to improve earnings.-3d, arrow, art, business, chart, circle, concept, connection, cycle, development, diagram, direction, element, environment, finance, financial, flow, graphic, group, investment, isolated, market,, movement, organization, passive income, perspective, presentation, process chart, recycle, report, sign, step, success, symbol, teamwork-PowerPoint Themes process chart Graphic PPT Template

PowerPoint Themes Process Chart Marketing Ppt Templates
PowerPoint Themes process Chart Marketing PPT Templates-Life and Business is made up of processes comprising stages that flow from one to another. An excellent graphic to attract the attention of and understanding by your audience to improve earnings.-3d, arrow, art, business, chart, circle, concept, connection, cycle, development, diagram, direction, element, environment, finance, financial, flow, graphic, group, investment, isolated, market,, movement, organization, passive income, perspective, presentation, process chart, recycle, report, sign, step, success, symbol, teamwork-PowerPoint Themes process Chart Marketing PPT Templates
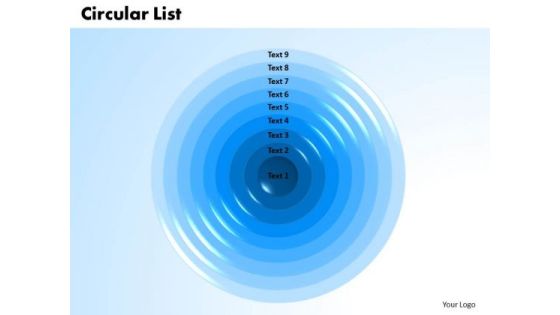
PowerPoint Slide Circular List Marketing Ppt Designs
PowerPoint Slide Circular List Marketing PPT Designs-Use to awesome List and text boxes powerpoint templates to create awesome marketing and sales priority lists or any other types of lists.-PowerPoint Slide Circular List Marketing PPT Designs-Account, Advertise, Analyze, Arrow, Brochure, Business, Catalog, Chart, Circular, Commercial, Competition, Concentric, Cyclic, Demonstration, Description, Diagram, Financial, Goals, Illustration, Information, Label, List, Management, Marketing, Note, Organization, Plan, Profit, Promote, Records, Recursive, Registry, Report, Research, Ring, Sale, Six, Spherical, Statement, Strategy, Structure, Success, Symbol

Ppt 7 Create PowerPoint Macro Circular Process Flow Diagram Free Templates
PPT 7 create powerpoint macro circular process flow diagram free Templates-The above template displays a circular process flow diagram.This Diagram is mainly used to depict the progress of sequential steps in circular flow.It is a powerful tool concieved to enable you to define your message more clearly in your PPT presentations. -PPT 7 create powerpoint macro circular process flow diagram free Templates-Arrows, Background, Business, Chart, Circle, Circular, Financial, Flow, Graphic, Gray, Icon, Illustration, Isometric, Perspective, Process, Recycle, Round, Shape, Flow, Marketing, Leadership, Steps
Functional Business Chart With Sales And Marketing Ppt PowerPoint Presentation Icon Professional PDF
Persuade your audience using this functional business chart with sales and marketing ppt powerpoint presentation icon professional pdf. This PPT design covers four stages, thus making it a great tool to use. It also caters to a variety of topics including planning, financial, management. Download this PPT design now to present a convincing pitch that not only emphasizes the topic but also showcases your presentation skills.

Money Bags With Euro Growth Arrow PowerPoint Templates
The above PPT slide contains graphics of money bag with Euro growth graph. This professionally designed slide may be used to depict financial growth analysis. This slide will help your viewers automatically empathize with your thoughts
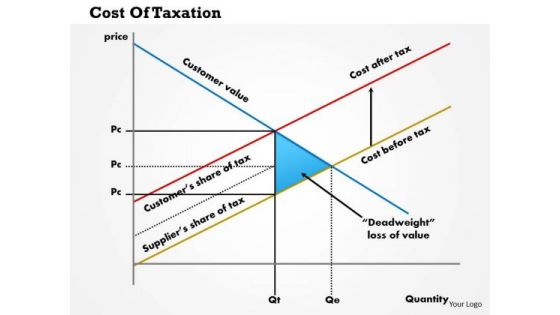
Business Framework Cost Of Taxation PowerPoint Presentation
This innovative image slide has been designed to display coat of taxation graph. This business framework template may be used to display financial ratios of taxation in your presentations. This image slide will impart professional appearance to your presentations.

Business Framework Capital Structure PowerPoint Presentation
This PPT slide has been designed with graph of capital structure. Capital structure is nothing but a mix of any company's long term debt, short term debt and common equity with preferred equity. Use this structure to understand the decision management of that company. Use this PPT and give a clear picture of capital structure.
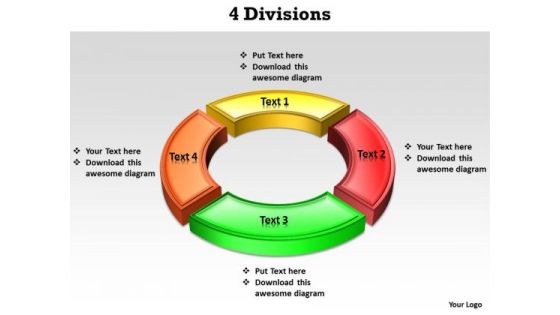
Ppt 4 Colorful PowerPoint Background Divisions Forming Circle Templates
PPT 4 colorful powerpoint background divisions forming circle Templates-This PowerPoint Diagram consists of four colorful divisions forming a circle. It is useful to explain four different components required in Business. It signifies constituent, factor, fixings, ingredient, item, making, makings, peripheral, piece, plug-in, segment, unit etc.-Can be used for presentations on 3d, background, brochure, business, catalog, chart, circle, concept, corporate, design, development, diagram, division, economic, financial, flyer, graphic, illustration, manager, progress, round, scheme, section, situation, state, tab, vector, wallpaper-PPT 4 colorful powerpoint background divisions forming circle Templates
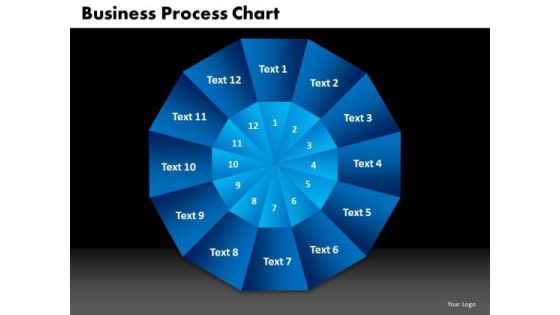
PowerPoint Design Slides Process Chart Business Ppt Slides
PowerPoint Design Slides Process Chart Business PPT Slides-The Circle of Life - a concept emmbedded in our minds and hence easy to comprehend. Life and Business is made up of processes comprising stages that flow from one to another. An excellent graphic to attract the attention of and understanding by your audience to improve earnings-PowerPoint Design Slides Process Chart Business PPT Slides-This ppt can be used for presentations relating to-Arrow, Bond, Business, Button, Buying, Career, Change, Chart, Children, Circle, College, Death, Diagram, Education, Financial, Future, Graphic, House, Illustration, Investing, Investment, Marriage, Menu, Personal, Plan, Process
 Home
Home