Financial Graphs
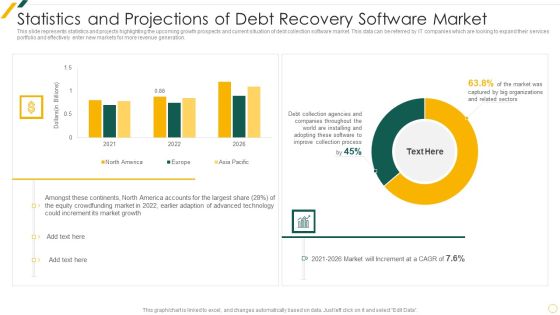
Statistics And Projections Of Debt Recovery Software Market Guidelines PDF
This slide represents statistics and projects highlighting the upcoming growth prospects and current situation of debt collection software market. This data can be referred by IT companies which are looking to expand their services portfolio and effectively enter new markets for more revenue generation.Pitch your topic with ease and precision using this Statistics And Projections Of Debt Recovery Software Market Guidelines PDF This layout presents information on Resuming Aggregable, Agreeable Projected, Allocating Agent It is also available for immediate download and adjustment. So, changes can be made in the color, design, graphics or any other component to create a unique layout.

Online Marketing Report With Return On Investment Inspiration PDF
This slide shows digital marketing dashboard which includes total revenues, marketing spend, profits, lead generation, website traffic, cost per acquisition, pay per action with different channels such as display , fairs, search, social, television, etc.Showcasing this set of slides titled Online Marketing Report With Return On Investment Inspiration PDF The topics addressed in these templates are Leads Generation, Cost Acquisition, Return Investment All the content presented in this PPT design is completely editable. Download it and make adjustments in color, background, font etc. as per your unique business setting.

Effective Sales Technique For New Product Launch Dashboard To Track Sales Opportunities Introduction PDF
Mentioned slide shows dashboard that can be used by an organization to track win and lost sales opportunities. It includes metrics namely won opportunities, lost opportunities, pipeline by territory, total opportunities.Deliver an awe inspiring pitch with this creative Effective Sales Technique For New Product Launch Dashboard To Track Sales Opportunities Introduction PDF bundle. Topics like Lost Opportunities, Total Opportunities, Revenue Territory can be discussed with this completely editable template. It is available for immediate download depending on the needs and requirements of the user.

New Product Sales Strategy And Marketing Dashboard To Track Sales Opportunities Rules PDF
Mentioned slide shows dashboard that can be used by an organization to track win and lost sales opportunities. It includes metrics namely won opportunities, lost opportunities, pipeline by territory, total opportunities. Deliver and pitch your topic in the best possible manner with this New Product Sales Strategy And Marketing Dashboard To Track Sales Opportunities Rules PDF. Use them to share invaluable insights on Won Opportunities, Lost Opportunities, Revenue and impress your audience. This template can be altered and modified as per your expectations. So, grab it now.
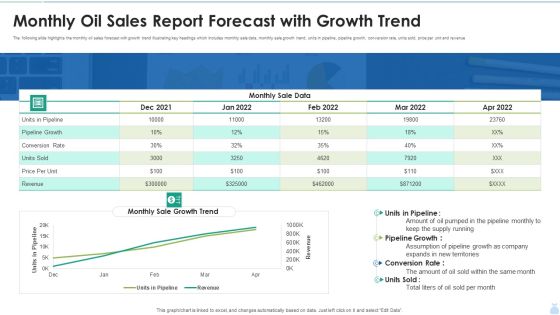
Monthly Oil Sales Report Forecast With Growth Trend Graphics PDF
The following slide highlights the monthly oil sales forecast with growth trend illustrating key headings which includes monthly sale data, monthly sale growth trend, units in pipeline, pipeline growth, conversion rate, units sold, price per unit and revenue. Showcasing this set of slides titled Monthly Oil Sales Report Forecast With Growth Trend Graphics PDF. The topics addressed in these templates are Pipeline Growth, Monthly Sale Data, Conversion Rate. All the content presented in this PPT design is completely editable. Download it and make adjustments in color, background, font etc. as per your unique business setting.
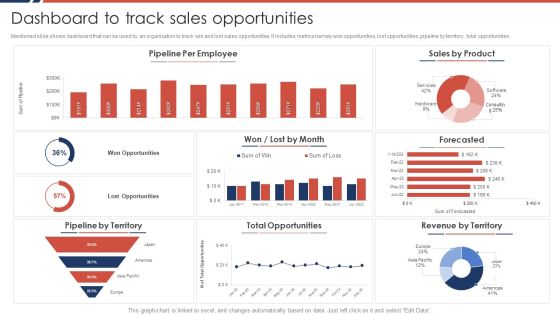
Effective Sales Plan For New Product Introduction In Market Dashboard To Track Sales Opportunities Formats PDF
Mentioned slide shows dashboard that can be used by an organization to track win and lost sales opportunities. It includes metrics namely won opportunities, lost opportunities, pipeline by territory, total opportunities.Deliver an awe inspiring pitch with this creative Effective Sales Plan For New Product Introduction In Market Dashboard To Track Sales Opportunities Formats PDF bundle. Topics like Pipeline Employee, Total Opportunities, Revenue Territory can be discussed with this completely editable template. It is available for immediate download depending on the needs and requirements of the user.

Organization Reinvention Digital Finance Dashboard Clipart PDF
This slide covers the advanced technologies entering the market from past few decades. The combinatorial effects of base technologies, such as mobile, cloud, sensors, analytics and the Internet of Things IoT, are accelerating progress exponentially. This slide covers transformation dashboard covering various stages of a business along with the budget and risks involved at every stage. Deliver and pitch your topic in the best possible manner with this Organization Reinvention Digital Finance Dashboard Clipart PDF. Use them to share invaluable insights on Revenue By Channels, Operating Cost, Digital Budget and impress your audience. This template can be altered and modified as per your expectations. So, grab it now.

Cios Methodologies To Improve IT Spending Determine It Department Cost Management Dashboard Diagrams PDF
This slide provides information regarding IT department cost management dashboard including KPIs such as return on investment of IT department, spend vs. budget, IT cost breakdown and IT costs vs. revenues. Deliver and pitch your topic in the best possible manner with this Cios Methodologies To Improve IT Spending Determine It Department Cost Management Dashboard Diagrams PDF Use them to share invaluable insights on Extent Organizational, Reprioritization Cancellation, Investment Required and impress your audience. This template can be altered and modified as per your expectations. So, grab it now.
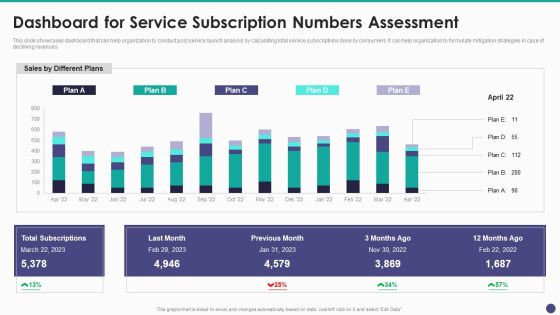
New Service Launch And Development Strategy To Gain Market Share Dashboard For Service Subscription Summary PDF
This slide showcases dashboard that can help organization to conduct post service launch analysis by calculating total service subscriptions done by consumers. It can help organization to formulate mitigation strategies in case of declining revenues.Deliver and pitch your topic in the best possible manner with this New Service Launch And Development Strategy To Gain Market Share Dashboard For Service Subscription Summary PDF Use them to share invaluable insights on Total Subscriptions, Previous Month, Different Plans and impress your audience. This template can be altered and modified as per your expectations. So, grab it now.

New Service Launch And Development Strategy To Gain Market Share Global Market Sizing For New Service Diagrams PDF
This slide showcases market sizing that can help organization to estimate the profit and revenue potential before launching new service. Its key components are market size, estimated growth and target market.Deliver and pitch your topic in the best possible manner with this New Service Launch And Development Strategy To Gain Market Share Global Market Sizing For New Service Diagrams PDF Use them to share invaluable insights on Global Market, Sizing, New Service and impress your audience. This template can be altered and modified as per your expectations. So, grab it now.

KPI Metrics Dashboard To Measure Automation Performance In Customer Support Professional PDF
The following slide outlines a comprehensive KPI dashboard which can be used by the organization to measure the automation performance in customer support department. It covers kpis such as customer retention, costs per support, customer satisfaction, etc. Deliver and pitch your topic in the best possible manner with this KPI Metrics Dashboard To Measure Automation Performance In Customer Support Professional PDF. Use them to share invaluable insights on Customer Retention, Cost Per Support, Support Costs To Revenue and impress your audience. This template can be altered and modified as per your expectations. So, grab it now.
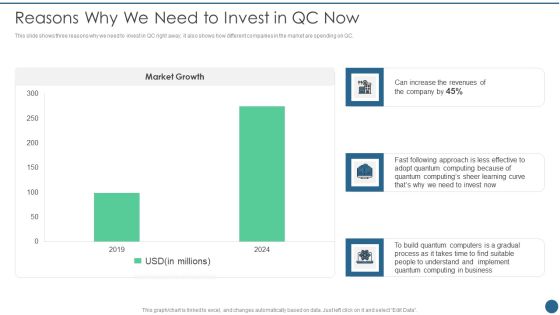
Quantum Key Distribution Reasons Why We Need To Invest In QC Now Background PDF
This slide shows three reasons why we need to invest in QC right away it also shows how different companies in the market are spending on QC.Deliver and pitch your topic in the best possible manner with this Quantum Key Distribution Reasons Why We Need To Invest In QC Now Background PDF Use them to share invaluable insights on Increase The Revenues, Quantum Computing, Quantum Computing and impress your audience. This template can be altered and modified as per your expectations. So, grab it now.

Line Chart Representing Outcomes Summary Of Product Sales Mockup PDF
This slide shows the graphical representation of sales volume of company products which includes product A , B and C which helps company to analyze the acceptability of products by potential customers.Pitch your topic with ease and precision using this Line Chart Representing Outcomes Summary Of Product Sales Mockup PDF This layout presents information on Company Generated, Maximum Revenues, Increasing For Product It is also available for immediate download and adjustment. So, changes can be made in the color, design, graphics or any other component to create a unique layout.
Yearly Outcomes Summary Of Profit And Loss Trends Icons PDF
This slide shows the graphical representation of result summary of profit and loss trends for five consecutive years that shows revenues, cost of goods sold, selling, general and administrative expenses, net income, etc.Pitch your topic with ease and precision using this Yearly Outcomes Summary Of Profit And Loss Trends Icons PDF This layout presents information on Earned Maximum, Selling General, Administrative Expenses It is also available for immediate download and adjustment. So, changes can be made in the color, design, graphics or any other component to create a unique layout.

Remarketing Techniques Current Problem Declining Website Conversion Rate Brochure PDF
This slide covers graphical representation of the companys current conversion rates. It also includes some key insights such as decreasing repeat purchases, returning purchases to repeat purchaser rate, fall in revenue, etc. Deliver an awe inspiring pitch with this creative Remarketing Techniques Current Problem Declining Website Conversion Rate Brochure PDF bundle. Topics like Conversion Rate, Quartile And Segments, Repeat Purchases Decreased can be discussed with this completely editable template. It is available for immediate download depending on the needs and requirements of the user.

Remarketing Techniques Impact Of Retargeting Campaign On Conversion Rates Structure PDF
This slide covers the graphical representation of positive outcomes of the retargeting campaigns on website conversion rate. It also includes key insights such as increased repeat purchase rate, decreased returning purchasers to repeat purchaser rate, repeat customer revenue, etc. Deliver an awe inspiring pitch with this creative Remarketing Techniques Impact Of Retargeting Campaign On Conversion Rates Structure PDF bundle. Topics like Conversion Rate, Quartile And Segments, Returing Purcharers, Repeat Purchasers can be discussed with this completely editable template. It is available for immediate download depending on the needs and requirements of the user.

Marketing And Operations Dashboard For Distribution Company Guidelines PDF
This slide covers sales and operations dashboard for distribution company. It involves details such as total sales by location, gross margin, monthly sales trends, average revenue and sales by major customers. Pitch your topic with ease and precision using this Marketing And Operations Dashboard For Distribution Company Guidelines PDF. This layout presents information on Gross Margin, Actual Vs Budget, Product. It is also available for immediate download and adjustment. So, changes can be made in the color, design, graphics or any other component to create a unique layout.

Business Excellence For Customer Growth And To Enhance Customer Relationships Ppt Infographic Template Styles PDF
This slide covers key drivers to improve customer interactions. It includes parameters such as identifying customer needs, market revenue share growth, supply chain performance, technological improvements, etc. Pitch your topic with ease and precision using this Business Excellence For Customer Growth And To Enhance Customer Relationships Ppt Infographic Template Styles PDF. This layout presents information on Business Excellence, Customer Growth, Customer Relationships. It is also available for immediate download and adjustment. So, changes can be made in the color, design, graphics or any other component to create a unique layout.
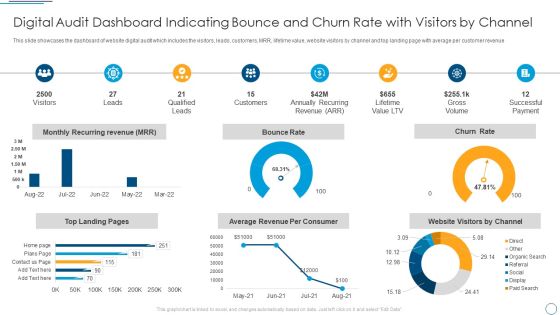
Digital Audit Dashboard Indicating Bounce And Churn Rate With Visitors By Channel Demonstration PDF
This slide showcases the dashboard of website digital audit which includes the visitors, leads, customers, MRR, lifetime value, website visitors by channel and top landing page with average per customer revenue.Deliver and pitch your topic in the best possible manner with this Digital Audit Dashboard Indicating Bounce And Churn Rate With Visitors By Channel Demonstration PDF. Use them to share invaluable insights on Qualified Leads, Annually Recurring, Successful Payment and impress your audience. This template can be altered and modified as per your expectations. So, grab it now.

Big Strategic Database Driven Management Objectives Achievement Statistics Professional PDF
This slide covers different stats on data driven culture business goals. It also includes percentage value of goals achieved from management and analysis of big data, statistics on competitive advantage, improve profitability, etc.Showcasing this set of slides titled Big Strategic Database Driven Management Objectives Achievement Statistics Professional PDF. The topics addressed in these templates are Gain Competitive, Driving Increased, Revenue Opportunities. All the content presented in this PPT design is completely editable. Download it and make adjustments in color, background, font etc. as per your unique business setting.
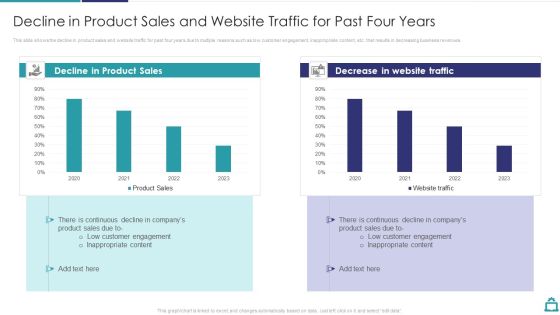
Deploying B2C Social Media Decline In Product Sales And Website Traffic For Past Four Years Slides PDF
This slide shows the decline in product sales and website traffic for past four years due to multiple reasons such as low customer engagement, inappropriate content, etc. that results in decreasing business revenues.Deliver an awe inspiring pitch with this creative Deploying B2C Social Media Decline In Product Sales And Website Traffic For Past Four Years Slides PDF bundle. Topics like Product Sales, Decrease In Website, Customer Engagement can be discussed with this completely editable template. It is available for immediate download depending on the needs and requirements of the user.
Metaverse Technology IT Dashboard For Tracking Metaverse Environment Ppt Outline Elements PDF
This slide represents the dashboard for tracking the metaverse environment. It covers the details of daily revenue, the total number of users, the number of new users, and total sales. Deliver and pitch your topic in the best possible manner with this Metaverse Technology IT Dashboard For Tracking Metaverse Environment Ppt Outline Elements PDF. Use them to share invaluable insights on Digital Spot, Satisfaction Rate, All Metaverses, Transaction Details and impress your audience. This template can be altered and modified as per your expectations. So, grab it now.
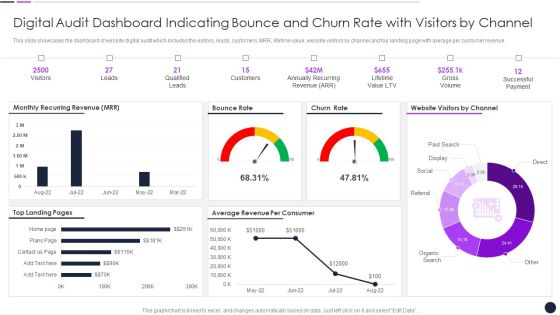
Digital Audit Dashboard Indicating Bounce And Churn Rate With Visitors By Channel Inspiration PDF
This slide showcases the dashboard of website digital audit which includes the visitors, leads, customers, MRR, lifetime value, website visitors by channel and top landing page with average per customer revenue.Deliver and pitch your topic in the best possible manner with this Digital Audit Dashboard Indicating Bounce And Churn Rate With Visitors By Channel Inspiration PDF. Use them to share invaluable insights on Qualified Leads, Annually Recurring, Lifetime Value and impress your audience. This template can be altered and modified as per your expectations. So, grab it now.
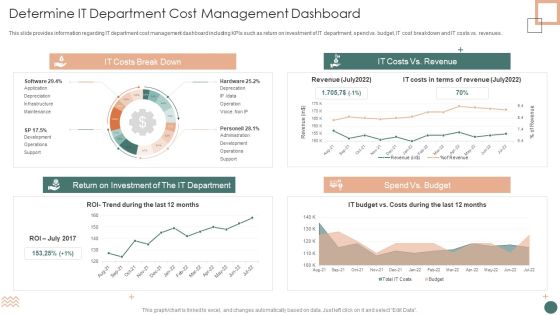
Improved Digital Expenditure Determine IT Department Cost Management Dashboard Introduction PDF
This slide provides information regarding IT department cost management dashboard including KPIs such as return on investment of IT department, spend vs. budget, IT cost breakdown and IT costs vs. revenues. Deliver and pitch your topic in the best possible manner with this Improved Digital Expenditure Determine IT Department Cost Management Dashboard Introduction PDF. Use them to share invaluable insights on Return Investment, Depreciation, Costs Break and impress your audience. This template can be altered and modified as per your expectations. So, grab it now.
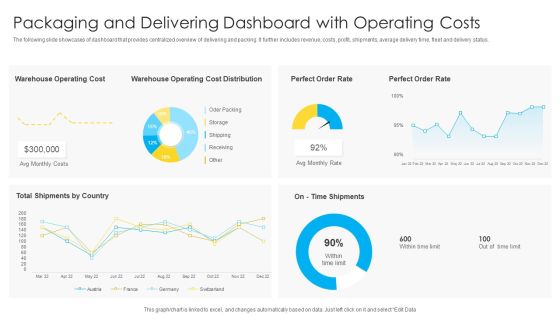
Packaging And Delivering Dashboard With Operating Costs Topics PDF
The following slide showcases of dashboard that provides centralized overview of delivering and packing. It further includes revenue, costs, profit, shipments, average delivery time, fleet and delivery status. Showcasing this set of slides titled Packaging And Delivering Dashboard With Operating Costs Topics PDF. The topics addressed in these templates are Warehouse Operating Cost, Perfect Order Rate, Avg Monthly Costs. All the content presented in this PPT design is completely editable. Download it and make adjustments in color, background, font etc. as per your unique business setting.
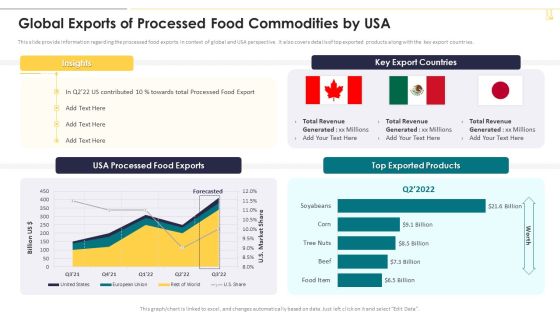
Global Exports Of Processed Food Commodities By Usa Graphics PDF
This slide provide information regarding the processed food exports in context of global and USA perspective. It also covers details of top exported products along with the key export countries. Deliver and pitch your topic in the best possible manner with this Global Exports Of Processed Food Commodities By Usa Graphics PDF. Use them to share invaluable insights on Top Exported Products, Key Export Countries, Total Revenue and impress your audience. This template can be altered and modified as per your expectations. So, grab it now.

Guide To Client Success Customer Success KPI Dashboard To Measure Support Team Performance Topics PDF
Mentioned slide showcases customer success dashboard that company is currently using to measure its support team performance. Kpis covered in the dashboard are health score, retention cost, churn rate etc. Deliver an awe inspiring pitch with this creative Guide To Client Success Customer Success KPI Dashboard To Measure Support Team Performance Topics PDF bundle. Topics like Customer Churn Rate, Customer Retention Cost, Revenue can be discussed with this completely editable template. It is available for immediate download depending on the needs and requirements of the user.

Supply Chain Management Analyzing Impact Of Blockchain Iot On Major Kpis Inspiration PDF
This slide showcases impact analysis of blockchain internet of things IoT on key performance indicators KPIs. It provides information about efficiency, security, risk, costs, business models, revenue resources, etc. Deliver an awe inspiring pitch with this creative Supply Chain Management Analyzing Impact Of Blockchain Iot On Major Kpis Inspiration PDF bundle. Topics like Managements Feedback, Post IoT Implementation, Opportunities For New can be discussed with this completely editable template. It is available for immediate download depending on the needs and requirements of the user.

Business Performance Review Dashboard To Measure Overall Business Performance Formats PDF
The following slide highlights a comprehensive quarterly business review QBR dashboard which can be used by the organization to evaluate business performance. The metrics used for review are total revenue, new customers, gross profit, overall costs, sales comparison, sales by different products and top performing channels. Showcasing this set of slides titled Business Performance Review Dashboard To Measure Overall Business Performance Formats PDF. The topics addressed in these templates are Sales Comparison, Sales Product, High Performing. All the content presented in this PPT design is completely editable. Download it and make adjustments in color, background, font etc. as per your unique business setting.

Business Performance Review Report To Evaluate Performance Of Sales Rep Infographics PDF
The following slide highlights quarterly business review QBR report which can be used by firm to evaluate the efficiency of sales rep. information covered in this slide is related to total sales by employees in different quarters, number of calls made. Pitch your topic with ease and precision using this Business Performance Review Report To Evaluate Performance Of Sales Rep Infographics PDF. This layout presents information on Revenue Sales, Tim Paine, Number Colds Calls. It is also available for immediate download and adjustment. So, changes can be made in the color, design, graphics or any other component to create a unique layout.

Online Marketing Activities KPI Dashboard To Improve Sales Ideas PDF
This slide covers online marketing dashboard to improve sales. It involves details such as web performance, conversion funnel, revenue this month, traffic sources and number of followers on social media.Pitch your topic with ease and precision using this Online Marketing Activities KPI Dashboard To Improve Sales Ideas PDF. This layout presents information on Email Performance, Web Performance, Cost Conversion. It is also available for immediate download and adjustment. So, changes can be made in the color, design, graphics or any other component to create a unique layout.
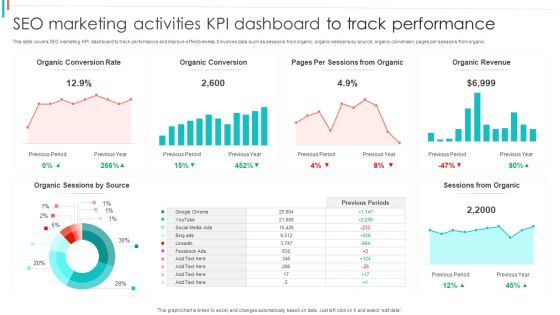
SEO Marketing Activities KPI Dashboard To Track Performance Brochure PDF
This slide covers SEO marketing KPI dashboard to track performance and improve effectiveness. It involves data such as sessions from organic, organic sessions by source, organic conversion, pages per sessions from organic.Pitch your topic with ease and precision using this SEO Marketing Activities KPI Dashboard To Track Performance Brochure PDF. This layout presents information on Organic Conversion, Sessions Organic, Organic Revenue. It is also available for immediate download and adjustment. So, changes can be made in the color, design, graphics or any other component to create a unique layout.

Four Year Company Sales Unsatisfactory Performance Demonstration PDF
This slide covers the data on the performance of sales department of the company to have a clear idea about the revenues. It shows decrease in the number of sales in the last 4 years 2020 to 2023 which leads in degrading companys reputation and loss of stakeholders.Showcasing this set of slides titled Four Year Company Sales Unsatisfactory Performance Demonstration PDF. The topics addressed in these templates are Declining Sales, Restrictions, Insights. All the content presented in this PPT design is completely editable. Download it and make adjustments in color, background, font etc. as per your unique business setting.

Decline In Product Sales And Website Traffic For Past Four Years Introduction PDF
This slide shows the decline in product sales and website traffic for past four years due to multiple reasons such as low customer engagement, inappropriate content, etc. that results in decreasing business revenues. Deliver an awe inspiring pitch with this creative Decline In Product Sales And Website Traffic For Past Four Years Introduction PDF bundle. Topics like Product Sales, Website Traffic can be discussed with this completely editable template. It is available for immediate download depending on the needs and requirements of the user.

B2B Market Segmentation Dashboard Microsoft PDF
This slide illustrates the market segmentation dashboard for B2B which can benefit them to improve the focus and boost the revenue of the organization. It includes segmentation based in company size and different industries under B2B market. Pitch your topic with ease and precision using this B2B Market Segmentation Dashboard Microsoft PDF. This layout presents information on Industries, Market Segmentation, Service. It is also available for immediate download and adjustment. So, changes can be made in the color, design, graphics or any other component to create a unique layout.

Sales Procedure Automation To Enhance Sales Dashboard Depicting Sales Kpis To Track Current Status Introduction PDF
This slide shows the dashboard that depicts sales KPIs to track current status which involves won and lost opportunities, revenues and pipeline by territory, sales by different products, etc.Deliver an awe inspiring pitch with this creative Sales Procedure Automation To Enhance Sales Dashboard Depicting Sales Kpis To Track Current Status Introduction PDF bundle. Topics like Won Opportunities, Total Opportunities, Pipeline Employee can be discussed with this completely editable template. It is available for immediate download depending on the needs and requirements of the user.

Competitive Assessment Based On Market Share Film Media Company Profile Ppt PowerPoint Presentation File Design Inspiration PDF
This slide represents the film production house comparison with competitors based on market share which shows our leading company with greatest share in US market.Deliver and pitch your topic in the best possible manner with this Competitive Assessment Based On Market Share Film Media Company Profile Ppt PowerPoint Presentation File Design Inspiration PDF. Use them to share invaluable insights on Compared Competitors, Calculated Based, Office Revenue and impress your audience. This template can be altered and modified as per your expectations. So, grab it now.
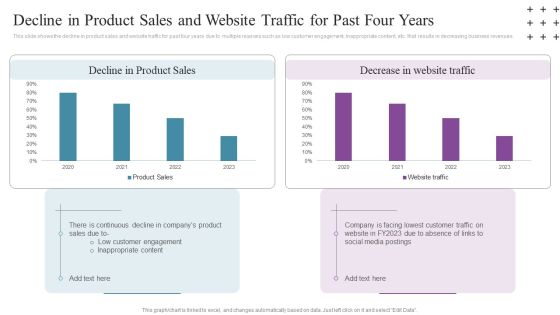
Social Networking Program Decline In Product Sales And Website Traffic For Past Four Years Microsoft PDF
This slide shows the decline in product sales and website traffic for past four years due to multiple reasons such as low customer engagement, inappropriate content, etc. that results in decreasing business revenues. Deliver an awe inspiring pitch with this creative Social Networking Program Decline In Product Sales And Website Traffic For Past Four Years Microsoft PDF bundle. Topics like Decline Product Sales, Decrease Website Traffic, 2020 To 2023 can be discussed with this completely editable template. It is available for immediate download depending on the needs and requirements of the user.
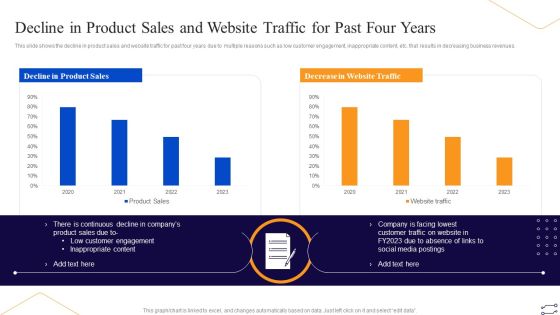
Online Marketing Tactics To Enhance Sales Decline In Product Sales And Website Traffic For Past Background PDF
This slide shows the decline in product sales and website traffic for past four years due to multiple reasons such as low customer engagement, inappropriate content, etc. that results in decreasing business revenues. Deliver an awe inspiring pitch with this creative Online Marketing Tactics To Enhance Sales Decline In Product Sales And Website Traffic For Past Background PDF bundle. Topics like Decline Product Sales, Decrease Website Traffic, 2020 To 2023 can be discussed with this completely editable template. It is available for immediate download depending on the needs and requirements of the user.

Results Of Poor Smarketing Ppt PowerPoint Presentation File Brochure PDF
This slides shows impacts of poor sales and marketing alignment on business. It provides information about revenue loss, loss of qualified leads, loss of customers, etc. Showcasing this set of slides titled Results Of Poor Smarketing Ppt PowerPoint Presentation File Brochure PDF. The topics addressed in these templates are Loss Customers, Decrease Customer Satisfaction, Poor Content Marketing. All the content presented in this PPT design is completely editable. Download it and make adjustments in color, background, font etc. as per your unique business setting.

Project Drivers Kpi Dashboard With Digital Marketing Metrics Ppt PowerPoint Presentation File Clipart PDF
This slide outlines the digital marketing project drivers dashboard which includes components such as growth, No. orders, revenue and EBITDA margin. It also provides information about the website traffic, conversion rate and new customers which can assist managers to track digital marketing performance. Showcasing this set of slides titled Project Drivers Kpi Dashboard With Digital Marketing Metrics Ppt PowerPoint Presentation File Clipart PDF. The topics addressed in these templates are Website Traffic, Conversion Rate, New Customers. All the content presented in this PPT design is completely editable. Download it and make adjustments in color, background, font etc. as per your unique business setting.

Implementing Marketing Mix Strategy To Enhance Overall Performance Social Media Dashboard To Understand Marketing Efforts Guidelines PDF
The following dashboard helps the organization in analyzing the key metrics to track performance of their social media digital marketing strategy, these metrics are followers, likes and visits. Deliver and pitch your topic in the best possible manner with this Implementing Marketing Mix Strategy To Enhance Overall Performance Social Media Dashboard To Understand Marketing Efforts Guidelines PDF. Use them to share invaluable insights on Sales, New Customer, New Revenue and impress your audience. This template can be altered and modified as per your expectations. So, grab it now.

Dashboard Showing Construction Project Metrics Sample PDF
This slide shows the dashboard which depicts the construction project management performance such as billing date, working profit, total cost, billed percentage, budget spent, completed projects and comparison of two companies about revenues earned from project. Showcasing this set of slides titled Dashboard Showing Construction Project Metrics Sample PDF. The topics addressed in these templates are Dashboard, Construction Project Metrics. All the content presented in this PPT design is completely editable. Download it and make adjustments in color, background, font etc. as per your unique business setting.

IT Operations Dashboard For Project Metrics Portrait PDF
This slide focuses on dashboard that provides information about the information technology operations for managing IT project which covers the investments, billed amount, time taken to complete the project, customer satisfaction, monthly expenses, service level agreement status, etc. Pitch your topic with ease and precision using this IT Operations Dashboard For Project Metrics Portrait PDF. This layout presents information on Revenues, Investments, Monthly Expenses. It is also available for immediate download and adjustment. So, changes can be made in the color, design, graphics or any other component to create a unique layout.
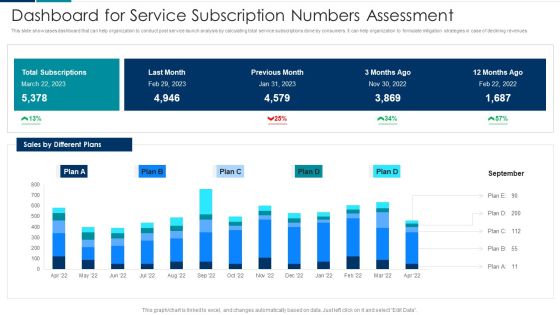
Managing New Service Roll Out And Marketing Procedure Dashboard For Service Subscription Numbers Assessment Clipart PDF
This slide showcases dashboard that can help organization to conduct post service launch analysis by calculating total service subscriptions done by consumers. It can help organization to formulate mitigation strategies in case of declining revenues. Deliver an awe inspiring pitch with this creative Managing New Service Roll Out And Marketing Procedure Dashboard For Service Subscription Numbers Assessment Clipart PDF bundle. Topics like Dashboard For Service, Subscription Numbers Assessment can be discussed with this completely editable template. It is available for immediate download depending on the needs and requirements of the user.
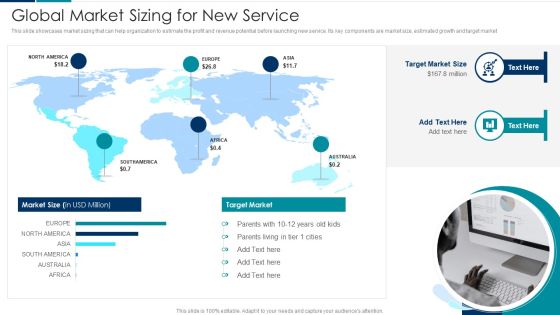
Managing New Service Roll Out And Marketing Procedure Global Market Sizing For New Service Inspiration PDF
This slide showcases market sizing that can help organization to estimate the profit and revenue potential before launching new service. Its key components are market size, estimated growth and target market. Deliver an awe inspiring pitch with this creative Managing New Service Roll Out And Marketing Procedure Global Market Sizing For New Service Inspiration PDF bundle. Topics like Market Size, Target Market, Global can be discussed with this completely editable template. It is available for immediate download depending on the needs and requirements of the user.

Retail KPI Dashboard To Evaluate Merchandising Sales Plan Performance Rules PDF
Mentioned slide showcases merchandising dashboard which can be used to analyze sales performance of various products. It covers metrics such as different types of product sold, revenue earned, payment methods used, sales in different years etc.Showcasing this set of slides titled Retail KPI Dashboard To Evaluate Merchandising Sales Plan Performance Rules PDF. The topics addressed in these templates are Clothing Apparel, Trend Merchandise, Items Sold. All the content presented in this PPT design is completely editable. Download it and make adjustments in color, background, font etc. as per your unique business setting.

Customer Service Metrics Dashboard With Net Retention Rate Sample PDF
This slide showcases KPI dashboard for customer service that can help to compare the customer churn rate, revenue churn rate, net retention rate and MRR growth rate as compared to previous month. Its key elements are net promoter score, loyal customer rate, percentage of premium users and customer lifetime value. Pitch your topic with ease and precision using this Customer Service Metrics Dashboard With Net Retention Rate Sample PDF. This layout presents information on Loyal Customer Rate, Premium Users, Customer Lifetime Value. It is also available for immediate download and adjustment. So, changes can be made in the color, design, graphics or any other component to create a unique layout.

Consumer Retargeting Techniques Current Problem Declining Website Conversion Rate Topics PDF
This slide covers graphical representation of the companys current conversion rates. It also includes some key insights such as decreasing repeat purchases, returning purchases to repeat purchaser rate, fall in revenue, etc. Deliver and pitch your topic in the best possible manner with this Consumer Retargeting Techniques Current Problem Declining Website Conversion Rate Topics PDF. Use them to share invaluable insights on Repeat Purchases, Returning Purchasers, Quartile Segments and impress your audience. This template can be altered and modified as per your expectations. So, grab it now.

Consumer Retargeting Techniques Impact Of Retargeting Campaign On Conversion Rates Portrait PDF
This slide covers the graphical representation of positive outcomes of the retargeting campaigns on website conversion rate. It also includes key insights such as increased repeat purchase rate, decreased returning purchasers to repeat purchaser rate, repeat customer revenue, etc. Deliver and pitch your topic in the best possible manner with this Consumer Retargeting Techniques Impact Of Retargeting Campaign On Conversion Rates Portrait PDF. Use them to share invaluable insights on Returning Purchasers, Repeat Purchaser, Repeat Customers and impress your audience. This template can be altered and modified as per your expectations. So, grab it now.
Tracking Channel Campaign Metrics To Measure Web Traffic Sample PDF
This slide covers measuring campaign key performance indicators through tracking channel web traffic which includes total visit, cost per click, engagement rate and total impressions. Pitch your topic with ease and precision using this Tracking Channel Campaign Metrics To Measure Web Traffic Sample PDF. This layout presents information on Revenue By Channel, Website Demographics, Product Sales Trend. It is also available for immediate download and adjustment. So, changes can be made in the color, design, graphics or any other component to create a unique layout.
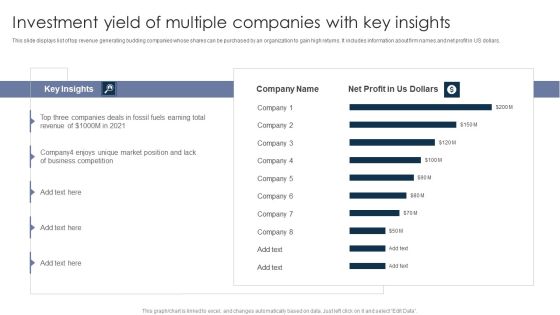
Investment Yield Of Multiple Companies With Key Insights Ppt PowerPoint Presentation Layouts Display
This slide displays list of top revenue generating budding companies whose shares can be purchased by an organization to gain high returns. It includes information about firm names and net profit in US dollars. Showcasing this set of slides titled Investment Yield Of Multiple Companies With Key Insights Ppt PowerPoint Presentation Layouts Display. The topics addressed in these templates are Three Companies, Business Competition, Fuels Earning. All the content presented in this PPT design is completely editable. Download it and make adjustments in color, background, font etc. as per your unique business setting.

Property And Casualties Insurance Business Profile Competitor Comparison Summary PDF
The slide highlights top competitors of insurance company in global market. It depicts company comparison on the basis of total policy holders, revenue per customer, cost per claim, return on surplus, renewal rate and policy sales growth. Deliver and pitch your topic in the best possible manner with this Property And Casualties Insurance Business Profile Competitor Comparison Summary PDF. Use them to share invaluable insights on Average Cost Per Claim, Policy Sales Growth and impress your audience. This template can be altered and modified as per your expectations. So, grab it now.

Pureprofile Business Overview Operational Kpis Ppt Summary Introduction PDF
The following slide showcases the business operations KPI to illustrate the performance of the organization. The KPIs include YOY growth, repeat clients revenue, survey completion growth, client growth, and incentives earned. Deliver and pitch your topic in the best possible manner with this Pureprofile Business Overview Operational Kpis Ppt Summary Introduction PDF. Use them to share invaluable insights on Average Client Tenure, Panel Acquisition Growth, SaaS Clients Growth and impress your audience. This template can be altered and modified as per your expectations. So, grab it now.

Corporate Social Responsibility Initiatives And Spending Multinational Legal Firm Company Profile Introduction PDF
This slide highlights the CSR spend distribution by inhouse and partner spend. It also highlights the CSR initiatives that are carbon footprint reduction, labor policies, hunger program, community development and healthcare services. Deliver an awe inspiring pitch with this creative Corporate Social Responsibility Initiatives And Spending Multinational Legal Firm Company Profile Introduction PDF bundle. Topics like Net Revenue, Corporate Social, Responsibility Initiatives can be discussed with this completely editable template. It is available for immediate download depending on the needs and requirements of the user.
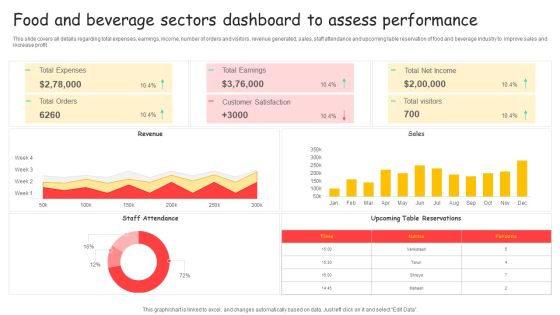
Food And Beverage Sectors Dashboard To Assess Performance Ppt Styles Elements PDF
This slide covers all details regarding total expenses, earnings, income, number of orders and visitors, revenue generated, sales, staff attendance and upcoming table reservation of food and beverage industry to improve sales and increase profit. Showcasing this set of slides titled Food And Beverage Sectors Dashboard To Assess Performance Ppt Styles Elements PDF. The topics addressed in these templates are Total Expenses, Total Earnings, Total Net Income. All the content presented in this PPT design is completely editable. Download it and make adjustments in color, background, font etc. as per your unique business setting.
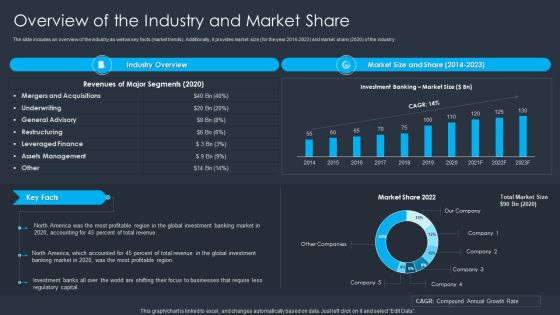
Merger And Acquisition Buying Strategy For Business Growth Overview Of The Industry And Market Share Template PDF
The slide includes an overview of the industry as well as key facts market trends. Additionally, it provides market size for the year 2014 to 2023 and market share 2020 of the industry. Deliver an awe inspiring pitch with this creative Merger And Acquisition Buying Strategy For Business Growth Overview Of The Industry And Market Share Template PDF bundle. Topics like Revenue, Investment Banking Market, Profitable can be discussed with this completely editable template. It is available for immediate download depending on the needs and requirements of the user.

Retail Outlet Operational Efficiency Analytics Overview Of Retail Stores Rules PDF
This slide provides information regarding retail company in terms of headquarters, revenues, total number of employees, number of stores across USA. It also covers details of common operational challenges faced by stores. Deliver an awe inspiring pitch with this creative Retail Outlet Operational Efficiency Analytics Overview Of Retail Stores Rules PDF bundle. Topics like Retail Stores, Across USA, Common Operational Challenges can be discussed with this completely editable template. It is available for immediate download depending on the needs and requirements of the user.
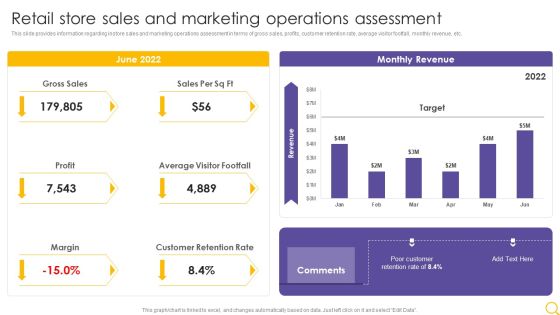
Retail Outlet Operational Efficiency Analytics Retail Store Sales And Marketing Operations Assessment Designs PDF
This slide provides information regarding instore sales and marketing operations assessment in terms of gross sales, profits, customer retention rate, average visitor footfall, monthly revenue, etc. Deliver and pitch your topic in the best possible manner with this Retail Outlet Operational Efficiency Analytics Retail Store Sales And Marketing Operations Assessment Designs PDF. Use them to share invaluable insights on Gross Sales, Profit, Average Visitor Footfall and impress your audience. This template can be altered and modified as per your expectations. So, grab it now.

Dashboard For E Commerce Project Management Ppt Ideas Design Inspiration PDF
Mentioned slide illustrates a dashboard which can be used by company for e-Commerce project management. The various metrics mentioned in the slide are new orders, total revenue, expenses, new users, etc. Showcasing this set of slides titled Dashboard For E Commerce Project Management Ppt Ideas Design Inspiration PDF. The topics addressed in these templates are New Orders, Total Income, Total Expense. All the content presented in this PPT design is completely editable. Download it and make adjustments in color, background, font etc. as per your unique business setting.
 Home
Home