Financial Goals

How Much Money We Need Ppt PowerPoint Presentation Pictures
This is a how much money we need ppt powerpoint presentation pictures. This is a two stage process. The stages in this process are business, marketing, management, production, planning.
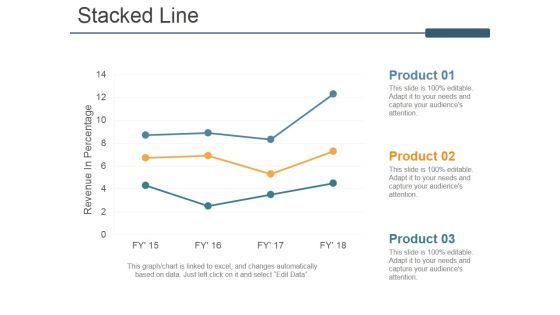
Stacked Line Ppt PowerPoint Presentation Ideas Model
This is a stacked line ppt powerpoint presentation ideas model. This is a three stage process. The stages in this process are revenue in percentage, stacked line, product, business, marketing.

Dashboard Analytics Diagram Presentation Powerpoint
This is a dashboard analytics diagram presentation powerpoint. This is a three stage process. The stages in this process are value, analytic, reporting.
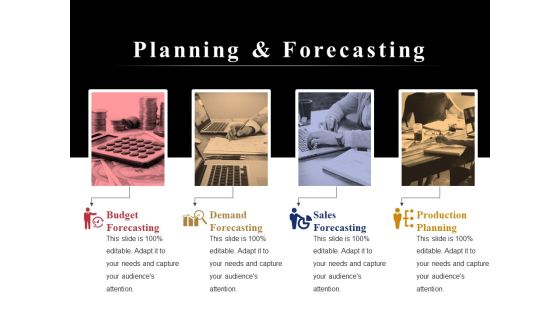
Planning And Forecasting Ppt PowerPoint Presentation Infographic Template Graphics Tutorials
This is a planning and forecasting ppt powerpoint presentation infographic template graphics tutorials. This is a four stage process. The stages in this process are budget forecasting, demand forecasting, sales forecasting, production planning.

Design Public Policy Powerpoint Slide Presentation Tips
This is a design public policy powerpoint slide presentation tips. This is a five stage process. The stages in this process are target groups, create orders, deliver products, accompany customer, analyse customer, analyse processes.

Crowd Sourcing International Business Ppt Diagram
This is a crowd sourcing international business ppt diagram. This is a five stage process. The stages in this process are strategy, focus groups, views and ideas, values, survey.\n\n\n

Measurement Of Portfolio Analysis Ppt PowerPoint Presentation Influencers
This is a measurement of portfolio analysis ppt powerpoint presentation influencers. This is a four stage process. The stages in this process are your current portfolio, holding, current weight, current value.
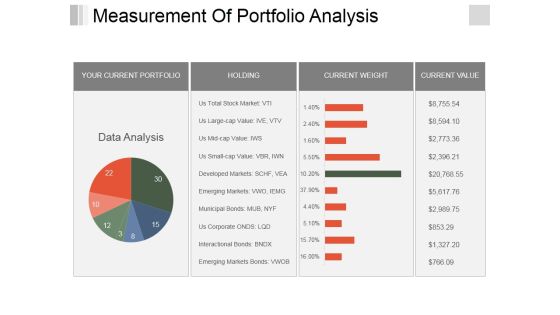
Measurement Of Portfolio Analysis Ppt PowerPoint Presentation Outline Graphic Images
This is a measurement of portfolio analysis ppt powerpoint presentation outline graphic images. This is a four stage process. The stages in this process are your current portfolio, holding, current weight, current value.

Measurement Of Portfolio Analysis Ppt PowerPoint Presentation Slides Clipart Images
This is a measurement of portfolio analysis ppt powerpoint presentation slides clipart images. This is a four stage process. The stages in this process are holding, your current portfolio, current weight, current value.

Corporate Dashboard Template Presentation Portfolio
This is a corporate dashboard template presentation portfolio. This is a five stage process. The stages in this process are product, strategy, marketing, customer, management.

Clustered Bar Ppt PowerPoint Presentation Good
This is a clustered bar ppt powerpoint presentation good. This is a five stage process. The stages in this process are product, circular, business, marketing, bar graph.

Clustered Column Ppt PowerPoint Presentation Picture
This is a clustered column ppt powerpoint presentation picture. This is a two stage process. The stages in this process are product, jan, feb, mar, apr.

Bar Graph Ppt PowerPoint Presentation File Graphic Images
This is a bar graph ppt powerpoint presentation file graphic images. This is a three stage process. The stages in this process are business, marketing, chart, finance, product.

Area Chart Ppt PowerPoint Presentation Styles Designs
This is a area chart ppt powerpoint presentation styles designs. This is a two stage process. The stages in this process are area chart, product.

Internal Analysis Template 2 Ppt PowerPoint Presentation Infographics Graphics
This is a internal analysis template 2 ppt powerpoint presentation infographics graphics. This is a three stage process. The stages in this process are productivity, profitability, turnover.

Area Chart Ppt PowerPoint Presentation Inspiration Images
This is a area chart ppt powerpoint presentation inspiration images. This is a two stage process. The stages in this process are area chart, product, sales in percentage.

Stacked Column Ppt PowerPoint Presentation Ideas Pictures
This is stacked column ppt powerpoint presentation ideas pictures. This is a two stage process. The stages in this process are product, in million, strategy management, business, finance.
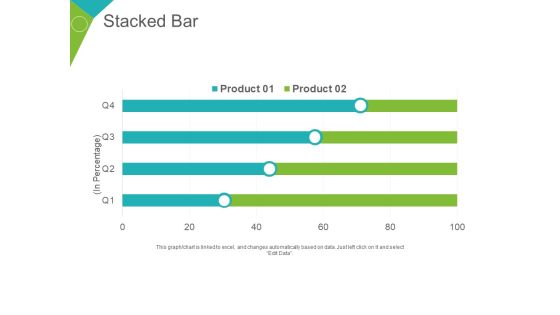
Stacked Bar Ppt PowerPoint Presentation Summary Portfolio
This is a stacked bar ppt powerpoint presentation summary portfolio. This is a two stage process. The stages in this process are product, business, planning, marketing, in percentage.
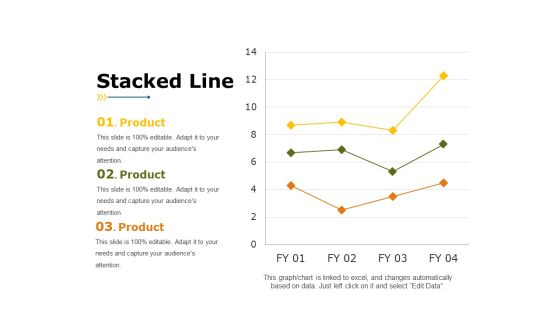
Stacked Line Ppt PowerPoint Presentation Background Image
This is a stacked line ppt powerpoint presentation background image. This is a three stage process. The stages in this process are product, stacked line, business, marketing, finance.

Clustered Column Ppt PowerPoint Presentation Icon Professional
This is a clustered column ppt powerpoint presentation icon professional. This is a two stage process. The stages in this process are product, business, marketing, finance, planning, graph.
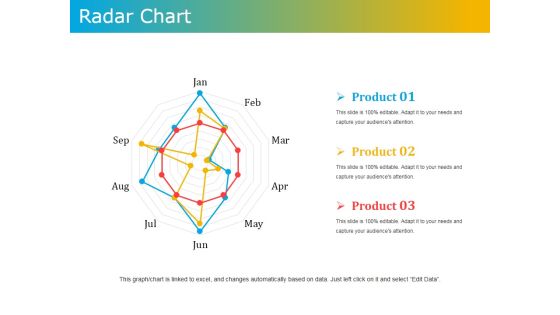
Radar Chart Ppt PowerPoint Presentation Outline Model
This is a radar chart ppt powerpoint presentation outline model. This is a three stage process. The stages in this process are radar chart, product, business, marketing, management.

Clustered Column Ppt PowerPoint Presentation Ideas Show
This is a clustered column ppt powerpoint presentation ideas show. This is a two stage process. The stages in this process are product, percentage, finance, business, bar graph.

Clustered Bar Ppt PowerPoint Presentation Styles Portfolio
This is a clustered bar ppt powerpoint presentation styles portfolio. This is a two stage process. The stages in this process are product, profit, bar graph, growth, success.

Clustered Column Ppt PowerPoint Presentation Layouts Ideas
This is a clustered column ppt powerpoint presentation layouts ideas. This is a two stage process. The stages in this process are product, profit, bar graph, growth, finance.

Clustered Column Ppt PowerPoint Presentation Show Introduction
This is a clustered column ppt powerpoint presentation show introduction. This is a two stage process. The stages in this process are product, profit, bar graph.

Clustered Bar Ppt PowerPoint Presentation Layouts Professional
This is a clustered bar ppt powerpoint presentation layouts professional. This is a two stage process. The stages in this process are clustered bar, product, profit, percentage.

Area Stacked Ppt PowerPoint Presentation Show Mockup
This is a area stacked ppt powerpoint presentation show mockup. This is a two stage process. The stages in this process are area stacked, product, percentage, year, finance.

Accounting Key Performance Indicators Ppt Powerpoint
This is a accounting key performance indicators ppt powerpoint. This is a four stage process. The stages in this process are cost per invoice, invoice processing speed, productivity per team member, variance analysis.

Crm Dashboard Sales Dashboard Template Ppt PowerPoint Presentation Inspiration
This is a crm dashboard sales dashboard template ppt powerpoint presentation inspiration. This is a five stage process. The stages in this process are sales by product march, lead owner breakdown, total lead ownership, month over month closing trend.
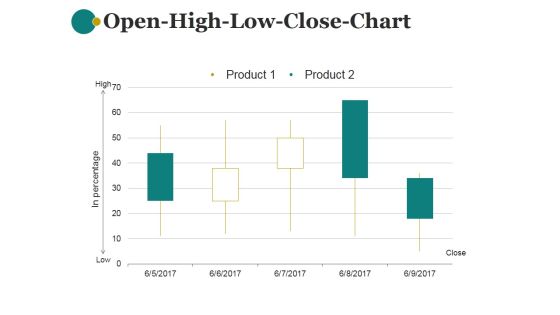
Open High Low Close Chart Ppt PowerPoint Presentation Information
This is a open high low close chart ppt powerpoint presentation information. This is a five stage process. The stages in this process are product, in percentage, close, low, high.

Project Progress And Reasons For Delay Ppt PowerPoint Presentation Portfolio Portrait
This is a project progress and reasons for delay ppt powerpoint presentation portfolio portrait. This is a two stage process. The stages in this process are product, marketing, business, process, success.

Clustered Column Ppt PowerPoint Presentation Model File Formats
This is a clustered column ppt powerpoint presentation model file formats. This is a two stage process. The stages in this process are column chart, business, product, compare, finance.
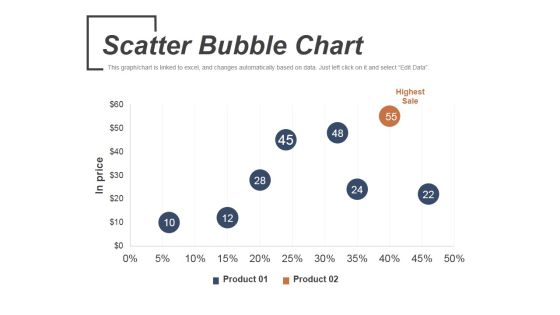
Scatter Bubble Chart Ppt PowerPoint Presentation Infographic Template Graphics
This is a scatter bubble chart ppt powerpoint presentation infographic template graphics. This is a two stage process. The stages in this process are highest sale, product, in price.

Stacked Bar Template 1 Ppt PowerPoint Presentation Infographic Template Format
This is a stacked bar template 1 ppt powerpoint presentation infographic template format. This is a four stage process. The stages in this process are product, stacked bar, business, marketing, bar graph.
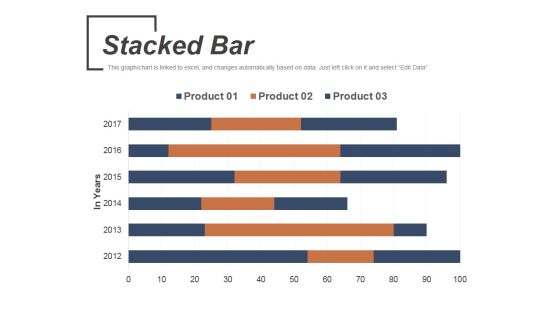
Stacked Bar Template 2 Ppt PowerPoint Presentation Slides Introduction
This is a stacked bar template 2 ppt powerpoint presentation slides introduction. This is a six stage process. The stages in this process are product, stacked bar, business, marketing, in years.

Combo Chart Ppt PowerPoint Presentation Portfolio Themes
This is a combo chart ppt powerpoint presentation portfolio themes. This is a three stage process. The stages in this process are market size, product, management, finance, chart, marketing.

Area Chart Ppt PowerPoint Presentation Infographics Graphics Tutorials
This is a area chart ppt powerpoint presentation infographics graphics tutorials. This is a two stage process. The stages in this process are product, area chart, sales in percentage.

Bar Chart Ppt PowerPoint Presentation Slides Design Ideas
This is a bar chart ppt powerpoint presentation slides design ideas. This is a six stage process. The stages in this process are product, bar chart, sales in percentage.

Clustered Column Line Ppt PowerPoint Presentation File Examples
This is a clustered column line ppt powerpoint presentation file examples. This is a three stage process. The stages in this process are sales in percentage, product, business, marketing, success.

Clustered Column Line Ppt PowerPoint Presentation Model Images
This is a clustered column line ppt powerpoint presentation model images. This is a four stage process. The stages in this process are sales in percentage, product, business, marketing, bar graph.
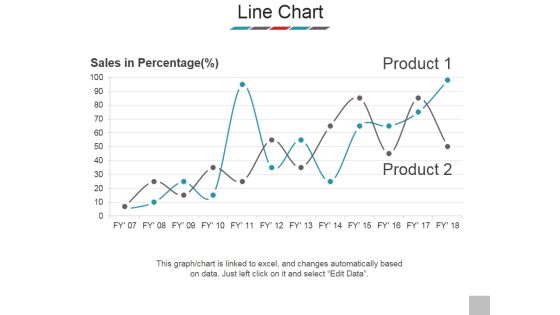
Line Chart Ppt PowerPoint Presentation Outline Samples
This is a line chart ppt powerpoint presentation outline samples. This is a two stage process. The stages in this process are sales in percentage, product, business, marketing, success.

Bar Graph Ppt PowerPoint Presentation Model Clipart
This is a bar graph ppt powerpoint presentation model clipart. This is a six stage process. The stages in this process are sales in percentage, product, bar graph, business, marketing.

Area Chart Ppt PowerPoint Presentation Inspiration Rules
This is a area chart ppt powerpoint presentation inspiration rules. This is a two stage process. The stages in this process are area chart, business, marketing, sales in percentage, product.
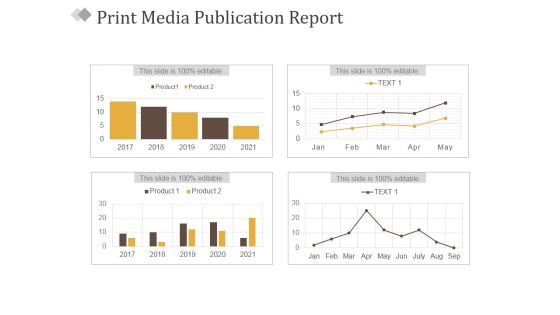
Print Media Publication Report Ppt PowerPoint Presentation Summary Information
This is a print media publication report ppt powerpoint presentation summary information. This is a four stage process. The stages in this process are business, product, marketing, management, success.

Line Chart Ppt PowerPoint Presentation Professional Smartart
This is a line chart ppt powerpoint presentation professional smartart. This is a two stage process. The stages in this process are in percentage, in years, product, finance, business.

Bar Graph Ppt PowerPoint Presentation Outline Layout
This is a bar graph ppt powerpoint presentation outline layout. This is a four stage process. The stages in this process are sales in percentage, product, bar graph, business, marketing.

Clustered Column Line Ppt PowerPoint Presentation Outline Infographic Template
This is a clustered column line ppt powerpoint presentation outline infographic template. This is a three stage process. The stages in this process are product, sales in percentage, business, marketing, success.
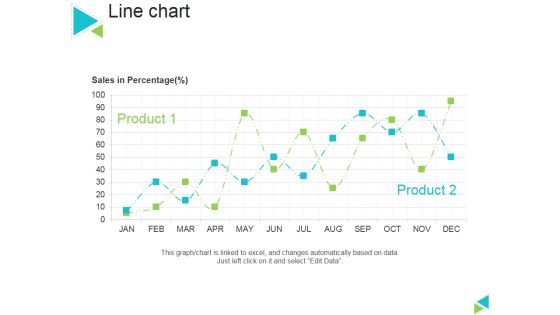
Line Chart Ppt PowerPoint Presentation Gallery Master Slide
This is a line chart ppt powerpoint presentation gallery master slide. This is a two stage process. The stages in this process are sales in percentage, product, line chart.

Combo Chart Ppt PowerPoint Presentation Styles Good
This is a combo chart ppt powerpoint presentation styles good. This is a eight stage process. The stages in this process are market size, growth rate, product, growth, strategy, graph, finance.
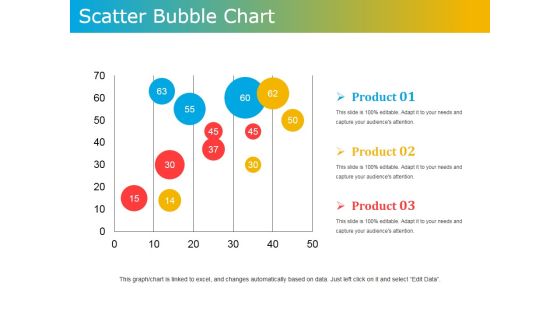
Scatter Bubble Chart Ppt PowerPoint Presentation Ideas Design Templates
This is a scatter bubble chart ppt powerpoint presentation ideas design templates. This is a three stage process. The stages in this process are product, scatter, bubble chart, business, marketing.

Line Chart Ppt PowerPoint Presentation Summary Graphic Tips
This is a line chart ppt powerpoint presentation summary graphic tips. This is a two stage process. The stages in this process are line chart, product, in percentage, analysis, business.

Clustered Column Ppt PowerPoint Presentation Pictures Graphics Template
This is a clustered column ppt powerpoint presentation pictures graphics template. This is a two stage process. The stages in this process are product, growth, success, business, bar graph.

Clustered Column Ppt PowerPoint Presentation Ideas Infographic Template
This is a clustered column ppt powerpoint presentation ideas infographic template. This is a two stage process. The stages in this process are clustered column, growth, finance, business, product.
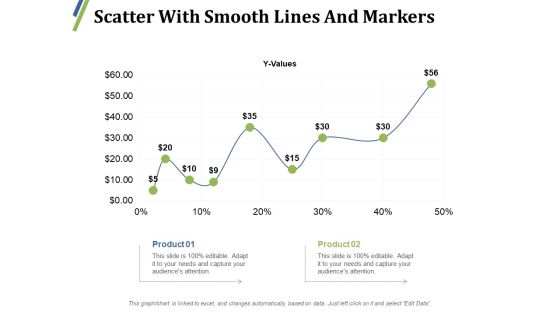
Scatter With Smooth Lines And Markers Ppt PowerPoint Presentation Outline Inspiration
This is a scatter with smooth lines and markers ppt powerpoint presentation outline inspiration. This is a two stage process. The stages in this process are product, percentage, finance, growth, line graph.

Clustered Bar Ppt PowerPoint Presentation Gallery Inspiration
This is a clustered bar ppt powerpoint presentation gallery inspiration. This is a four stage process. The stages in this process are clustered bar, product, profit, business, bar graph.

Stacked Line Chart Ppt PowerPoint Presentation Model Show
This is a stacked line chart ppt powerpoint presentation model show. This is a two stage process. The stages in this process are stacked line chart, product, profit, percentage, growth.

Cost Of Employee Turnover Ppt PowerPoint Presentation Infographic Template Example Introduction
This is a cost of employee turnover ppt powerpoint presentation infographic template example introduction. This is a two stage process. The stages in this process are cost of hiring a new employee, lost productivity and engagement, expense to onboard and train new employee, customer service issue and errors, impact on workplace culture.

Main Revenues Progress Levers For Each Firm And Sector Sales Trend Analysis Plans Graphics PDF
Presenting this set of slides with name main revenues progress levers for each firm and sector sales trend analysis plans graphics pdf. The topics discussed in these slides are top sales reps, top selling plans, new customers, sales funnel, sales goal ytd, top opportunities. This is a completely editable PowerPoint presentation and is available for immediate download. Download now and impress your audience.
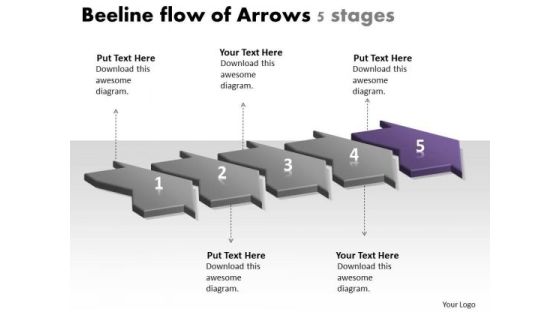
Beeline Flow Of Arrows 5 Stages Ppt Free Flowchart Program PowerPoint Templates
We present our beeline flow of arrows 5 stages ppt free flowchart program PowerPoint templates.Use our Finance PowerPoint Templates because,You envisage some areas of difficulty in the near future. The overall financial situation could be a source of worry. Use our Process and Flows PowerPoint Templates because,there is a crucial aspect that requires extra attention. Use our Arrows PowerPoint Templates because,To achieve sureshot success you need to come together at the right time, place and manner. Use our Shapes PowerPoint Templates because,It Highlights the results of you thought process and convinces your team of the reasons for selecting a particular path to follow. Use our Business PowerPoint Templates because, You can see clearly through to the bigger bowl ahead. Time your jump to perfection and hit the nail on the headUse these PowerPoint slides for presentations relating to 3d, arrow, background, banner, business, chart, diagram, direction, element, financial, flow, gradient, illustration, isolated, marketing, mirrored, placeholder, presentation, process, steps, success, teamwork, vector. The prominent colors used in the PowerPoint template are Purple, Gray, Black

Two Layered Venn Diagram Cycle Chart PowerPoint Slides
We present our two layered venn diagram Cycle Chart PowerPoint Slides.Use our Marketing PowerPoint Templates because Our PowerPoint Templates and Slides will let you Clearly mark the path for others to follow. Present our Business PowerPoint Templates because maximising sales of your product is the intended destination. Use our Shapes PowerPoint Templates because you know what it takes to keep it fit and healthy. Use our Finance PowerPoint Templates because you envisage some areas of difficulty in the near future. The overall financial situation could be a source of worry. Download our Symbol PowerPoint Templates because this helps you to put all your brilliant views to your audience.Use these PowerPoint slides for presentations relating to Background, Black, Blue, Business, Chart, Circle, Diagram, Drop, Financial, Green, Icon, Isolated, Overlapping, Process, Red, Round, Shadow, Shape, Three, Transparency, Vector, Venn, White. The prominent colors used in the PowerPoint template are Blue, Green, Black. We assure you our two layered venn diagram Cycle Chart PowerPoint Slides are Awesome. Customers tell us our Diagram PowerPoint templates and PPT Slides are Attractive. The feedback we get is that our two layered venn diagram Cycle Chart PowerPoint Slides are Luxuriant. We assure you our Business PowerPoint templates and PPT Slides are Amazing. People tell us our two layered venn diagram Cycle Chart PowerPoint Slides are Excellent. We assure you our Blue PowerPoint templates and PPT Slides are Tasteful.
 Home
Home