Financial Goals

5S Scoring Result Ppt Slides
This is a 5s scoring result ppt slides. This is a five stage process. The stages in this process are business.
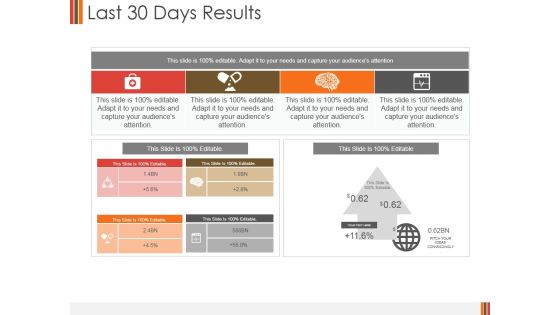
Last 30 Days Results Ppt PowerPoint Presentation Layouts Shapes
This is a last 30 days results ppt powerpoint presentation layouts shapes. This is a four stage process. The stages in this process are business, finance, management, analysis, strategy, success.
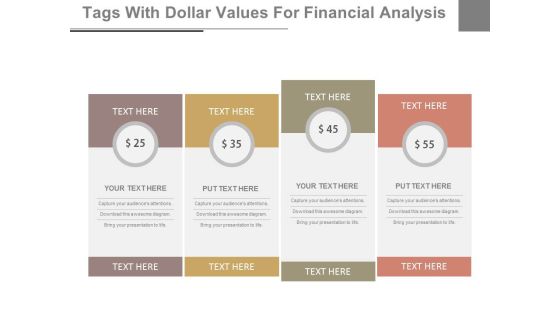
Dollar Value Pricing Table Powerpoint Slides
This PowerPoint template has been designed with dollar value pricing table chart. This PPT slide may be used for sample marketing proposal. Download this slide to build unique presentation.

Circle Chart For Value Analysis Powerpoint Slides
This PowerPoint template has been designed for business presentations and corporate slides. The PowerPoint template has a high quality design. You can download this PowerPoint slide for corporate presentations or annual meeting and business plans.

Start Up Expenses Ppt PowerPoint Presentation Model Objects
This is a start up expenses ppt powerpoint presentation model objects. This is a one stage process. The stages in this process are startup expenses, legal.
Text Tags And Icons With Percentage Values Powerpoint Slides
This PowerPoint template has been designed with graphics of text tags, icons and percentage values. Download this business diagram to outline business plan. Present your views and ideas with this impressive design.
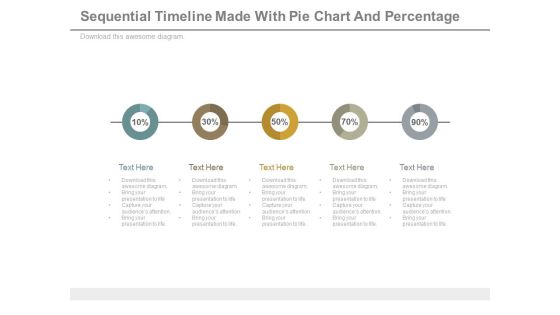
Sequential Timeline Diagram With Percentage Values Powerpoint Slides
This diagram contains graphics of linear circles timeline diagram. Download this diagram slide to display business planning and management. This diagram is editable you can edit text, color, shade and style as per you need.

Revenue Split By Product And Segment Ppt PowerPoint Presentation Outline Brochure
This is a revenue split by product and segment ppt powerpoint presentation outline brochure. This is a two stage process. The stages in this process are carbon steel, alloy steel, revenue by product, stainless steel, segment.
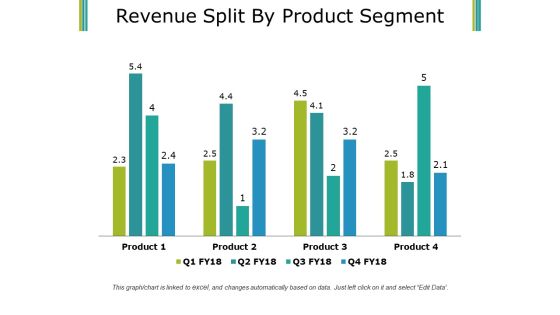
Revenue Split By Product Segment Template 1 Ppt PowerPoint Presentation Infographics Smartart
This is a revenue split by product segment template 1 ppt powerpoint presentation infographics smartart. This is a four stage process. The stages in this process are business, finance, marketing, bar graph, product.
Product Launch Budget Plan Ppt PowerPoint Presentation Icon Slide
This is a product launch budget plan ppt powerpoint presentation icon slide. This is a seven stage process. The stages in this process are bar graph, icons, percentage, finance, business.

3D Bar Chart For Percentage Values Comparison Ppt PowerPoint Presentation Professional Visual Aids
This is a 3d bar chart for percentage values comparison ppt powerpoint presentation professional visual aids. This is a five stage process. The stages in this process are art, colouring, paint brush.

Column Chart Employee Value Proposition Ppt PowerPoint Presentation Slides Graphics Design
This is a column chart employee value proposition ppt powerpoint presentation slides graphics design. This is a two stage process. The stages in this process are business, management, strategy, analysis, marketing.
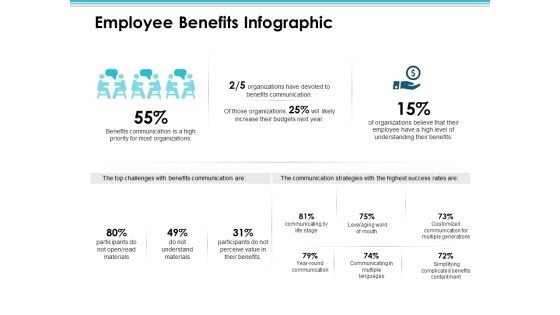
Employee Benefits Infographic Employee Value Proposition Ppt PowerPoint Presentation Styles Diagrams
This is a employee benefits infographic employee value proposition ppt powerpoint presentation styles diagrams. This is a three stage process. The stages in this process are business, management, strategy, analysis, marketing.
Percentage Value Comparison Pie Chart Icon Ppt PowerPoint Presentation Model Clipart Images
This is a percentage value comparison pie chart icon ppt powerpoint presentation model clipart images. This is a three stage process. The stages in this process are percentage icon, dividend icon, portion icon.
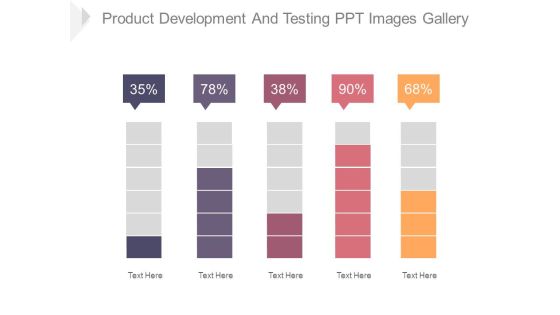
Product Development And Testing Ppt Images Gallery
This is a product development and testing ppt images gallery. This is a five stage process. The stages in this process are business, strategy, finance, management, analysis.
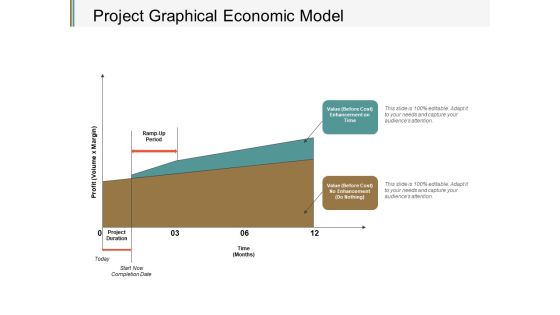
Project Graphical Economic Model Ppt PowerPoint Presentation Gallery Portfolio
This is a project graphical economic model ppt powerpoint presentation gallery portfolio. This is a two stage process. The stages in this process are product improvement, product enhancement, product upgradation.

Sales Kpi Performance Summary Ppt PowerPoint Presentation Infographic Template Elements
This is a sales kpi performance summary ppt powerpoint presentation infographic template elements. This is a seven stage process. The stages in this process are revenue comparison, quantity comparison, product sales mix, regional sales mix, budget.

Sales Kpi Performance Summary Ppt PowerPoint Presentation Show Inspiration
This is a sales kpi performance summary ppt powerpoint presentation show inspiration. This is a two stage process. The stages in this process are revenue comparison, quantity comparison, product sales mix, regional sales mix, budget.

Product Life Cycle Ppt PowerPoint Presentation Summary Deck
This is a product life cycle ppt powerpoint presentation summary deck. This is a four stage process. The stages in this process are introduction, growth, maturity, decline.

Competitors Average Price Product Ppt PowerPoint Presentation Icon Layout
This is a competitors average price product ppt powerpoint presentation icon layout. This is a five stage process. The stages in this process are company, bar graph, finance, business, marketing.

Product Comparison Data Bar Graph Ppt Powerpoint Presentation Slides Show
This is a product comparison data bar graph ppt powerpoint presentation slides show. This is a four stage process. The stages in this process are data presentation, content presentation, information presentation.
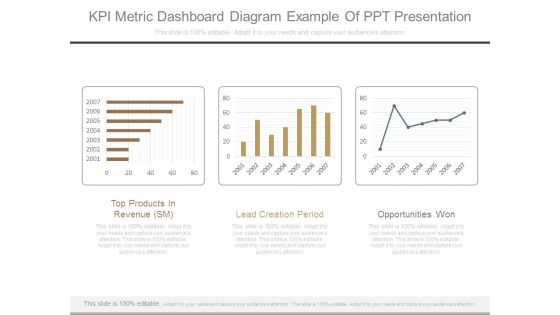
Kpi Metric Dashboard Diagram Example Of Ppt Presentation
This is a kpi metric dashboard diagram example of ppt presentation. This is a three stage process. The stages in this process are top products in revenue sm, lead creation period, opportunities won.
Sales Kpi Tracker Ppt PowerPoint Presentation Layout
This is a sales kpi tracker ppt powerpoint presentation layout. This is a six stage process. The stages in this process are leads created, sales ratio, opportunities won, top products in revenue, actual.
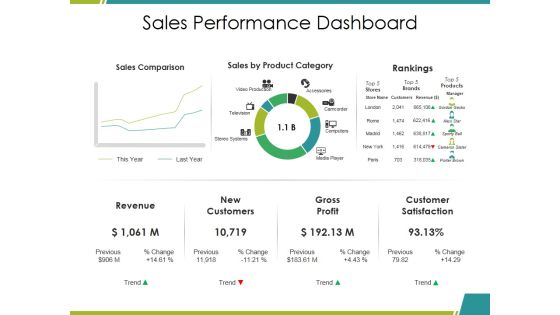
Sales Performance Dashboard Ppt PowerPoint Presentation Infographics Mockup
This is a sales performance dashboard ppt powerpoint presentation infographics mockup. This is a three stage process. The stages in this process are sales comparison, sales by product category, rankings, revenue, gross profit.

Bar Graph For Profit Growth Analysis Powerpoint Slides
This PowerPoint template has been designed with bar graph with percentage values. This diagram is useful to exhibit profit growth analysis. This diagram slide can be used to make impressive presentations.
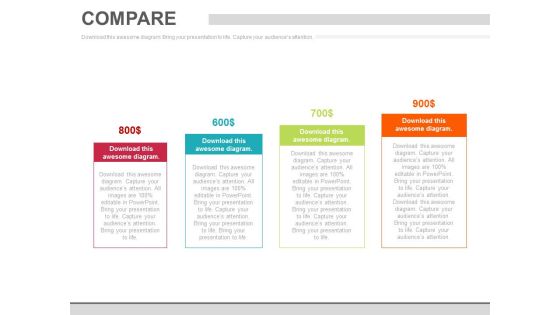
Four Steps Pricing Option Chart Powerpoint Slides
This PowerPoint template has been designed with dollar value pricing table chart. This PPT slide may be used for sample marketing proposal. Download this slide to build unique presentation.
Four Steps Pricing Table With Icons Powerpoint Slides
This PowerPoint template has been designed with dollar value pricing table chart. This PPT slide may be used for sample marketing proposal. Download this slide to build unique presentation.
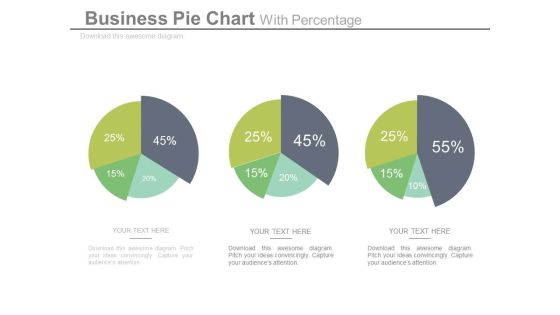
Pie Charts For Relative Comparison Study Powerpoint Slides
This power point template illustrates diagram of three pie charts with percentage values. This business slide can be used for relative comparison study. Present your views and ideas with this impressive slide.

Bar Graph With Increasing Percentage Flow Powerpoint Slides
This PowerPoint slide has been designed with bar graph and increasing percentage values. This diagram slide may be used to display profit growth. Prove the viability of your ideas with this professional slide.

Bar Graph Ppt PowerPoint Presentation Ideas Show
This is a bar graph ppt powerpoint presentation ideas show. This is a three stage process. The stages in this process are product, percentage, business, year, graph.
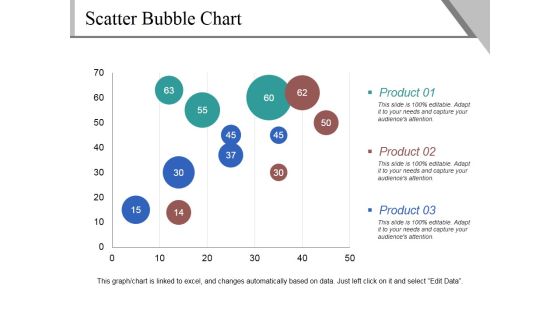
Scatter Bubble Chart Ppt PowerPoint Presentation Pictures Demonstration
This is a scatter bubble chart ppt powerpoint presentation pictures demonstration. This is a three stage process. The stages in this process are product, business, marketing, scatter chart.
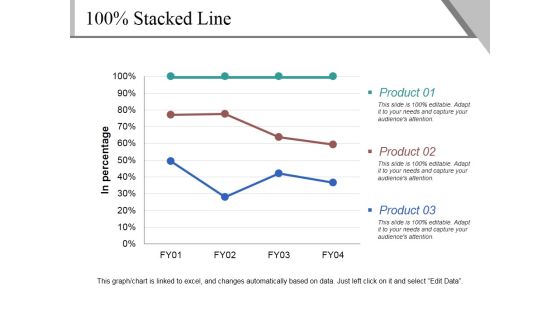
Stacked Line Ppt PowerPoint Presentation Professional Tips
This is a stacked line ppt powerpoint presentation professional tips. This is a three stage process. The stages in this process are product, in percentage, business, marketing.

Stacked Line Ppt PowerPoint Presentation Infographics Tips
This is a stacked line ppt powerpoint presentation infographics tips. This is a three stage process. The stages in this process are product, business, percentage, finance.

Bar Graph Ppt PowerPoint Presentation Infographics Clipart
This is a bar graph ppt powerpoint presentation infographics clipart. This is a three stage process. The stages in this process are product, graph, finance, business, marketing.
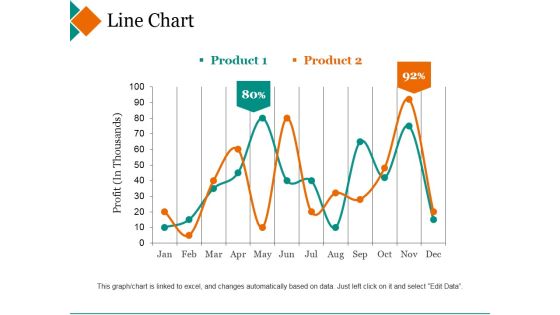
Line Chart Ppt PowerPoint Presentation Inspiration Deck
This is a line chart ppt powerpoint presentation inspiration deck. This is a two stage process. The stages in this process are product, profit, percentage, finance, line graph.
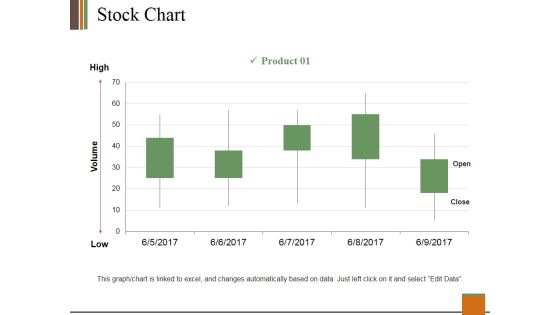
Stock Chart Ppt PowerPoint Presentation Slides Clipart
This is a stock chart ppt powerpoint presentation slides clipart. This is a one stage process. The stages in this process are product, high, volume, low, open, close.
Stock Chart Ppt PowerPoint Presentation Inspiration Icon
This is a stock chart ppt powerpoint presentation inspiration icon. This is a two stage process. The stages in this process are high, volume, low, product, close.

Area Chart Ppt PowerPoint Presentation Gallery Information
This is a area chart ppt powerpoint presentation gallery information. This is a two stage process. The stages in this process are product, area chart, business, finance, marketing.

Filled Rader Ppt PowerPoint Presentation Pictures Format
This is a filled rader ppt powerpoint presentation pictures format. This is a two stage process. The stages in this process are product, radar, finance, business, management.

Radar Chart Ppt PowerPoint Presentation Background Designs
This is a radar chart ppt powerpoint presentation background designs. This is a two stage process. The stages in this process are radar chart, product, finance, business, shapes.

Radar Chart Ppt PowerPoint Presentation Infographics Portfolio
This is a radar chart ppt powerpoint presentation infographics portfolio. This is a two stage process. The stages in this process are product, finance, shapes, business, marketing.

Radar Chart Ppt PowerPoint Presentation Gallery Templates
This is a radar chart ppt powerpoint presentation gallery templates. This is a two stage process. The stages in this process are radar chart, product, shape, business.
Stock Chart Ppt PowerPoint Presentation Icon Format
This is a stock chart ppt powerpoint presentation icon format. This is a two stage process. The stages in this process are product, close, high, volume, low.

Stock Chart Ppt PowerPoint Presentation Slides Graphics Pictures
This is a stock chart ppt powerpoint presentation slides graphics pictures. This is a two stage process. The stages in this process are product, high, volume, low, open.

Radar Chart Ppt PowerPoint Presentation Ideas Portrait
This is a radar chart ppt powerpoint presentation ideas portrait. This is a two stage process. The stages in this process are product, radar chart, finance, business, marketing.

Radar Chart Ppt PowerPoint Presentation Pictures Themes
This is a radar chart ppt powerpoint presentation pictures themes. This is a two stage process. The stages in this process are product, radar chart, finance, business.
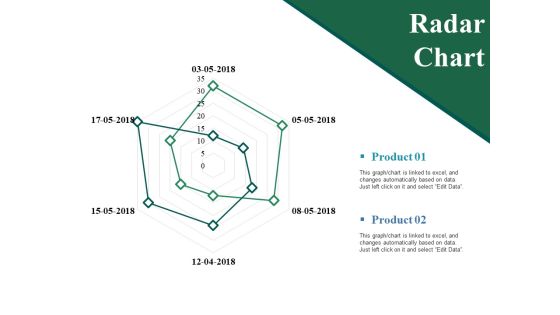
Radar Chart Ppt PowerPoint Presentation Show Guidelines
This is a radar chart ppt powerpoint presentation show guidelines. This is a two stage process. The stages in this process are product, radar chart, business, finance, marketing.

Stock Chart Ppt PowerPoint Presentation Ideas Infographics
This is a stock chart ppt powerpoint presentation ideas infographics. This is a two stage process. The stages in this process are high, volume, low, product, stock chart.

Area Chart Ppt PowerPoint Presentation Professional Grid
This is a area chart ppt powerpoint presentation professional grid. This is a two stage process. The stages in this process are product, sales in percentage, business.

Radar Chart Ppt PowerPoint Presentation Styles Themes
This is a radar chart ppt powerpoint presentation styles themes. This is a two stage process. The stages in this process are product, finance, shape, radar chart, business.

Bar Chart Ppt PowerPoint Presentation Portfolio Inspiration
This is a bar chart ppt powerpoint presentation portfolio inspiration. This is a two stage process. The stages in this process are product, in percentage, in years.
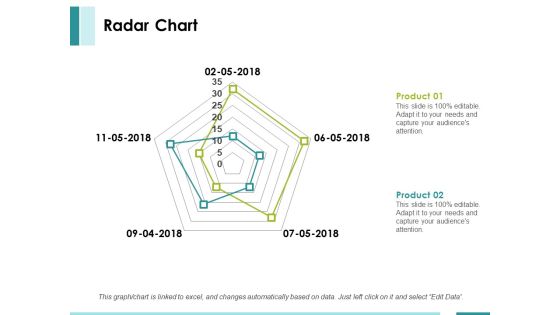
Radar Chart Ppt PowerPoint Presentation Summary Layout
This is a radar chart ppt powerpoint presentation summary layout. This is a two stage process. The stages in this process are product, finance, shape, radar chart, business.

Radar Chart Ppt PowerPoint Presentation File Rules
This is a radar chart ppt powerpoint presentation file rules. This is a two stage process. The stages in this process are product, radar chart, finance.

Stock Chart Ppt PowerPoint Presentation Guide
This is a stock chart ppt powerpoint presentation guide. This is a two stage process. The stages in this process are product, close, high, volume, low.
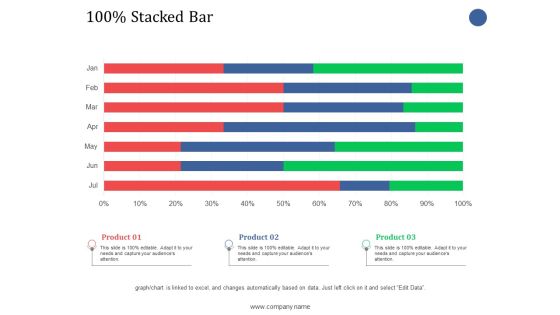
Stacked Bar Ppt PowerPoint Presentation Infographic Template Graphics
This is a stacked bar ppt powerpoint presentation infographic template graphics. This is a three stage process. The stages in this process are stacked bar, finance, product, business.

Stacked Bar Ppt PowerPoint Presentation Visual Aids Pictures
This is a stacked bar ppt powerpoint presentation visual aids pictures. This is a two stage process. The stages in this process are product, percentage, finance, business, marketing.
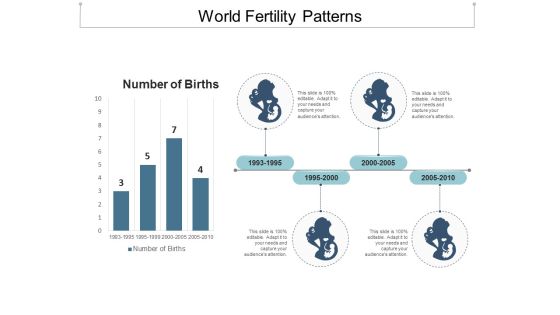
World Fertility Patterns Ppt Powerpoint Presentation Gallery Smartart
This is a world fertility patterns ppt powerpoint presentation gallery smartart. This is a four stage process. The stages in this process are fertility, productiveness, fecundity.

High Low Close Chart Template 1 Ppt PowerPoint Presentation Infographics Graphics Design
This is a high low close chart template 1 ppt powerpoint presentation infographics graphics design. This is a five stage process. The stages in this process are close, high, volume, low, open, product.
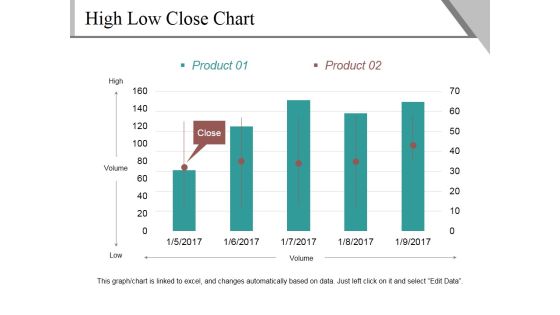
High Low Close Chart Template 2 Ppt PowerPoint Presentation Outline Show
This is a high low close chart template 2 ppt powerpoint presentation outline show. This is a five stage process. The stages in this process are high, volume, low, close, product.

Clustered Column Line Ppt PowerPoint Presentation Slide
This is a clustered column line ppt powerpoint presentation slide. This is a three stage process. The stages in this process are bar graph, growth, finance, product, sales in percentage.

 Home
Home