AI PPT Maker
Templates
PPT Bundles
Design Services
Business PPTs
Business Plan
Management
Strategy
Introduction PPT
Roadmap
Self Introduction
Timelines
Process
Marketing
Agenda
Technology
Medical
Startup Business Plan
Cyber Security
Dashboards
SWOT
Proposals
Education
Pitch Deck
Digital Marketing
KPIs
Project Management
Product Management
Artificial Intelligence
Target Market
Communication
Supply Chain
Google Slides
Research Services
 One Pagers
All Categories
-
Home
- Customer Favorites
- Financial Dashboard
Financial Dashboard

Crm Sales Rep Dashboard Ppt PowerPoint Presentation Clipart
This is a crm sales rep dashboard ppt powerpoint presentation clipart. This is a three stage process. The stages in this process are identity, qualification, develop, proposal, negotiation.

Monthly Social Media Dashboard Ppt PowerPoint Presentation Infographics Files
This is a monthly social media dashboard ppt powerpoint presentation infographics files. This is a four stage process. The stages in this process are marketing, business, financial, data analysis, management.

Business Management Workflow Automation Dashboard Pictures PDF
This slide presents the graphical representation of business management dashboard via workflow automation software. It includes annual revenue analysis, annual profit analysis, quotation, estimated income, monthly project revenue, upcoming event schedule, etc. Coming up with a presentation necessitates that the majority of the effort goes into the content and the message you intend to convey. The visuals of a PowerPoint presentation can only be effective if it supplements and supports the story that is being told. Keeping this in mind our experts created Business Management Workflow Automation Dashboard Pictures PDF to reduce the time that goes into designing the presentation. This way, you can concentrate on the message while our designers take care of providing you with the right template for the situation.

Client Support KPI Dashboard Rules PDF
This slide shows key performance indicators of customer service delivery. It includes service level, request volume, cost of revenue, customer satisfaction, customer retention, etc. Pitch your topic with ease and precision using this Client Support KPI Dashboard Rules PDF. This layout presents information on Customer Retention, Cost Per Support, Average Issue Solving Time. It is also available for immediate download and adjustment. So, changes can be made in the color, design, graphics or any other component to create a unique layout.
Product Sales Performance Tracking Dashboard Introduction PDF
This slide provides information regarding dashboard utilized by firm to monitor sales performance of products offered. The performance is tracked through revenues generated, online vs offline purchases, cost of goods sold, etc. Are you in need of a template that can accommodate all of your creative concepts This one is crafted professionally and can be altered to fit any style. Use it with Google Slides or PowerPoint. Include striking photographs, symbols, depictions, and other visuals. Fill, move around, or remove text boxes as desired. Test out color palettes and font mixtures. Edit and save your work, or work with colleagues. Download Product Sales Performance Tracking Dashboard Introduction PDF and observe how to make your presentation outstanding. Give an impeccable presentation to your group and make your presentation unforgettable.
Project Tracking Cost Tracker Dashboard Elements PDF
The following slide highlights the cost analysis of various projects to perform feasibility analysis. It includes budgeted versus actual cost, project wise cost and revenue allocation etc. Showcasing this set of slides titled Project Tracking Cost Tracker Dashboard Elements PDF. The topics addressed in these templates are Budgeted Costs, Resource Allocation, Project Costs. All the content presented in this PPT design is completely editable. Download it and make adjustments in color, background, font etc. as per your unique business setting.

Revenue Weekly Performance Report Dashboard Topics PDF
This slide displays the overall revenue that has been earned by an organization during a weekly performance report with the gross margin percent , total revenue , no. Of customers , etc. Showcasing this set of slides titled Revenue Weekly Performance Report Dashboard Topics PDF. The topics addressed in these templates are Gross Margin, Total Revenue, Customers. All the content presented in this PPT design is completely editable. Download it and make adjustments in color, background, font etc. as per your unique business setting.

Weekly Marketing Investment Report Dashboard Ideas PDF
This slide illustrates the overview of advertising expenditure weekly performance metrics. It incorporate total budget spent and estimated for advertising, estimated and actual registration, revenue, conversion metrics rates etc. Showcasing this set of slides titled Weekly Marketing Investment Report Dashboard Ideas PDF. The topics addressed in these templates are Conversion Metrics, Quality Of Traffic, Quality Of Transaction. All the content presented in this PPT design is completely editable. Download it and make adjustments in color, background, font etc. as per your unique business setting.

Client Health Score Analytical Dashboard Rules PDF
This slide gives an overview of customer health score in an organization along with net promoter score for users at various locations. It includes elements such as total customers, total monthly recurring revenue, average net promoter score etc. Showcasing this set of slides titled Client Health Score Analytical Dashboard Rules PDF. The topics addressed in these templates are Average Net Promoter, Average Customer Health, Healthy. All the content presented in this PPT design is completely editable. Download it and make adjustments in color, background, font etc. as per your unique business setting.
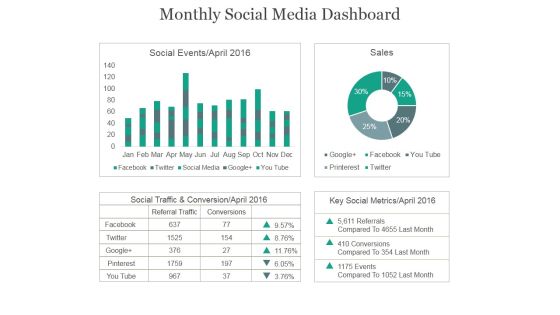
Monthly Social Media Dashboard Ppt PowerPoint Presentation Example 2015
This is a monthly social media dashboard ppt powerpoint presentation example 2015. This is a four stage process. The stages in this process are social events, sales, social traffic, conservation, key social metrics.
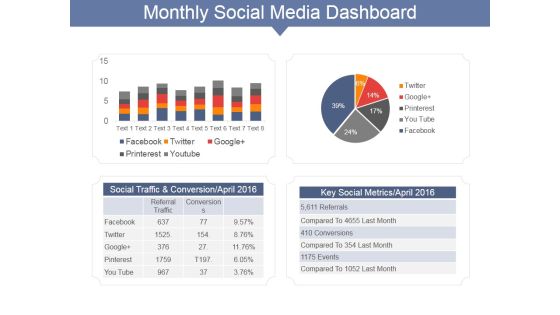
Monthly Social Media Dashboard Ppt PowerPoint Presentation Gallery Show
This is a monthly social media dashboard ppt powerpoint presentation gallery show. This is a two stage process. The stages in this process are social traffic and conversion april, key social metrics april, facebook, twitter.
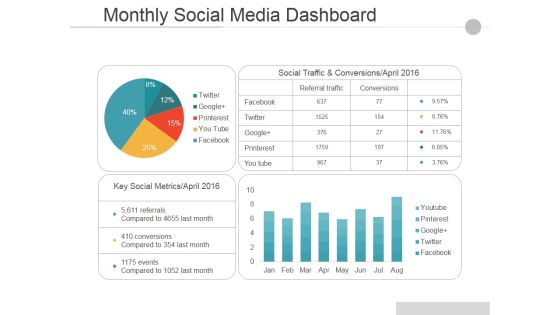
Monthly Social Media Dashboard Ppt PowerPoint Presentation Pictures Guide
This is a monthly social media dashboard ppt powerpoint presentation pictures guide. This is a two stage process. The stages in this process are social traffic and conversions april, key social metrics april, facebook, twitter, google.
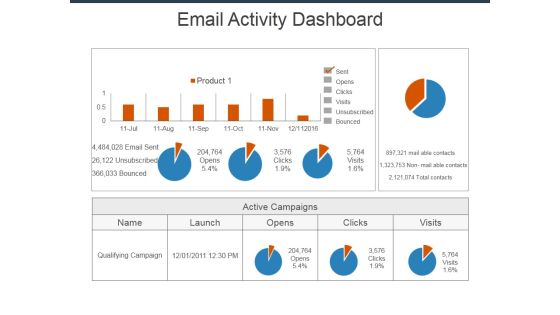
Email Activity Dashboard Ppt Powerpoint Presentation Styles Summary
This is a email activity dashboard ppt powerpoint presentation styles summary. This is a three stage process. The stages in this process are sent, opens, clicks, visits, unsubscribed, bounced, qualifying campaign.

Annual Trends Dashboard With Revenue And Gross Margin Designs PDF
The slide shows the dashboard of yearly financial trend. It includes revenue trends, cumulative revenue plan, contract type revenue and EBITA. Showcasing this set of slides titled Annual Trends Dashboard With Revenue And Gross Margin Designs PDF. The topics addressed in these templates are Cumulative Revenue, Time Materials, Recurring Service. All the content presented in this PPT design is completely editable. Download it and make adjustments in color, background, font etc. as per your unique business setting.

Crisis Management Program Presentation Financial Performance Tracking Slide Revenue Ideas PDF
This slide presents the dashboard which will help firm in tracking the fiscal performance. This dashboard displays revenues and expenses trends and payment received analysis. Deliver and pitch your topic in the best possible manner with this crisis management program presentation financial performance tracking slide revenue ideas pdf. Use them to share invaluable insights on revenue, expense trends, receivable analysis, financial performance tracking and impress your audience. This template can be altered and modified as per your expectations. So, grab it now.
Determining Crisis Management BCP Financial Performance Tracking Slide Ppt PowerPoint Presentation Layouts Guidelines PDF
This slide presents the dashboard which will help firm in tracking the fiscal performance. This dashboard displays revenues and expenses trends and payment received analysis. Deliver an awe inspiring pitch with this creative determining crisis management bcp financial performance tracking slide ppt powerpoint presentation layouts guidelines pdf. bundle. Topics like receivable analysis, revenue and expense trends, payment status, partially received, received. can be discussed with this completely editable template. It is available for immediate download depending on the needs and requirements of the user.

KPI Dashboard For Private Wealth Administration Firms Mockup PDF
The following slide illustrates dashboard to fulfil clients financial goals and win them over with sophisticated content. It presents information related to market value, holdings, port cost, etc. Showcasing this set of slides titled KPI Dashboard For Private Wealth Administration Firms Mockup PDF. The topics addressed in these templates are KPI Dashboard, Private Wealth Administration Firms. All the content presented in this PPT design is completely editable. Download it and make adjustments in color, background, font etc. as per your unique business setting.

Crm Dashboard Project Management Ppt PowerPoint Presentation Infographic Template
This is a crm dashboard project management ppt powerpoint presentation infographic template. This is a five stage process. The stages in this process are project types, project size.

Crm Dashboard Project Management Ppt PowerPoint Presentation Show
This is a crm dashboard project management ppt powerpoint presentation show. This is a two stage process. The stages in this process are total projects, projects on hold, overdue projects, available resources, schedule.

Crm Dashboard Opportunity By Rating Ppt PowerPoint Presentation Ideas Outfit
This is a crm dashboard opportunity by rating ppt powerpoint presentation ideas outfit. This is a three stage process. The stages in this process are open opportunity, count all opportunity, cold, hot, aram.

Dashboard Ppt PowerPoint Presentation Introduction Ppt PowerPoint Presentation Pictures
This is a dashboard ppt powerpoint presentation introduction ppt powerpoint presentation pictures. This is a three stage process. The stages in this process are business, strategy, marketing, success, dashboard.

Performance Dashboard Template 2 Ppt PowerPoint Presentation Show Backgrounds
This is a performance dashboard template 2 ppt powerpoint presentation show backgrounds. This is a four stage process. The stages in this process are performance dashboard, business, marketing, management, finance.

Crm Dashboard Current Lead Status Ppt PowerPoint Presentation Guide
This is a crm dashboard current lead status ppt powerpoint presentation guide. This is a six stage process. The stages in this process are business, marketing, success, presentation, financial.
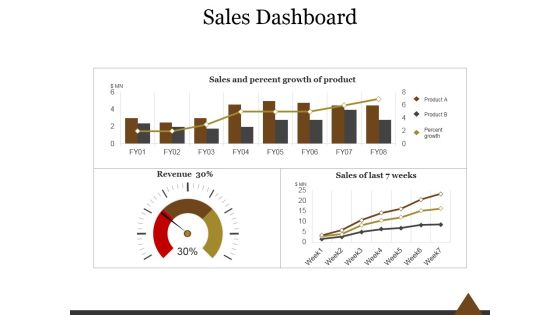
Sales Dashboard Template 1 Ppt PowerPoint Presentation Layouts
This is a sales dashboard template 1 ppt powerpoint presentation layouts. This is a three stage process. The stages in this process are sales and percent growth of product, sales of last weeks, percent growth.

Sales Dashboard Template 2 Ppt PowerPoint Presentation Introduction
This is a sales dashboard template 2 ppt powerpoint presentation introduction. This is a four stage process. The stages in this process are total sales by month, lead sources revenue share, win loss ratio, opportunities total sales by probability.

Crm Dashboard Leads By Source Ppt PowerPoint Presentation Example File
This is a crm dashboard leads by source ppt powerpoint presentation example file. This is a five stage process. The stages in this process are pie, division, finance, dashboard, percent.
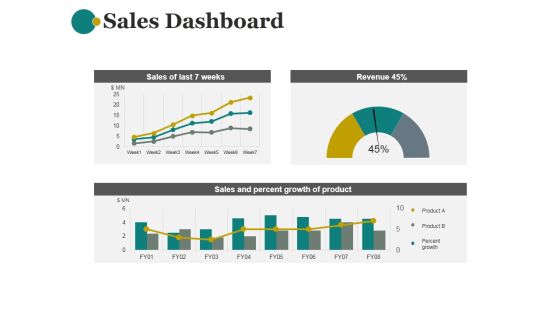
Sales Dashboard Template 1 Ppt PowerPoint Presentation Show
This is a sales dashboard template 1 ppt powerpoint presentation show. This is a three stage process. The stages in this process are sales of last 7 weeks, revenue, sales and percent growth of product.

Sales Dashboard Template 2 Ppt PowerPoint Presentation Examples
This is a sales dashboard template 2 ppt powerpoint presentation examples. This is a four stage process. The stages in this process are sales distribution, win loss ratio, lead sources revenue share, total sales by month.

Crm Dashboard Opportunity By Rating Ppt PowerPoint Presentation Backgrounds
This is a crm dashboard opportunity by rating ppt powerpoint presentation backgrounds. This is a three stage process. The stages in this process are open opportunity, count all opportunity, rating.

Crm Dashboard Top Customers Ppt PowerPoint Presentation Graphics
This is a crm dashboard top customers ppt powerpoint presentation graphics. This is a ten stage process. The stages in this process are top customers, business, marketing, process, management.
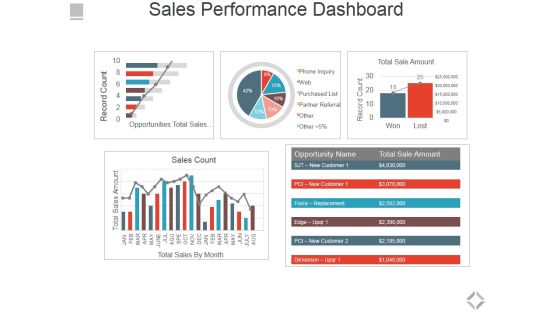
Sales Performance Dashboard Ppt PowerPoint Presentation File Graphics Pictures
This is a sales performance dashboard ppt powerpoint presentation file graphics pictures. This is a five stage process. The stages in this process are total sales by month, sales count, opportunities total sales by probability, total sale amount.

Monthly Social Media Dashboard Ppt PowerPoint Presentation Gallery Templates
This is a monthly social media dashboard ppt powerpoint presentation gallery templates. This is a four stage process. The stages in this process are facebook, twitter, google, pinterest, you tube.

Company Sales And Performance Dashboard Ppt PowerPoint Presentation Slides Grid
This is a company sales and performance dashboard ppt powerpoint presentation slides grid. This is a four stage process. The stages in this process are business, strategy, marketing, finance, analysis.

Crm Dashboard Template Ppt PowerPoint Presentation Gallery Shapes
This is a crm dashboard template ppt powerpoint presentation gallery shapes. This is a four stage process. The stages in this process are open tickets, closed tickets, new orders, new clients.

Financial Services Enterprise Transformation Loans And Deposits In Banking Company Ideas PDF
This slide identifies the total loans and deposits volumes of the ABC Bank Worldwide. This slide also shows the total loans and deposits on the basis of regions, districts, and monthly wise.Deliver and pitch your topic in the best possible manner with this Financial Services Enterprise Transformation Loans And Deposits In Banking Company Ideas PDF Use them to share invaluable insights on Dashboard Total Loans And Deposits In Banking Company and impress your audience. This template can be altered and modified as per your expectations. So, grab it now.

Sample Financial Analysis Report Manufacturing Ppt PowerPoint Presentation Complete Deck With Slides
This is a sample financial analysis report manufacturing ppt powerpoint presentation complete deck with slides. This is a one stage process. The stages in this process are sample, financial, analysis, report, manufacturing.

Business Intelligence Dashboard To Track Company Sales Rules PDF
This slide displays BI dashboard to monitor financial health and profitability of the company. It includes metrics such as margin, number of stores, average lead time, store locations, etc. Showcasing this set of slides titled Business Intelligence Dashboard To Track Company Sales Rules PDF. The topics addressed in these templates are Business Intelligence Dashboard, Track Company Sales. All the content presented in this PPT design is completely editable. Download it and make adjustments in color, background, font etc. as per your unique business setting.

Financial Highlights And Overview Of Organization Developing Fundraising Techniques Inspiration PDF
This slide showcases dashboard that can help organization to calculate the internal rate rate of return on invested capital. Company can use it to communicate the return on investment to investors. Do you have to make sure that everyone on your team knows about any specific topic I yes, then you should give Financial Highlights And Overview Of Organization Developing Fundraising Techniques Inspiration PDF a try. Our experts have put a lot of knowledge and effort into creating this impeccable Financial Highlights And Overview Of Organization Developing Fundraising Techniques Inspiration PDF. You can use this template for your upcoming presentations, as the slides are perfect to represent even the tiniest detail. You can download these templates from the Slidegeeks website and these are easy to edit. So grab these today.

Crm Dashboard Sales Dashboard Template Ppt PowerPoint Presentation Portfolio Master Slide
This is a crm dashboard sales dashboard template ppt powerpoint presentation portfolio master slide. This is a four stage process. The stages in this process are sales by product march, total lead ownership, month over month closing trend, lead owner breakdown.

Crm Dashboard Project Management Ppt PowerPoint Presentation Layouts Ideas
This is a crm dashboard project management ppt powerpoint presentation layouts ideas. This is a two stage process. The stages in this process are total projects, projects on hold, overdue projects, available resources, schedule.

Financial Data Analysis Driven Compare Market Share Of Brand PowerPoint Templates
Doll Up Your Thoughts With Our financial data analysis driven compare market share of brand Powerpoint Templates . They Will Make A Pretty Picture.

Data Collection Form Requirements With Financial Details Ppt PowerPoint Presentation Pictures
This is a data collection form requirements with financial details ppt powerpoint presentation pictures. This is a stage seven process. The stages in this process are form, financial form, data collection, financial details, data analysis.
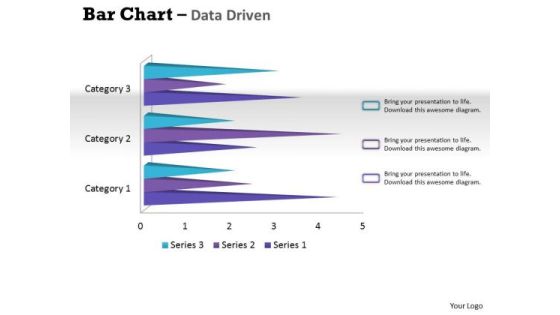
Data Analysis Techniques 3d Bar Chart For Financial Solutions PowerPoint Templates
Make Your Dreams A Reality With Our data analysis techniques 3d bar chart for financial solutions Powerpoint Templates . Your Ideas Will Begin To Take Shape.
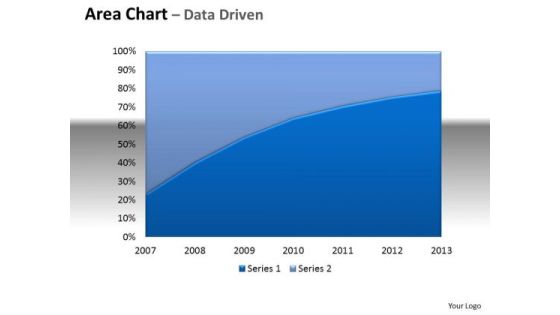
Financial Data Analysis Area Chart With Plotted Line Center PowerPoint Templates
Be The Doer With Our financial data analysis area chart with plotted line center Powerpoint Templates . Put Your Thoughts Into Practice.
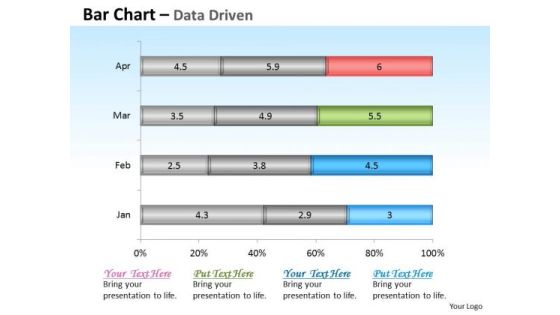
Financial Data Analysis Driven Base Bar Chart Design PowerPoint Slides Templates
Get The Domestics Right With Our financial data analysis driven base bar chart design powerpoint slides Templates . Create The Base For Thoughts To Grow.
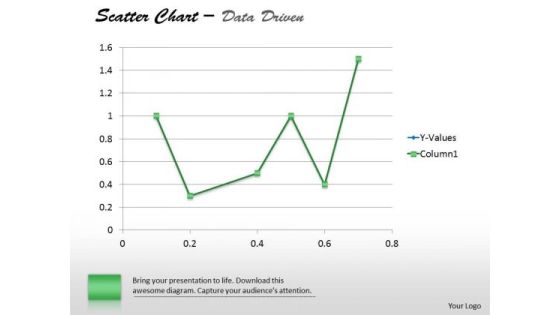
Financial Data Analysis Driven Demonstrate Statistics With Scatter Chart PowerPoint Slides Templates
Establish The Dominance Of Your Ideas. Our financial data analysis driven demonstrate statistics with scatter chart powerpoint slides Templates Will Put Them On Top.
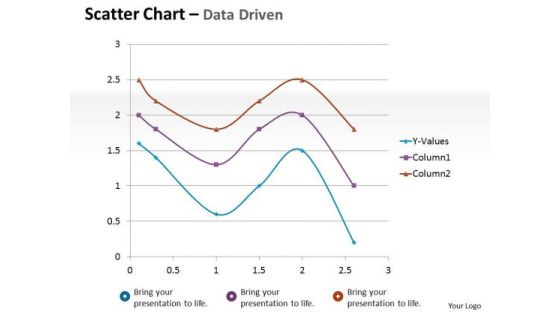
Financial Data Analysis Driven Scatter Chart Mathematical Diagram PowerPoint Slides Templates
Dominate Proceedings With Your Ideas. Our financial data analysis driven scatter chart mathematical diagram powerpoint slides Templates Will Empower Your Thoughts.
Key Financial Ratios Template 2 Ppt PowerPoint Presentation Icon Slide Download
This is a key financial ratios template 2 ppt powerpoint presentation icon slide download. This is a six stage process. The stages in this process are price to earnings, debt to equity ratio, current ratio, return on, equity, return on , assets, return on investment.

Reverse SCM Reverse Logistics Dashboard Past Ppt Slides Layouts PDF
Deliver an awe-inspiring pitch with this creative reverse scm reverse logistics dashboard past ppt slides layouts pdf bundle. Topics like financial performance, inventory, customer can be discussed with this completely editable template. It is available for immediate download depending on the needs and requirements of the user.

Crm Marketing Dashboard Ppt PowerPoint Presentation Icon Graphic Tips
This is a crm marketing dashboard ppt powerpoint presentation icon graphic tips. This is a two stage process. The stages in this process are leads per week, leads this week.

Corporate Earnings And Risk Metrics Dashboard Guidelines PDF
This slide illustrates graphical representation of risk key performance indicators. It includes financial risks, operational risk and risk expenditure etc. Pitch your topic with ease and precision using this Corporate Earnings And Risk Metrics Dashboard Guidelines PDF. This layout presents information on Financial Risk, Operational Risk Expenditure. It is also available for immediate download and adjustment. So, changes can be made in the color, design, graphics or any other component to create a unique layout.

Money Vector Set Specific Financial Goals Ppt PowerPoint Presentation Show Example
Presenting this set of slides with name money vector set specific financial goals ppt powerpoint presentation show example. This is a one stage process. The stages in this process are financial strategy, business financial trend, business strategy. This is a completely editable PowerPoint presentation and is available for immediate download. Download now and impress your audience.

Financial Strategy With Finance Laptop Image Ppt PowerPoint Presentation File Show
Presenting this set of slides with name financial strategy with finance laptop image ppt powerpoint presentation file show. This is a one stage process. The stages in this process are financial strategy, business financial trend, business strategy. This is a completely editable PowerPoint presentation and is available for immediate download. Download now and impress your audience.

Ecommerce KPI Dashboard With Pand L Statement Download PDF
This slide showcases ecommerce key performance indicators KPI dashboard with financial statement. It provides information about total sales, orders, net profit, net profit margin, average order value, channels, etc. This Ecommerce KPI Dashboard With Pand L Statement Download PDF from Slidegeeks makes it easy to present information on your topic with precision. It provides customization options, so you can make changes to the colors, design, graphics, or any other component to create a unique layout. It is also available for immediate download, so you can begin using it right away. Slidegeeks has done good research to ensure that you have everything you need to make your presentation stand out. Make a name out there for a brilliant performance.

Business Report With Financial Data Vector Icon Ppt PowerPoint Presentation File Outline PDF
Presenting business report with financial data vector icon ppt powerpoint presentation file outline pdf to dispense important information. This template comprises three stages. It also presents valuable insights into the topics including business report with financial data vector icon. This is a completely customizable PowerPoint theme that can be put to use immediately. So, download it and address the topic impactfully.

Business Economic Report For Financial Analysis Icon Ppt PowerPoint Presentation Gallery Slide Portrait PDF
Presenting business economic report for financial analysis icon ppt powerpoint presentation gallery slide portrait pdf to dispense important information. This template comprises three stages. It also presents valuable insights into the topics including business economic report for financial analysis icon. This is a completely customizable PowerPoint theme that can be put to use immediately. So, download it and address the topic impactfully.

Stock Market Research Report Financial Ppt PowerPoint Presentation Professional Sample PDF
Presenting stock market research report financial ppt powerpoint presentation professional sample pdf to provide visual cues and insights. Share and navigate important information on four stages that need your due attention. This template can be used to pitch topics like financial. In addition, this PPT design contains high-resolution images, graphics, etc, that are easily editable and available for immediate download.

Business Report With Financial Graphs Vector Icon Ppt PowerPoint Presentation File Graphics Example PDF
Presenting this set of slides with name business report with financial graphs vector icon ppt powerpoint presentation file graphics example pdf. This is a three stage process. The stages in this process are business report with financial graphs vector icon. This is a completely editable PowerPoint presentation and is available for immediate download. Download now and impress your audience.
Financial Analysis Report Vector Icon Ppt PowerPoint Presentation Slides Designs Download PDF
Presenting this set of slides with name financial analysis report vector icon ppt powerpoint presentation slides designs download pdf. This is a three stage process. The stages in this process are financial analysis report vector icon. This is a completely editable PowerPoint presentation and is available for immediate download. Download now and impress your audience.

Financial Management Virtual Report Presenation Ppt PowerPoint Presentation Infographics Template PDF
Presenting this set of slides with name financial management virtual report presenation ppt powerpoint presentation infographics template pdf. This is a two stage process. The stages in this process are financial management virtual report presenation. This is a completely editable PowerPoint presentation and is available for immediate download. Download now and impress your audience.
