AI PPT Maker
Templates
PPT Bundles
Design Services
Business PPTs
Business Plan
Management
Strategy
Introduction PPT
Roadmap
Self Introduction
Timelines
Process
Marketing
Agenda
Technology
Medical
Startup Business Plan
Cyber Security
Dashboards
SWOT
Proposals
Education
Pitch Deck
Digital Marketing
KPIs
Project Management
Product Management
Artificial Intelligence
Target Market
Communication
Supply Chain
Google Slides
Research Services
 One Pagers
All Categories
-
Home
- Customer Favorites
- Financial Dashboard
Financial Dashboard
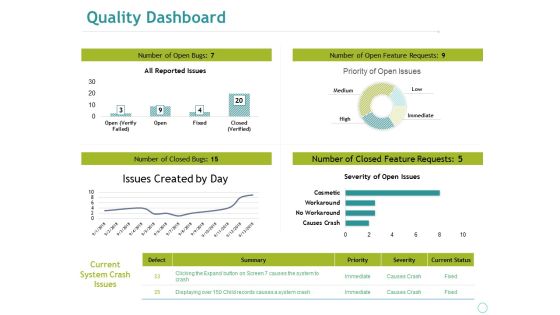
Quality Dashboard Ppt PowerPoint Presentation File Guide
This is a quality dashboard ppt powerpoint presentation file guide. This is a four stage process. The stages in this process are business, marketing, all reported issues, issues created by day, severity of open issues.

Project Kpi Sample Dashboard Diagram Powerpoint Images
This is a project kpi sample dashboard diagram powerpoint images. This is a four stage process. The stages in this process are costs thousands, employee names, burndown, project status.

Business Intelligence Dashboard Design Ppt Powerpoint Topics
This is a business intelligence dashboard design ppt powerpoint topics. This is a four stage process. The stages in this process are sales analysis, sales forecasting, global distribution, sales by region, latin america, north america, eastern europe, western europe.

Dashboard For Six Sigma Ppt Powerpoint Templates
This is a dashboard for six sigma ppt powerpoint templates. This is a four stage process. The stages in this process are program savings, project count, project cycle time, six sigma training.
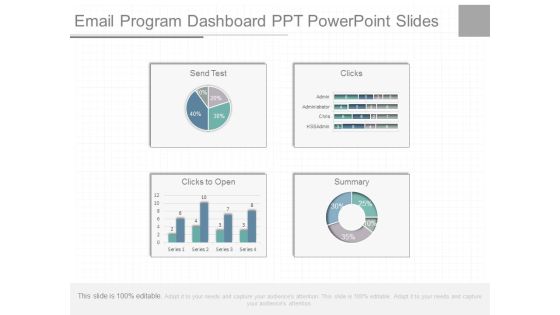
Email Program Dashboard Ppt Powerpoint Slides
This is a email program dashboard ppt powerpoint slides. This is a four stage process. The stages in this process are send test, clicks, clicks to open, summary, admin, administrator, chris, hssadmin.
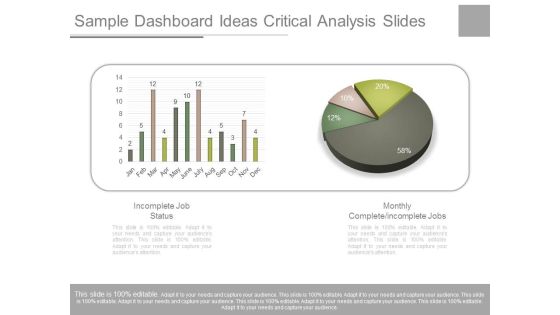
Sample Dashboard Ideas Critical Analysis Slides
This is a sample dashboard ideas critical analysis slides. This is a two stage process. The stages in this process are incomplete job status, monthly complete incomplete jobs, jan feb, mar, apr, may, june, july, aug, sep, oct, nov, dec.

Web Based Dashboard Ppt Powerpoint Slides Design
This is a web based dashboard ppt powerpoint slides design. This is a four stage process. The stages in this process are feedback, traffic sources, today visitor by countries, traffic from social network.

Hr Dashboard Template Ppt PowerPoint Presentation Deck
This is a hr dashboard template ppt powerpoint presentation deck. This is a four stage process. The stages in this process are turnover rate, headcount flow, headcount, staffing trends.

Balance Scorecard Index Dashboard Ppt Slides
This is a balance scorecard index dashboard ppt slides. This is a one stage process. The stages in this process are sales by month, gross revenue, customer retention, executive scorecard, measures, status, trend, financial, option, customer, internal processes, learning and growth.
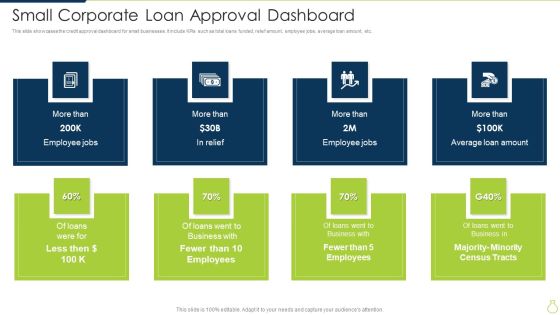
Small Corporate Loan Approval Dashboard Diagrams PDF
This slide showcases the credit approval dashboard for small businesses. It include KPIs such as total loans funded, relief amount, employee jobs, average loan amount, etc. Persuade your audience using this Small Corporate Loan Approval Dashboard Diagrams PDF. This PPT design covers eight stages, thus making it a great tool to use. It also caters to a variety of topics including Business, Loans, Census Tracts. Download this PPT design now to present a convincing pitch that not only emphasizes the topic but also showcases your presentation skills.

Data Dashboard Diagram Presentation Powerpoint Example
This is a data dashboard diagram presentation powerpoint example. This is a seven stage process. The stages in this process are root cause, incident trends and their status, contributing cause, incident by category and severity, incident by category, incident by facilities, incident severity by.
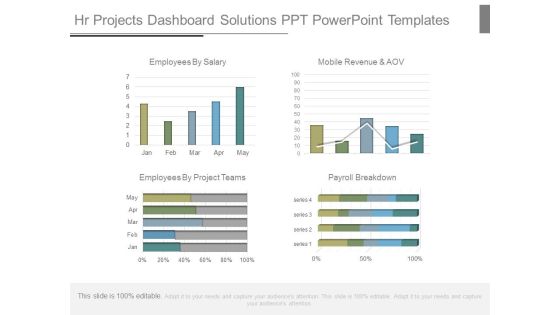
Hr Projects Dashboard Solutions Ppt Powerpoint Templates
This is a hr projects dashboard solutions ppt powerpoint templates. This is a four stage process. The stages in this process are employees by salary, mobile revenue and aov, employees by project teams, payroll breakdown, jan, feb, mar, apr, may, series.

Dashboard Design Sample Ppt Powerpoint Slide Ideas
This is a dashboard design sample ppt powerpoint slide ideas. This is a four stage process. The stages in this process are your current setup, message board, quick stats, progress towards goals, total posts, comments, social reactions, new users, hourly visits, bounce rate.

Dashboard Data Visualization Ppt Powerpoint Slides Design
This is a dashboard data visualization ppt powerpoint slides design. This is a four stage process. The stages in this process are business, presentation, success, marketing, finance.

Business Intelligence Dashboard Ppt Examples Slides
This is a business intelligence dashboard ppt examples slides. This is a four stage process. The stages in this process are metrics, scorecard, key performance indicator, numbers.

Cost Reporting Dashboard Example Powerpoint Slides
This is a cost reporting dashboard example powerpoint slides. This is a five stage process. The stages in this process are cost, quality, project, process planning, analysis.
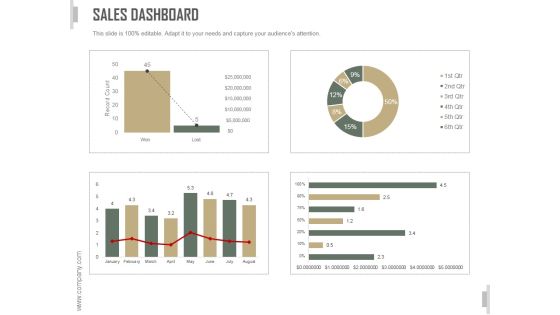
Sales Dashboard Slide Ppt PowerPoint Presentation Template
This is a sales dashboard slide ppt powerpoint presentation template. This is a three stage process. The stages in this process are business, strategy, marketing, analysis, bar graph, growth strategy.
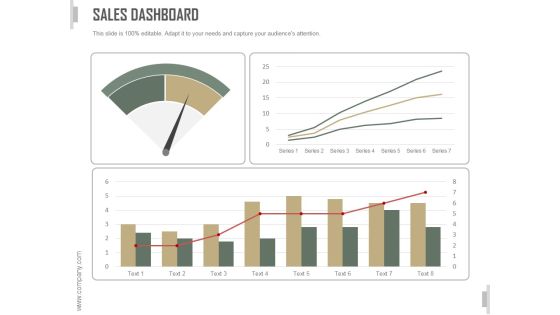
Sales Dashboard Ppt PowerPoint Presentation Design Templates
This is a sales dashboard ppt powerpoint presentation design templates. This is a four stage process. The stages in this process are business, strategy, marketing, analysis, bar graph, growth strategy.
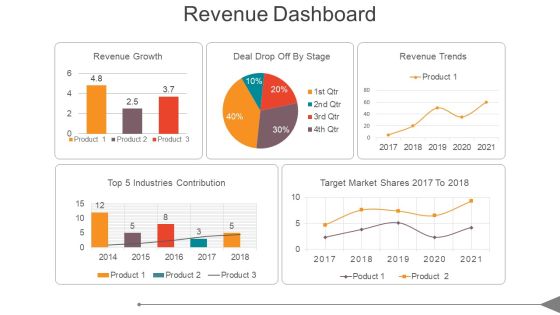
Revenue Dashboard Ppt PowerPoint Presentation Show
This is a revenue dashboard ppt powerpoint presentation show. This is a five stage process. The stages in this process are top 5 industries contribution, revenue growth, deal drop off by stage, revenue trends, target market shares 2017 to 2018.
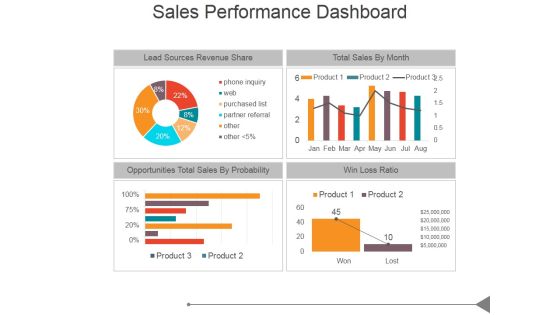
Sales Performance Dashboard Ppt PowerPoint Presentation Good
This is a sales performance dashboard ppt powerpoint presentation good. This is a four stage process. The stages in this process are lead sources revenue share, total sales by month, opportunities total sales by probability, win loss ratio.

Creating A Recruitment Dashboard Powerpoint Sample
This is a creating a recruitment dashboard powerpoint sample. This is a two stage process. The stages in this process are critical success factors, sourcing channels, recruiter efficiency, acceptance rate, key performance indicators, candidate, manager satisfaction, quality of hire, efficiency ratio.

Call Center Metrics Dashboard With Average Response Time Inspiration PDF
Mentioned slide outlines KPI dashboard which can be used by call center to measure the performance of their agents. The key metrics highlighted in the dashboard are first call resolution, daily abandonment rate, total number of calls by topic, top performing call agents etc. Showcasing this set of slides titled Call Center Metrics Dashboard With Average Response Time Inspiration PDF. The topics addressed in these templates are Efficiency, Quality, Activity, Daily Average Response, Daily Average Transfer. All the content presented in this PPT design is completely editable. Download it and make adjustments in color, background, font etc. as per your unique business setting.

Metrics Dashboard To Measure Call Center Success Themes PDF
Mentioned slide outlines a comprehensive KPI dashboard used to measure the call center performance. The dashboard monitors the status of key metrics such as call abandonment levels, current service level, average call length, total calls attended, calls waiting etc. Showcasing this set of slides titled Metrics Dashboard To Measure Call Center Success Themes PDF. The topics addressed in these templates are Center Success, Call Center Status, Call Monitor. All the content presented in this PPT design is completely editable. Download it and make adjustments in color, background, font etc. as per your unique business setting.

Energy Efficiency Dashboard To Track Campaign Effectiveness Pictures PDF
This slide consists of a dashboard which presents an energy saving dashboard which can be used to track effectiveness of energy saving program. The key performance indicators relate to energy sources, energy consumption by sectors, energy consumption by sectors etc. Pitch your topic with ease and precision using this Energy Efficiency Dashboard To Track Campaign Effectiveness Pictures PDF. This layout presents information on Energy Sources, Energy Usage, Trend Analysis. It is also available for immediate download and adjustment. So, changes can be made in the color, design, graphics or any other component to create a unique layout.

Employee Demographics Data And Designation Analysis Dashboard Introduction PDF
The purpose of this template is to explain the analysis of employee demographics and designation dashboard. The slide provides information about gender, ethnicity, location and structure. Pitch your topic with ease and precision using this Employee Demographics Data And Designation Analysis Dashboard Introduction PDF. This layout presents information on Job Functions, Top Locations, Employee Structure It is also available for immediate download and adjustment. So, changes can be made in the color, design, graphics or any other component to create a unique layout.

Social Media Demographic Data Analysis Dashboard Infographics PDF
This slide defines the dashboard analyzing the social media demographics. It includes information related to the trends, followers and impressions. Pitch your topic with ease and precision using this Social Media Demographic Data Analysis Dashboard Infographics PDF. This layout presents information on Audience Demographics, Group Trends, Impressions Demographics It is also available for immediate download and adjustment. So, changes can be made in the color, design, graphics or any other component to create a unique layout.
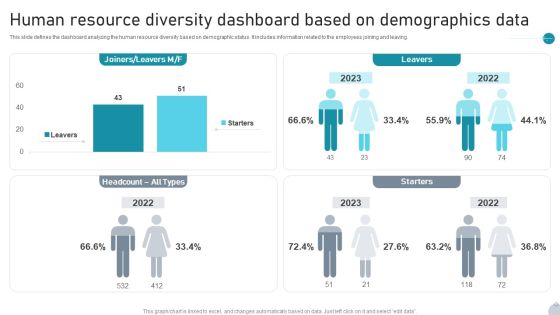
Human Resource Diversity Dashboard Based On Demographics Data Rules PDF
This slide defines the dashboard analyzing the human resource diversity based on demographic status. It includes information related to the employees joining and leaving. Pitch your topic with ease and precision using this Human Resource Diversity Dashboard Based On Demographics Data Rules PDF. This layout presents information on Starters, Leavers, Demographics Data It is also available for immediate download and adjustment. So, changes can be made in the color, design, graphics or any other component to create a unique layout.

Employee Demographics Data And Gender Distribution Dashboard Topics PDF
The purpose of this template is to explain the employee demographics and gender distribution dashboard. The slide provides information about distribution, hire and turnover based gender. Showcasing this set of slides titled Employee Demographics Data And Gender Distribution Dashboard Topics PDF. The topics addressed in these templates are Gender Distribution, Turnover By Gender, Hires By Gender All the content presented in this PPT design is completely editable. Download it and make adjustments in color, background, font etc. as per your unique business setting.
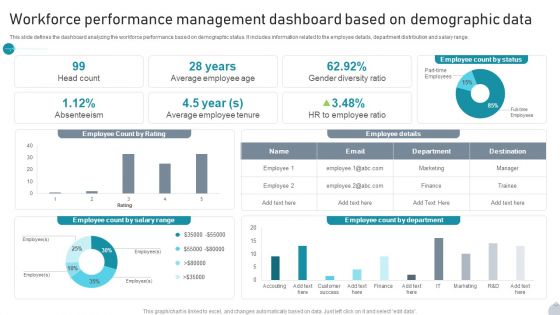
Workforce Performance Management Dashboard Based On Demographic Data Information PDF
This slide defines the dashboard analyzing the workforce performance based on demographic status. It includes information related to the employee details, department distribution and salary range. Showcasing this set of slides titled Workforce Performance Management Dashboard Based On Demographic Data Information PDF. The topics addressed in these templates are Employee Details, Department, Gender Diversity Ratio All the content presented in this PPT design is completely editable. Download it and make adjustments in color, background, font etc. as per your unique business setting.
Software Implementation Project Progress Tracking Dashboard Summary PDF
This slide represents the dashboard to track the progress of software implementation project. It includes details related to health, tasks, project, time, cost and workload of software implementation project. If you are looking for a format to display your unique thoughts, then the professionally designed Software Implementation Project Progress Tracking Dashboard Summary PDF is the one for you. You can use it as a Google Slides template or a PowerPoint template. Incorporate impressive visuals, symbols, images, and other charts. Modify or reorganize the text boxes as you desire. Experiment with shade schemes and font pairings. Alter, share or cooperate with other people on your work. Download Software Implementation Project Progress Tracking Dashboard Summary PDFSoftware Implementation Project Progress Tracking Dashboard Summary PDF and find out how to give a successful presentation. Present a perfect display to your team and make your presentation unforgettable.

Innovative Product Concept Development And Management Dashboard Introduction PDF
This slide represents dashboard for innovative product management. It includes ideas raised, project funding, challenges against ideas etc. Pitch your topic with ease and precision using this Innovative Product Concept Development And Management Dashboard Introduction PDF This layout presents information on Scoring Ideas, Budget Allocated, Challenges. It is also available for immediate download and adjustment. So, changes can be made in the color, design, graphics or any other component to create a unique layout.

Dashboard For Innovative Product Concept Performance In Market Formats PDF
This slide represents dashboard for innovative product performance in market. It includes usage intention, willingness to pay, purchase intention etc. Pitch your topic with ease and precision using this Dashboard For Innovative Product Concept Performance In Market Formats PDF This layout presents information on Usage Intention, Willingess To Pay, Purchase Intention . It is also available for immediate download and adjustment. So, changes can be made in the color, design, graphics or any other component to create a unique layout.

Bar Chart With Magnifying Glass For Financial Analysis Ppt Powerpoint Presentation Infographics Designs Download
This is a bar chart with magnifying glass for financial analysis ppt powerpoint presentation infographics designs download. This is a three stage process. The stages in this process are business metrics, business kpi, business dashboard.

Financial Charts And Graphs For Statistical Analysis Ppt Powerpoint Presentation Show Layout
This is a financial charts and graphs for statistical analysis ppt powerpoint presentation show layout. This is a four stage process. The stages in this process are business metrics, business kpi, business dashboard.
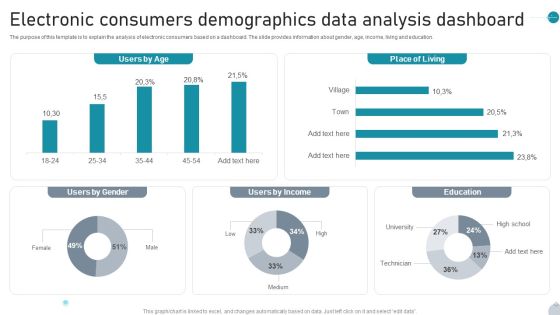
Electronic Consumers Demographics Data Analysis Dashboard Topics PDF
The purpose of this template is to explain the analysis of electronic consumers based on a dashboard. The slide provides information about gender, age, income, living and education. Showcasing this set of slides titled Electronic Consumers Demographics Data Analysis Dashboard Topics PDF. The topics addressed in these templates are Users By Age, Place Of Living, Users By Income All the content presented in this PPT design is completely editable. Download it and make adjustments in color, background, font etc. as per your unique business setting.

Software Implementation Strategy Sales Software Performance Measurement Dashboard Template PDF
This slide represents the dashboard to track and measure the performance of sales dashboard. It includes details related to KPIs such as sales activity, product details, purchase order etc. Coming up with a presentation necessitates that the majority of the effort goes into the content and the message you intend to convey. The visuals of a PowerPoint presentation can only be effective if it supplements and supports the story that is being told. Keeping this in mind our experts created Software Implementation Strategy Sales Software Performance Measurement Dashboard Template PDF to reduce the time that goes into designing the presentation. This way, you can concentrate on the message while our designers take care of providing you with the right template for the situation.

Call Center Metrics Dashboard With Key Metrics Information PDF
Mentioned slide outlines various call center KPIs dashboard. Call resolution in the current and previous month, agents schedule adherence today, currently active and waiting calls are some of the key metrics mentioned in the slide. Showcasing this set of slides titled Call Center Metrics Dashboard With Key Metrics Information PDF. The topics addressed in these templates are Currently Active, Call Resolution, Key Metrics. All the content presented in this PPT design is completely editable. Download it and make adjustments in color, background, font etc. as per your unique business setting.

Metrics Dashboard Depicting Call Center Performance Pictures PDF
Mentioned slide outlines key performance indicator KPI dashboard which can be used by call center to optimize the agents performance. The major metrics covered in the template are total calls, average speed of answer, abandon rate, service level agreement SLA limit etc. Pitch your topic with ease and precision using this Metrics Dashboard Depicting Call Center Performance Pictures PDF. This layout presents information on Overall Satisfaction Score, Satisfaction Score, Performance. It is also available for immediate download and adjustment. So, changes can be made in the color, design, graphics or any other component to create a unique layout.
Integrated Digital Marketing Strategy Dashboard For Lead Conversion Icons PDF
Following slide illustrates integrated marketing campaign dashboard utilized by organizations to improve business agility and increase operational efficiency. This slide provides data regarding lead conversion by campaign and channel, amount spent per campaign, monthly lead generations, etc. Showcasing this set of slides titled Integrated Digital Marketing Strategy Dashboard For Lead Conversion Icons PDF. The topics addressed in these templates are Total Page Views, Average Session Duration, Conversion. All the content presented in this PPT design is completely editable. Download it and make adjustments in color, background, font etc. as per your unique business setting.

Dashboard To Track Energy Efficiency After Campaign Implementation Pictures PDF
This slide consists of a Dashboard which can be used to track energy saving which will be used by managers to track effectiveness of program implementation. The key performance indicators include electric vs gas allocation, equipment activity, changes in costs, budget load etc. Showcasing this set of slides titled Dashboard To Track Energy Efficiency After Campaign Implementation Pictures PDF. The topics addressed in these templates are Equipment Activity, Budget Load, Cost Projection. All the content presented in this PPT design is completely editable. Download it and make adjustments in color, background, font etc. as per your unique business setting.

Call Center Metrics Dashboard With Cost Per Contact Rules PDF
Mentioned slide outlines KPI dashboard which allows the business to monitor the efficiency of call center. The metrics covered in the slide are first call resolution, average speed of answer, customer satisfaction, cost per contact etc. Pitch your topic with ease and precision using this Call Center Metrics Dashboard With Cost Per Contact Rules PDF. This layout presents information on Cost Per Contract, Key Metrics, Customer Satisfaction. It is also available for immediate download and adjustment. So, changes can be made in the color, design, graphics or any other component to create a unique layout.

Call Center Metrics Dashboard With First Response Time Background PDF
Mentioned slide outlines a KPI dashboard which can be used by call centers for the ticket system. Tickets created, unassigned, open, solved, escalated, tickets solved by agents, first response and full resolution time are the key metrics highlighted in the slide. Pitch your topic with ease and precision using this Call Center Metrics Dashboard With First Response Time Background PDF. This layout presents information on First Response Time, First Resolution Time, Response Time. It is also available for immediate download and adjustment. So, changes can be made in the color, design, graphics or any other component to create a unique layout.

Call Center Metrics Dashboard Highlighting Service Level Infographics PDF
Mentioned slide outlines comprehensive call center KPI dashboard. Information covered in this slide is related to various metrics such as queue calls, support and billing service level, inbound volume, outbound volume etc. Pitch your topic with ease and precision using this Call Center Metrics Dashboard Highlighting Service Level Infographics PDF. This layout presents information on All Agents, Queue Calls, Billing Service Level. It is also available for immediate download and adjustment. So, changes can be made in the color, design, graphics or any other component to create a unique layout.

Facebook Strategies Dashboard To Track Progress Structure PDF
This slides showcases dashboard to monitor the progress of Facebook page. It includes elements such as total likes, followers, likes by country, by age , engagement types and Facebook videos views. Pitch your topic with ease and precision using this Facebook Strategies Dashboard To Track Progress Structure PDF. This layout presents information on Followers, Engagement Type, Shares. It is also available for immediate download and adjustment. So, changes can be made in the color, design, graphics or any other component to create a unique layout.

Call Center Metrics Dashboard With Average Queue Time Topics PDF
Mentioned slide outlines call center KPI dashboard which gives insights into customer agent performance. The KPI covered in the slide are total voicemail, average talk time, queue time, average quality rate, agent performance, etc. Pitch your topic with ease and precision using this Call Center Metrics Dashboard With Average Queue Time Topics PDF. This layout presents information on Efficiency, Quality, Activity. It is also available for immediate download and adjustment. So, changes can be made in the color, design, graphics or any other component to create a unique layout.

Call Center Metrics Dashboard With Customer Satisfaction Score Ideas PDF
Mentioned slide outlines a comprehensive call center KPI dashboard which can be used for those customers who are seeking technical support. It provides detailed information about metrics such as ticket status, ticket by channels and type, overall customer satisfaction score, etc. Showcasing this set of slides titled Call Center Metrics Dashboard With Customer Satisfaction Score Ideas PDF. The topics addressed in these templates are Customer Satisfaction, Score Ticket Status, Satisfaction Score. All the content presented in this PPT design is completely editable. Download it and make adjustments in color, background, font etc. as per your unique business setting.

Business Survey Analysis Dashboard Based On Demographics Data Microsoft PDF
The purpose of this template is to explain the analysis of business survey conduct based on demographics. The slide provides information about support team, respondents and product preference. Pitch your topic with ease and precision using this Business Survey Analysis Dashboard Based On Demographics Data Microsoft PDF. This layout presents information on Support, Team Performance, Product Preference It is also available for immediate download and adjustment. So, changes can be made in the color, design, graphics or any other component to create a unique layout.
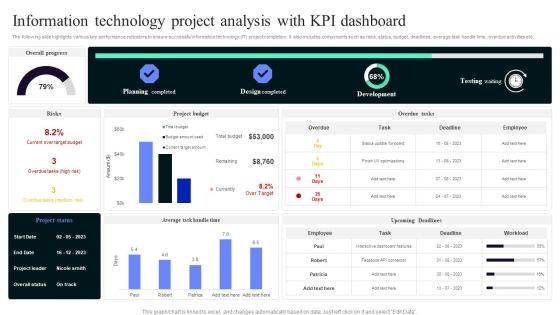
Information Technology Project Analysis With Kpi Dashboard Portrait PDF
The following slide highlights various key performance indicators to ensure successful information technology IT project completion. It also includes components such as risks, status, budget, deadlines, average task handle time, overdue activities etc. Pitch your topic with ease and precision using this Information Technology Project Analysis With Kpi Dashboard Portrait PDF. This layout presents information on Planning Completed, Design Completed, Development . It is also available for immediate download and adjustment. So, changes can be made in the color, design, graphics or any other component to create a unique layout.
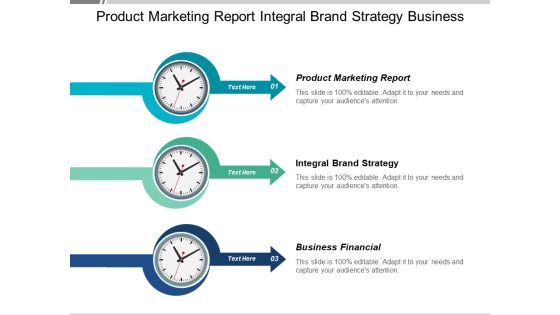
Product Marketing Report Integral Brand Strategy Business Financial Ppt PowerPoint Presentation Inspiration Backgrounds
This is a product marketing report integral brand strategy business financial ppt powerpoint presentation inspiration backgrounds. This is a three stage process. The stages in this process are product marketing report, integral brand strategy, business financial.

Dashboard For Managing Warehouse Operations Mockup PDF
This slide showcases dashboard that can help organization to manage and track the warehouse operations. Its key elements are order, volume, inventory, monthly KPIs and global financial performance. Here you can discover an assortment of the finest PowerPoint and Google Slides templates. With these templates, you can create presentations for a variety of purposes while simultaneously providing your audience with an eye catching visual experience. Download Dashboard For Managing Warehouse Operations Mockup PDF to deliver an impeccable presentation. These templates will make your job of preparing presentations much quicker, yet still, maintain a high level of quality. Slidegeeks has experienced researchers who prepare these templates and write high quality content for you. Later on, you can personalize the content by editing the Dashboard For Managing Warehouse Operations Mockup PDF.
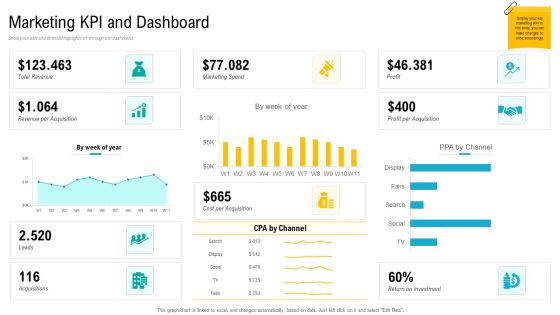
Product USP Marketing KPI And Dashboard Ppt Layouts Slides PDF
Show your sale and financial highlights of through our dashboard. Deliver an awe-inspiring pitch with this creative product usp marketing kpi and dashboard ppt layouts slides pdf bundle. Topics like marketing kpi and dashboard can be discussed with this completely editable template. It is available for immediate download depending on the needs and requirements of the user.

Commodity Unique Selling Proposition Marketing Kpi And Dashboard Formats PDF
Show your sale and financial highlights of through our dashboard. Deliver an awe inspiring pitch with this creative commodity unique selling proposition marketing kpi and dashboard formats pdf bundle. Topics like revenue, marketing, profit, cost can be discussed with this completely editable template. It is available for immediate download depending on the needs and requirements of the user.

Financial Analysis Vector Bar Graph With Magnifying Glass Ppt PowerPoint Presentation Gallery Design Ideas
This is a financial analysis vector bar graph with magnifying glass ppt powerpoint presentation gallery design ideas. This is a four stage process. The stages in this process are marketing analytics, marketing performance, marketing discovery.

Kpi Dashboard Ppt PowerPoint Presentation Good
This is a kpi dashboard ppt powerpoint presentation good. This is a one stage process. The stages in this process are outcasts, earned revenue, successful adverts, sold products.

Balanced Scorecard Dashboard Framework Ppt Sample
This is a balanced scorecard dashboard framework ppt sample. This is a four stage process. The stages in this process are learning and growth, financial, internal business processes, customer.
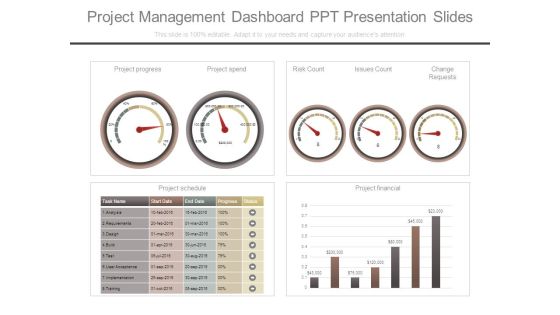
Project Management Dashboard Ppt Presentation Slides
This is a project management dashboard ppt presentation slides. This is a four stage process. The stages in this process are project progress, project spend, risk count, issues count, change requests, project schedule, project financial, task name, start date, end date, progress, status, analysis, requirements, design, build, test, user acceptance, implementation, training.
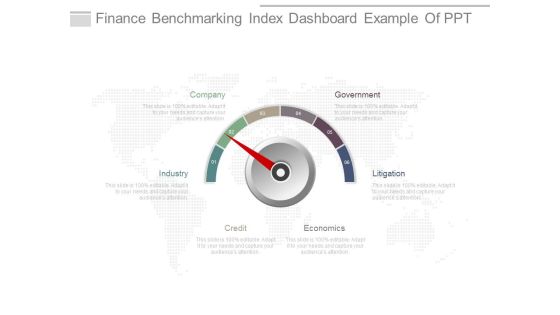
Finance Benchmarking Index Dashboard Example Of Ppt
This is a finance benchmarking index dashboard example of ppt. This is a six stage process. The stages in this process are industry, company, government, litigation, economics, credit.

Sales Kpis Monitor Dashboard Ppt Infographic Template
This is a sales kpis monitor dashboard ppt infographic template. This is a one stage process. The stages in this process are promotion, marketing, sales revenue, social channels.
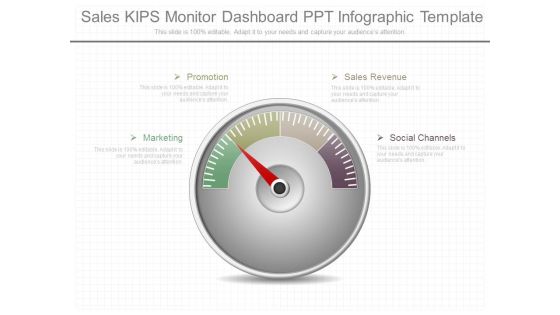
Sales Kips Monitor Dashboard Ppt Infographic Template
This is a sales kips monitor dashboard ppt infographic template. This is a four stage process. The stages in this process are promotion, marketing, sales revenue, social channels.
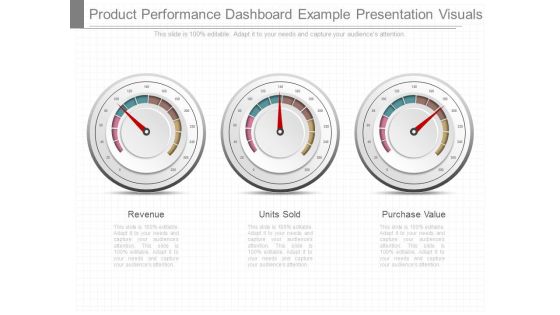
Product Performance Dashboard Example Presentation Visuals
This is a product performance dashboard example presentation visuals. This is a three stage process. The stages in this process are revenue, units sold, purchase value.
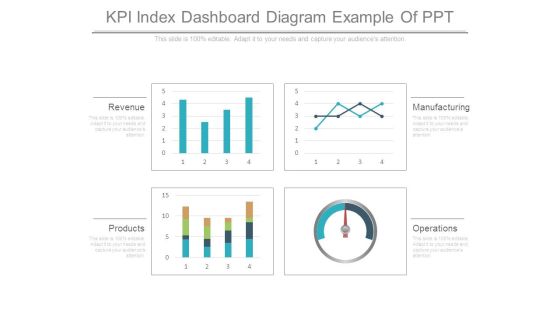
Kpi Index Dashboard Diagram Example Of Ppt
This is a kpi index dashboard diagram example of ppt. This is a four stage process. The stages in this process are revenue, products, operations, manufacturing.
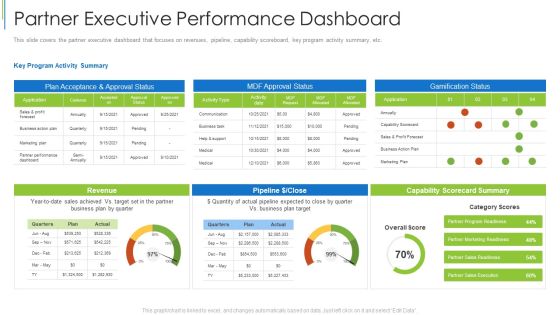
Partner Executive Performance Dashboard Ppt Styles PDF
This slide covers the partner executive dashboard that focuses on revenues, pipeline, capability scoreboard, key program activity summary, etc. Deliver an awe inspiring pitch with this creative partner executive performance dashboard ppt styles pdf bundle. Topics like business action plan, marketing plan, dashboard can be discussed with this completely editable template. It is available for immediate download depending on the needs and requirements of the user.

Company Performance Dashboard With Weekly Sales Revenue Structure PDF
This slide showcases the dashboard of financial organizational performance. It include average revenue per unit, customer lifetime value etc. Showcasing this set of slides titled company performance dashboard with weekly sales revenue structure pdf. The topics addressed in these templates are company performance dashboard with weekly sales revenue. All the content presented in this PPT design is completely editable. Download it and make adjustments in color, background, font etc. as per your unique business setting.
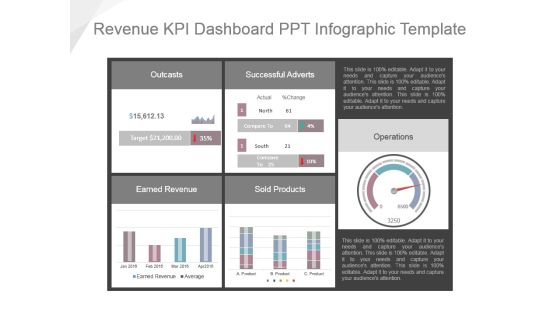
Revenue Kpi Dashboard Ppt Infographic Template
This is a revenue kpi dashboard ppt infographic template. This is a five stage process. The stages in this process are outcasts, successful adverts, earned revenue, sold products, operations.

Business Intelligence Performance Dashboard Ppt Powerpoint Slides
This is a business intelligence performance dashboard ppt powerpoint slides. This is a six stage process. The stages in this process are total revenue, detailed profit of top product line, part capacity allocation, market share, customer satisfaction, quality notification.
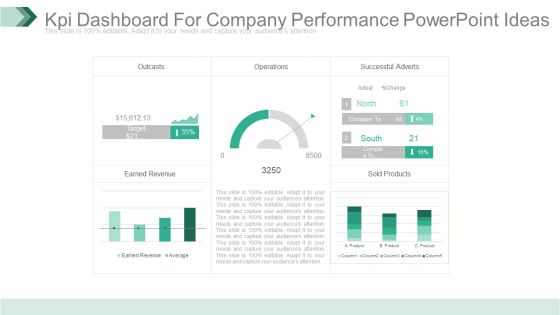
Kpi Dashboard For Company Performance Powerpoint Ideas
This is a kpi dashboard for company performance powerpoint ideas. This is a five stage process. The stages in this process are outcasts, operations, successful adverts, earned revenue, sold products.

Kpi Dashboard For Operations Powerpoint Slide Images
This is a kpi dashboard for operations powerpoint slide images. This is a four stage process. The stages in this process are outcasts, earned revenue, operations, successful adverts, sold products.
Modifying Banking Functionalities Dashboard Tracking Customer Retention Rate Information PDF
This slide contains dashboard that will allow bank to track the retention rate of customer within span of 6 months. Number of accounts that are successfully retained by the bank. It will also bank in tracking accounts that are cancelled. Deliver and pitch your topic in the best possible manner with this enhancing financial institution operations dashboard tracking customer retention rate ideas pdf. Use them to share invaluable insights on dashboard tracking customer retention rate and impress your audience. This template can be altered and modified as per your expectations. So, grab it now.
Modifying Banking Functionalities Dashboard Tracking Online Banking Activities Background PDF
This slide contains dashboard that will allow bank to track the online customer activities in terms of new customer connected with bank on online platform, fraud prevention. It will also help the bank in tracking the numbers of employees that are connected to bank through mobile access. Deliver and pitch your topic in the best possible manner with this enhancing financial institution operations dashboard tracking online banking activities rules pdf. Use them to share invaluable insights on management, service, access and impress your audience. This template can be altered and modified as per your expectations. So, grab it now.

Dashboard Ppt PowerPoint Presentation Infographic Template Graphic Tips
This is a dashboard ppt powerpoint presentation infographic template graphic tips. This is a three stage process. The stages in this process are low, medium, high, finance.

Balanced Scorecard Dashboard Illustration Ppt Slides
This is a balanced scorecard dashboard illustration ppt slides. This is a five stage process. The stages in this process are business benefits, financials, schedule, technology, customer.
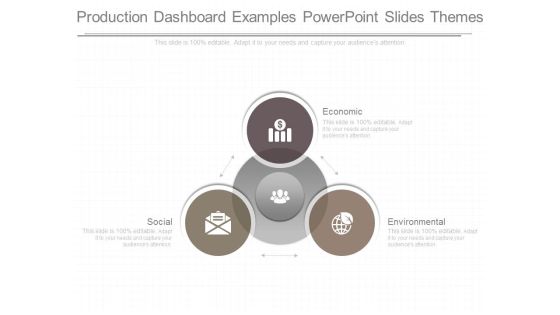
Production Dashboard Examples Powerpoint Slides Themes
This is a production dashboard examples powerpoint slides themes. This is a three stage process. The stages in this process are economic, social, environmental.
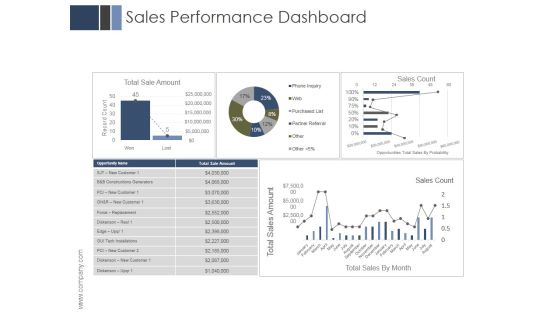
Sales Performance Dashboard Ppt PowerPoint Presentation Example 2015
This is a sales performance dashboard ppt powerpoint presentation example 2015. This is a four stage process. The stages in this process are business, marketing, management, finance, dashboard.
Referral Program Performance Tracking Dashboard Elements PDF
This slide covers the KPI dashboard for analyzing referral campaign results. It includes metrics such as total revenue generated, monthly recurring revenue, new customers, clicks, cancelled customers, paying customers, etc. Deliver an awe inspiring pitch with this creative Referral Program Performance Tracking Dashboard Elements PDF bundle. Topics like Dashboard, Monthly Recurring Revenue, Paying Customers can be discussed with this completely editable template. It is available for immediate download depending on the needs and requirements of the user.

Crm Dashboard Kpis Ppt PowerPoint Presentation Pictures
This is a crm dashboard kpis ppt powerpoint presentation pictures. This is a five stage process. The stages in this process are revenue, acquisition, active subscribers.
Referral Program Performance Tracking Dashboard Summary PDF
This slide covers the KPI dashboard for analyzing referral campaign results. It includes metrics such as total revenue generated, monthly recurring revenue, new customers, clicks, cancelled customers, paying customers, etc. Deliver and pitch your topic in the best possible manner with this Referral Program Performance Tracking Dashboard Summary PDF. Use them to share invaluable insights on Referral Program Performance, Tracking Dashboard and impress your audience. This template can be altered and modified as per your expectations. So, grab it now.

Smartphone Sales Dashboard Ppt Styles Layouts PDF
This slide shows the dashboard related to smartphone market overview, revenue and sales of the company with top smartphones with their details. Deliver and pitch your topic in the best possible manner with this smartphone sales dashboard ppt styles layouts pdf. Use them to share invaluable insights on smartphone sales dashboard and impress your audience. This template can be altered and modified as per your expectations. So, grab it now.
Devops Activities Management Dashboard Average Icons PDF
This slide provides information regarding essential DevOps activities management dashboard in terms of revenue by hour, storefront users, errors by host, response time by app, etc. Deliver and pitch your topic in the best possible manner with this devops activities management dashboard average icons pdf. Use them to share invaluable insights on devops activities management dashboard and impress your audience. This template can be altered and modified as per your expectations. So, grab it now.

Devops Activities Management Dashboard Formats PDF
This slide provides information regarding essential DevOps activities management dashboard in terms of revenue by hour, storefront users, errors by host, response time by app, etc.Deliver and pitch your topic in the best possible manner with this devops activities management dashboard formats pdf. Use them to share invaluable insights on devops activities management dashboard and impress your audience. This template can be altered and modified as per your expectations. So, grab it now.
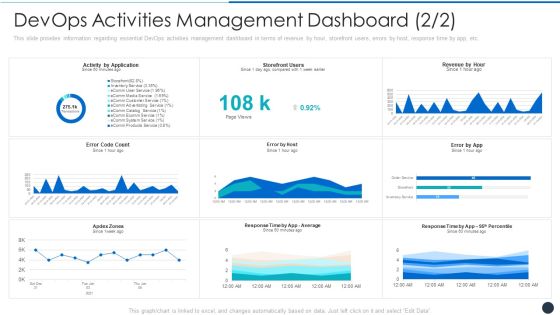
Devops Activities Management Dashboard Response Structure PDF
This slide provides information regarding essential DevOps activities management dashboard in terms of revenue by hour, storefront users, errors by host, response time by app, etc. Deliver an awe inspiring pitch with this creative devops activities management dashboard response structure pdf bundle. Topics like devops activities management dashboard can be discussed with this completely editable template. It is available for immediate download depending on the needs and requirements of the user.
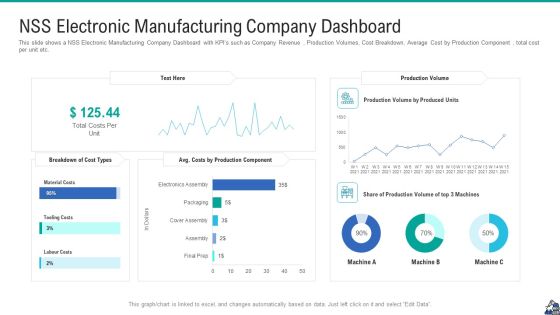
NSS Electronic Manufacturing Company Dashboard Portrait PDF
This slide shows a NSS Electronic Manufacturing Company Dashboard with KPI s such as Company Revenue , Production Volumes, Cost Breakdown, Average Cost by Production Component , total cost per unit etc. Deliver an awe inspiring pitch with this creative nss electronic manufacturing company dashboard portrait pdf bundle. Topics like nss electronic manufacturing company dashboard can be discussed with this completely editable template. It is available for immediate download depending on the needs and requirements of the user.
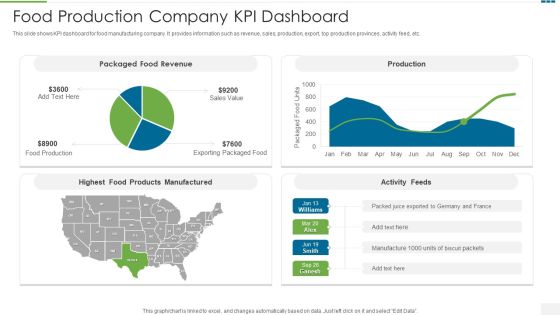
Food Production Company KPI Dashboard Formats PDF
This slide shows KPI dashboard for food manufacturing company. It provides information such as revenue, sales, production, export, top production provinces, activity feed, etc.Showcasing this set of slides titled food production company kpi dashboard formats pdf The topics addressed in these templates are food production company kpi dashboard All the content presented in this PPT design is completely editable. Download it and make adjustments in color, background, font etc. as per your unique business setting.
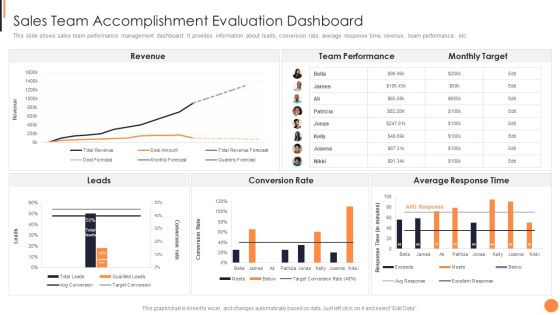
Sales Team Accomplishment Evaluation Dashboard Portrait PDF
This slide shows sales team performance management dashboard. It provides information about leads, conversion rate, average response time, revenue, team performance, etc. Pitch your topic with ease and precision using this sales team accomplishment evaluation dashboard portrait pdf This layout presents information on sales team accomplishment evaluation dashboard It is also available for immediate download and adjustment. So, changes can be made in the color, design, graphics or any other component to create a unique layout.
Loyalty Program Performance Tracking Dashboard Topics PDF
This slide covers the KPI dashboard for analyzing customer loyalty campaign results. It includes metrics such as revenue, liability, NQP accrued, transaction count, members, redemption ratio, etc. Deliver an awe inspiring pitch with this creative Loyalty Program Performance Tracking Dashboard Topics PDF bundle. Topics like Loyalty Program Performance, Tracking Dashboard can be discussed with this completely editable template. It is available for immediate download depending on the needs and requirements of the user.

Partners Performance Assessment Dashboard Graphics PDF
This slide provides information regarding the dashboard for partners performance assessment in terms of revenue generated, etc. Deliver an awe-inspiring pitch with this creative partners performance assessment dashboard graphics pdf. bundle. Topics like revenue generated, pipeline, pipeline or close can be discussed with this completely editable template. It is available for immediate download depending on the needs and requirements of the user.

Attended Robotic Process Automation Dashboard Rules PDF
This slide consists of a strategic automation dashboard used to monitor attended robotic process which will assist managers to track the performance. The key performance indicators include money saved, time saved, monetary goal for the year etc. Showcasing this set of slides titled Attended Robotic Process Automation Dashboard Rules PDF. The topics addressed in these templates are Productivity, Goal, Process Automation Dashboard. All the content presented in this PPT design is completely editable. Download it and make adjustments in color, background, font etc. as per your unique business setting.
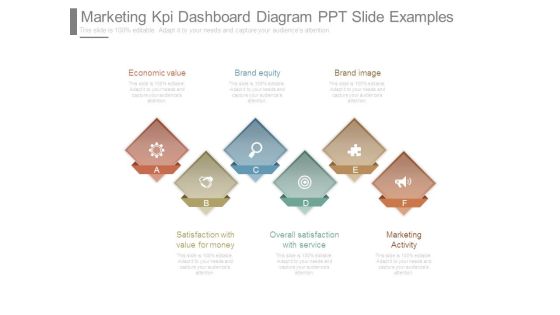
Marketing Kpi Dashboard Diagram Ppt Slide Examples
This is a marketing kpi dashboard diagram ppt slide examples. This is a six stage process. The stages in this process are economic value, satisfaction with value for money, brand equity, overall satisfaction with service, brand image, marketing activity.
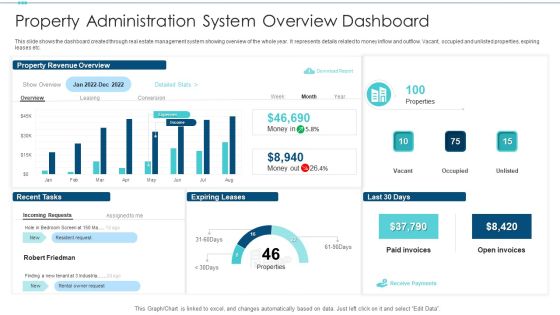
Property Administration System Overview Dashboard Demonstration PDF
This slide shows the dashboard created through real estate management system showing overview of the whole year. It represents details related to money inflow and outflow. Vacant, occupied and unlisted properties, expiring leases etc. Showcasing this set of slides titled property administration system overview dashboard demonstration pdf. The topics addressed in these templates are property administration system overview dashboard. All the content presented in this PPT design is completely editable. Download it and make adjustments in color, background, font etc. as per your unique business setting.
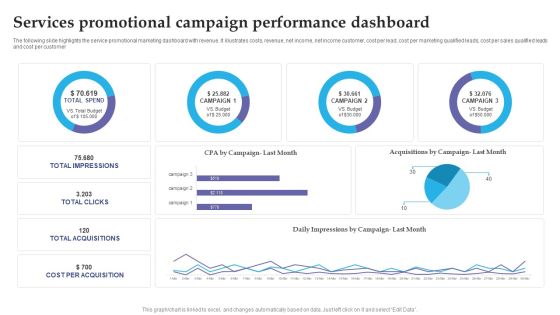
Services Promotional Campaign Performance Dashboard Slides PDF
The following slide highlights the service promotional marketing dashboard with revenue. It illustrates costs, revenue, net income, net income customer, cost per lead, cost per marketing qualified leads, cost per sales qualified leads and cost per customer. Pitch your topic with ease and precision using this Services Promotional Campaign Performance Dashboard Slides PDF. This layout presents information on Services Promotional, Campaign Performance Dashboard. It is also available for immediate download and adjustment. So, changes can be made in the color, design, graphics or any other component to create a unique layout.
Property Management Dashboard One Pager Documents
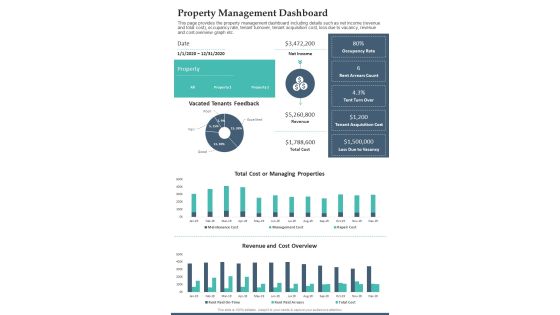
This page provides the property management dashboard including details such as net income revenue and total cost, occupancy rate, tenant turnover, tenant acquisition cost, loss due to vacancy, revenue and cost overview graph etc. Presenting you an exemplary Property Management Dashboard One Pager Documents. Our one-pager comprises all the must-have essentials of an inclusive document. You can edit it with ease, as its layout is completely editable. With such freedom, you can tweak its design and other elements to your requirements. Download this Property Management Dashboard One Pager Documents brilliant piece now.

Retail Outlet Annual Sales Dashboard Elements PDF
This slide shows the retail store annual dashboard which includes sales revenue, total customers average transaction value, average units per customer, sales by division top five articles by sold items bar chart, total customer and visitors line chart, sales by city, average price and unit per transaction line chart etc.Pitch your topic with ease and precision using this retail outlet annual sales dashboard elements pdf This layout presents information on Retail outlet annual sales dashboard It is also available for immediate download and adjustment. So, changes can be made in the color, design, graphics or any other component to create a unique layout.

Dashboard Showing Construction Project Metrics Sample PDF
This slide shows the dashboard which depicts the construction project management performance such as billing date, working profit, total cost, billed percentage, budget spent, completed projects and comparison of two companies about revenues earned from project. Showcasing this set of slides titled Dashboard Showing Construction Project Metrics Sample PDF. The topics addressed in these templates are Dashboard, Construction Project Metrics. All the content presented in this PPT design is completely editable. Download it and make adjustments in color, background, font etc. as per your unique business setting.

Customer Healthcare Service Management Dashboard Themes PDF
The slide shows a dashboard for health care consultant to effectively manage of booked appointments. It includes key elements such as review score, patients, appointment sin current month, recently attended appointments, monthly revenue, previous months attended meetings, etc. Showcasing this set of slides titled Customer Healthcare Service Management Dashboard Themes PDF. The topics addressed in these templates are Customer Healthcare Service, Management Dashboard. All the content presented in this PPT design is completely editable. Download it and make adjustments in color, background, font etc. as per your unique business setting.

Customer Support Services Analysis Dashboard Template PDF
The following slide illustrates dashboard for customer services which can be used to evaluate performance of businesses over the years. It include key elements such as request volume, customer retention, cost per support, revenue, customer satisfaction etc. Showcasing this set of slides titled Customer Support Services Analysis Dashboard Template PDF. The topics addressed in these templates are Customer Support Services, Analysis Dashboard. All the content presented in this PPT design is completely editable. Download it and make adjustments in color, background, font etc. as per your unique business setting.

Monthly Product Sales Analysis Dashboard Infographics PDF
This slide illustrates a dashboard for product sales review to measure to help business monitor and improve productivity, employee engagement and meet revenue targets. It covers product names with sales reps, lead conversion, response time and outbound calls. Showcasing this set of slides titled Monthly Product Sales Analysis Dashboard Infographics PDF. The topics addressed in these templates are Lead Conversion Rate, Outbound Calls, Sales Analysis Dashboard. All the content presented in this PPT design is completely editable. Download it and make adjustments in color, background, font etc. as per your unique business setting.
Example Of Scorecards Dashboard Ppt Slide Example
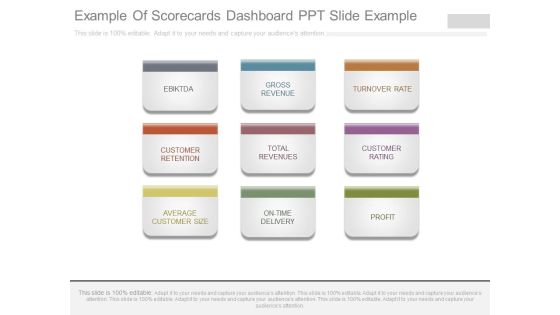
This is a example of scorecards dashboard ppt slide example. This is a nine stage process. The stages in this process are ebiktda, gross revenue, turnover rate, customer retention, total revenues, customer rating, average customer size, on time delivery, profit.
Executive Dashboard Samples Ppt Powerpoint Topics
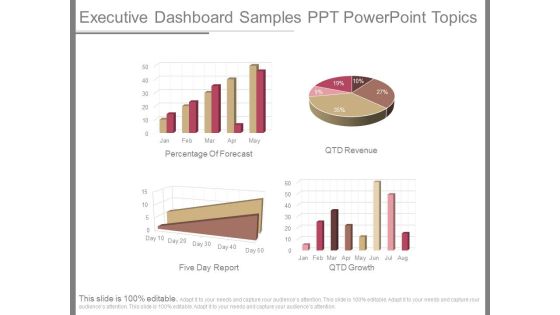
This is a executive dashboard samples ppt powerpoint topics. This is a four stage process. The stages in this process are percentage of forecast, qtd revenue, five day report, qtd growth

Determine Partners Capability Dashboard Designs PDF
This slide provides information regarding the dashboard for partners capability assessment in terms of revenue generated, capability scorecard etc. Deliver and pitch your topic in the best possible manner with this determine partners capability dashboard designs pdf. Use them to share invaluable insights on revenue, pipeline, capability scorecard summary, key program activity summary and impress your audience. This template can be altered and modified as per your expectations. So, grab it now.

Food Production Plant Management Dashboard Clipart PDF
This slide illustrates food production factory management dashboard. It provides information such as total production, active machines, sales revenue, shifts, expenses, manpower, rejected products, etc.Pitch your topic with ease and precision using this food production plant management dashboard clipart pdf This layout presents information on total production, active machines, sales revenue It is also available for immediate download and adjustment. So, changes can be made in the color, design, graphics or any other component to create a unique layout.

Shipment Services Company Monthly Dashboard Designs PDF
This slide shows the monthly dashboard of logistics company. It includes transport status, country wise profit, average delivery time, revenue, cost, profit, shipment, delivery status etc. Showcasing this set of slides titled Shipment Services Company Monthly Dashboard Designs PDF. The topics addressed in these templates are Costs, Revenue, Maintenance. All the content presented in this PPT design is completely editable. Download it and make adjustments in color, background, font etc. as per your unique business setting.

B2B Prospects Performance Measurement Dashboard Guidelines PDF
This slide provides information regarding B2B performance tracking dashboard to measure leads, MQL, SQL, customers, revenue goals, total media spend. Deliver an awe inspiring pitch with this creative B2B Prospects Performance Measurement Dashboard Guidelines PDF bundle. Topics like Customers, Leads, Revenue Goal can be discussed with this completely editable template. It is available for immediate download depending on the needs and requirements of the user.
Loyalty Program Performance Tracking Dashboard Background PDF
This slide covers the KPI dashboard for analyzing customer loyalty campaign results. It includes metrics such as revenue, liability, NQP accrued, transaction count, members, redemption ratio, etc. Deliver an awe inspiring pitch with this creative Loyalty Program Performance Tracking Dashboard Background PDF bundle. Topics like Liability, Revenue, Redemption Ratio can be discussed with this completely editable template. It is available for immediate download depending on the needs and requirements of the user.

Cart Recovery Dashboard Ppt Outline Icon PDF
Measure which email campaigns brought the most recovery, which age group responded the best, and other KPIs via a dashboard. Deliver an awe-inspiring pitch with this creative cart recovery dashboard ppt outline icon pdf bundle. Topics like recovery by the numbers, recovery breakdown, revenue per email rpe can be discussed with this completely editable template. It is available for immediate download depending on the needs and requirements of the user.

NSS Electronic Manufacturing Company Dashboard Topics PDF
This slide shows a NSS Electronic Manufacturing Company Dashboard with KPIs such as Company Revenue , Production Volumes, Cost Breakdown, Average Cost by Production Component , total cost per unit etc. Deliver an awe inspiring pitch with this creative nss electronic manufacturing company dashboard topics pdf bundle. Topics like material costs, tooling costs, labour costs, total costs per unit can be discussed with this completely editable template. It is available for immediate download depending on the needs and requirements of the user.

B2b Sales Representative Insights Dashboard Sample PDF
Deliver and pitch your topic in the best possible manner with this b2b sales representative insights dashboard sample pdf. Use them to share invaluable insights on sales representative insights dashboardThis slide covers the sales reps dashboard wherein teams contribution to leads, managing SQLs and revenue targets are evaluated. and impress your audience. This template can be altered and modified as per your expectations. So, grab it now.

B2B Prospects Performance Measurement Dashboard Ideas PDF
This slide provides information regarding B2B performance tracking dashboard to measure leads, MQL, SQL, customers, revenue goals, total media spend. Deliver an awe inspiring pitch with this creative b2b prospects performance measurement dashboard ideas pdf bundle. Topics like ineffective in managing requirements, essential points are catered, understanding of company can be discussed with this completely editable template. It is available for immediate download depending on the needs and requirements of the user.

AML Transaction Risks Monitoring Dashboard Microsoft PDF
This slide showcases anti-money laundering AML transactions risk monitoring dashboard. It provides details about entities count, transaction summary, low risk, high, risk, etc. Whether you have daily or monthly meetings, a brilliant presentation is necessary. AML Transaction Risks Monitoring Dashboard Microsoft PDF can be your best option for delivering a presentation. Represent everything in detail using AML Transaction Risks Monitoring Dashboard Microsoft PDF and make yourself stand out in meetings. The template is versatile and follows a structure that will cater to your requirements. All the templates prepared by Slidegeeks are easy to download and edit. Our research experts have taken care of the corporate themes as well. So, give it a try and see the results.

Dashboard Depicting Customer Retention Analytics Background PDF
This slide shows the dashboard that depicts customer retention analytics which includes net promoter score, customer loyalty rate, customer lifetime value, customer and revenue churn, monthly recurring revenue growth, etc. Make sure to capture your audiences attention in your business displays with our gratis customizable Dashboard Depicting Customer Retention Analytics Background PDF. These are great for business strategies, office conferences, capital raising or task suggestions. If you desire to acquire more customers for your tech business and ensure they stay satisfied, create your own sales presentation with these plain slides.

Project Metrics Dashboard With Stages Download PDF
This slide shows the project management dashboard which includes start and end date if project, its duration, status of the project, key project links and project stages with metrics such as proposal, kick off, discovery, actions, optimization , etc. Pitch your topic with ease and precision using this Project Metrics Dashboard With Stages Download PDF. This layout presents information on Economic, Project Plan, Execution. It is also available for immediate download and adjustment. So, changes can be made in the color, design, graphics or any other component to create a unique layout.
Online Product Sales Performance Dashboard Designs PDF
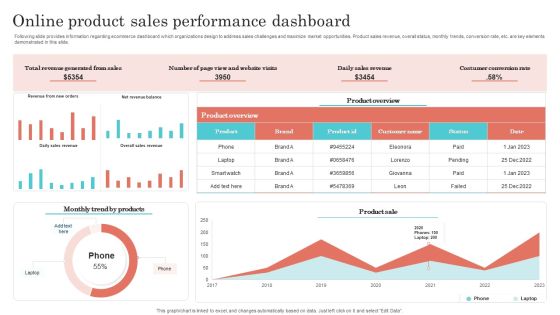
Following slide provides information regarding ecommerce dashboard which organizations design to address sales challenges and maximize market opportunities. Product sales revenue, overall status, monthly trends, conversion rate, etc. are key elements demonstrated in this slide. Showcasing this set of slides titled Online Product Sales Performance Dashboard Designs PDF. The topics addressed in these templates are Revenue Generated From Sales, Daily Sales Revenue, Costumer Conversion Rate. All the content presented in this PPT design is completely editable. Download it and make adjustments in color, background, font etc. as per your unique business setting.

Business Operations Performance Assessment Dashboard Information PDF
This slide presents a dashboard to analyze and monitor business operational activities and gain insights of functional performance. It includes key components such as revenue, sigh ups, visitors, revenue by source, monthly sign ups, top performing agents, etc. Showcasing this set of slides titled Business Operations Performance Assessment Dashboard Information PDF. The topics addressed in these templates are Source, Monthly, Agents. All the content presented in this PPT design is completely editable. Download it and make adjustments in color, background, font etc. as per your unique business setting.
Investment Project Prioritization KPI Dashboard Icons PDF
This slide covers project management dashboard for ranking and filtering capital projects. It also include KPIs such as top projects by NPV, top projects by IRR, investor amount, return amount, etc. Showcasing this set of slides titled Investment Project Prioritization KPI Dashboard Icons PDF. The topics addressed in these templates are Project Performance, Top Project NPV, Top Project IRR. All the content presented in this PPT design is completely editable. Download it and make adjustments in color, background, font etc. as per your unique business setting.

Organization Reinvention Digital Finance Dashboard Clipart PDF
This slide covers the advanced technologies entering the market from past few decades. The combinatorial effects of base technologies, such as mobile, cloud, sensors, analytics and the Internet of Things IoT, are accelerating progress exponentially. This slide covers transformation dashboard covering various stages of a business along with the budget and risks involved at every stage. Deliver and pitch your topic in the best possible manner with this Organization Reinvention Digital Finance Dashboard Clipart PDF. Use them to share invaluable insights on Revenue By Channels, Operating Cost, Digital Budget and impress your audience. This template can be altered and modified as per your expectations. So, grab it now.

B2B Market Segmentation Dashboard Microsoft PDF
This slide illustrates the market segmentation dashboard for B2B which can benefit them to improve the focus and boost the revenue of the organization. It includes segmentation based in company size and different industries under B2B market. Pitch your topic with ease and precision using this B2B Market Segmentation Dashboard Microsoft PDF. This layout presents information on Industries, Market Segmentation, Service. It is also available for immediate download and adjustment. So, changes can be made in the color, design, graphics or any other component to create a unique layout.
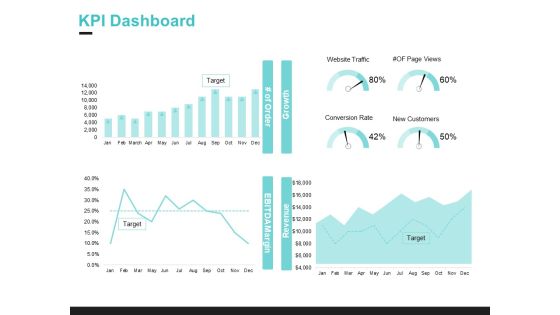
Inbound Marketing Proposal KPI Dashboard Designs PDF
Deliver and pitch your topic in the best possible manner with this inbound marketing proposal kpi dashboard designs pdf. Use them to share invaluable insights on target, growth, revenue and impress your audience. This template can be altered and modified as per your expectations. So, grab it now.

Telecom Company User Base Dashboard Download PDF
Deliver and pitch your topic in the best possible manner with this telecom company user base dashboard download pdf. Use them to share invaluable insights on subscriber segmentation by service type, average revenue per user by plan, network utilization by subscribers and impress your audience. This template can be altered and modified as per your expectations. So, grab it now.

Dashboard Airline Company Stats Structure PDF
Deliver an awe-inspiring pitch with this creative dashboard airline company stats structure pdf. bundle. Topics like revenue, employees, operating income can be discussed with this completely editable template. It is available for immediate download depending on the needs and requirements of the user.

Dashboard Airline Company Stats Clipart PDF
Deliver and pitch your topic in the best possible manner with this dashboard airline company stats clipart pdf. Use them to share invaluable insights on customer satisfaction, overall timeliness, revenue and impress your audience. This template can be altered and modified as per your expectations. So, grab it now.

Customer Relationship Management Dashboard Revenue Background PDF
This slide covers the competitive analysis of different partner relationship management software which are compared based on features ratings and software prices. Deliver and pitch your topic in the best possible manner with this customer relationship management dashboard revenue background pdf. Use them to share invaluable insights on supply chain planning, fulfillment management, transportation management, inventory management and impress your audience. This template can be altered and modified as per your expectations. So, grab it now.

Crm Dashboard Top Customer Ppt PowerPoint Presentation Ideas
This is a crm dashboard top customer ppt powerpoint presentation ideas. This is a five stage process. The stages in this process are customer.
