Financial Dashboard
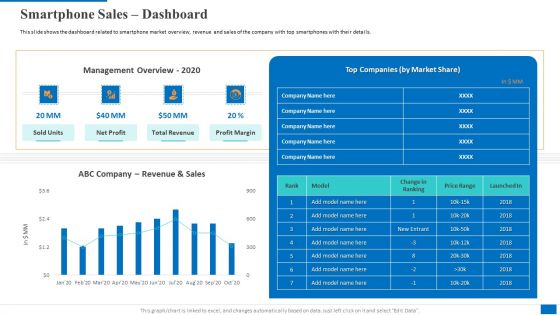
Smartphone Sales Dashboard Graphics PDF
This slide shows the dashboard related to smartphone market overview, revenue and sales of the company with top smartphones with their details.Deliver an awe inspiring pitch with this creative smartphone sales dashboard graphics pdf bundle. Topics like smartphone sales dashboard can be discussed with this completely editable template. It is available for immediate download depending on the needs and requirements of the user.

Smartphone Sales Dashboard Microsoft PDF
Deliver an awe-inspiring pitch with this creative smartphone sales dashboard microsoft pdf bundle. Topics like management overview, top companies, company, revenue, sales can be discussed with this completely editable template. It is available for immediate download depending on the needs and requirements of the user.
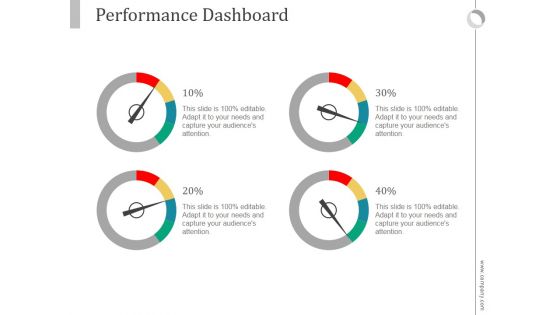
Performance Dashboard Ppt PowerPoint Presentation Background Image
This is a performance dashboard ppt powerpoint presentation background image. This is a four stage process. The stages in this process are business, marketing, management, dashboard, finance.
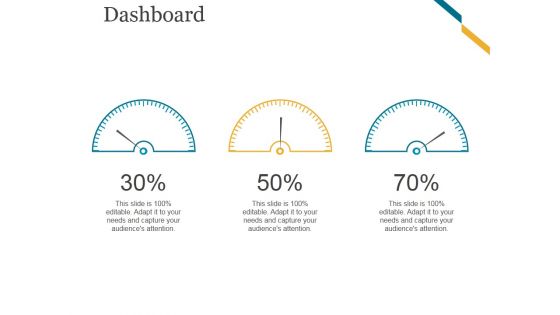
Dashboard Ppt PowerPoint Presentation Infographic Template Tips
This is a dashboard ppt powerpoint presentation infographic template tips. This is a three stage process. The stages in this process are speedometer, dashboard, business, marketing, equipment.
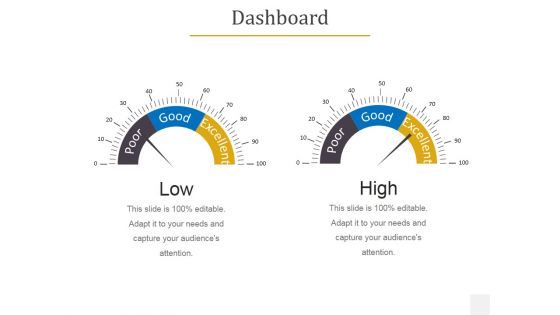
Dashboard Ppt PowerPoint Presentation Gallery Background
This is a dashboard ppt powerpoint presentation gallery background. This is a two stage process. The stages in this process are low, high, business, marketing, dashboard.

Dashboard Ppt PowerPoint Presentation Portfolio Example
This is a dashboard ppt powerpoint presentation portfolio example. This is a two stage process. The stages in this process are business, strategy, marketing, planning, finance, dashboard.
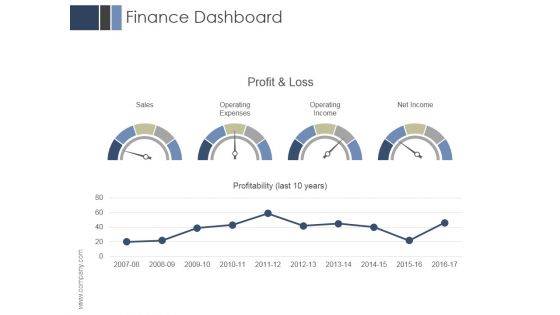
Finance Dashboard Ppt PowerPoint Presentation Design Ideas
This is a finance dashboard ppt powerpoint presentation design ideas. This is a two stage process. The stages in this process are sales, operating expenses, operating income, net income.
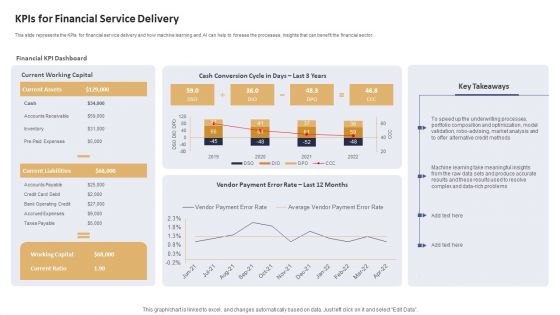
Data Processing Services Delivery Kpis For Financial Service Delivery Diagrams PDF
This slide represents the KPIs for financial service delivery and how machine learning and AI can help to foresee the processes, insights that can benefit the financial sector. Deliver an awe inspiring pitch with this creative Data Processing Services Delivery Kpis For Financial Service Delivery Diagrams PDF bundle. Topics like Financial KPI Dashboard, Current Working Capital, Cash Conversion can be discussed with this completely editable template. It is available for immediate download depending on the needs and requirements of the user.
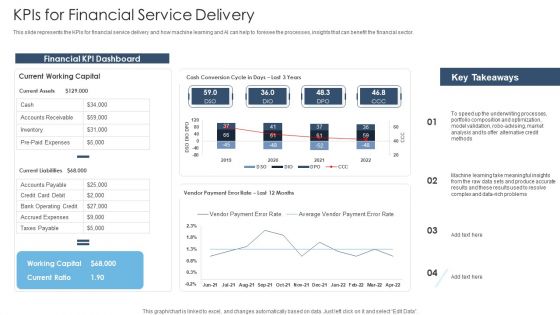
Achieving Proactive From Reactive Kpis For Financial Service Delivery Background PDF
This slide represents the KPIs for financial service delivery and how machine learning and AI can help to foresee the processes, insights that can benefit the financial sector. Deliver an awe inspiring pitch with this creative Achieving Proactive From Reactive Kpis For Financial Service Delivery Background PDF bundle. Topics like Financial KPI Dashboard, Current Working Capital, Working Capital can be discussed with this completely editable template. It is available for immediate download depending on the needs and requirements of the user.
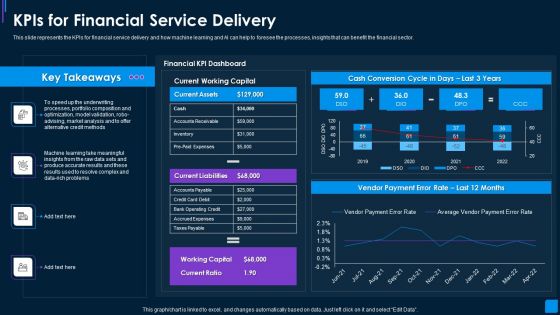
Advance IT Service Delivery Kpis For Financial Service Delivery Ideas PDF
This slide represents the KPIs for financial service delivery and how machine learning and AI can help to foresee the processes, insights that can benefit the financial sector. Deliver an awe inspiring pitch with this creative advance it service delivery kpis for financial service delivery ideas pdf bundle. Topics like financial kpi dashboard, current working capital, cash conversion cycle can be discussed with this completely editable template. It is available for immediate download depending on the needs and requirements of the user.
Dashboard Ppt PowerPoint Presentation Outline Icon
This is a dashboard ppt powerpoint presentation outline icon. This is a three stage process. The stages in this process are speed, meter, business, marketing, equipment.
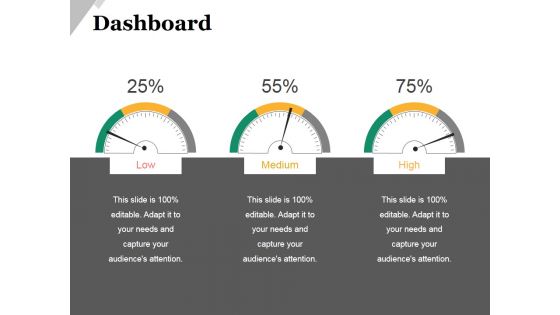
Dashboard Ppt PowerPoint Presentation Layouts Elements
This is a dashboard ppt powerpoint presentation layouts elements. This is a three stage process. The stages in this process are speed, meter, business, marketing, equipment.
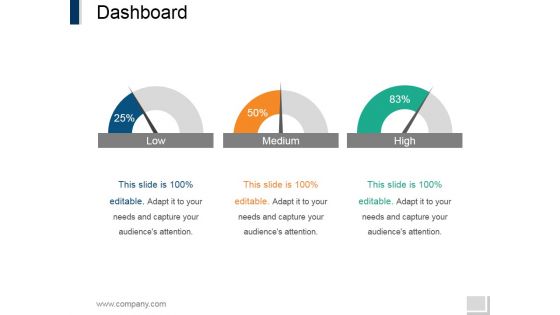
Dashboard Ppt PowerPoint Presentation Pictures Portfolio
This is a dashboard ppt powerpoint presentation pictures portfolio. This is a three stage process. The stages in this process are speed, meter, business, marketing, equipment.

Dashboard Ppt PowerPoint Presentation Show Background Designs
This is a dashboard ppt powerpoint presentation show background designs. This is a three stage process. The stages in this process are low, medium, high.

Dashboard Ppt PowerPoint Presentation Outline Professional
This is a dashboard ppt powerpoint presentation outline professional. This is a two stage process. The stages in this process are business, marketing, medium, high, management.
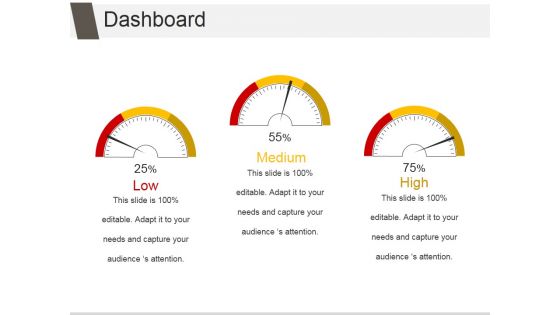
Dashboard Ppt PowerPoint Presentation Inspiration File Formats
This is a dashboard ppt powerpoint presentation inspiration file formats. This is a three stage process. The stages in this process are speed, meter, business, marketing, equipment.
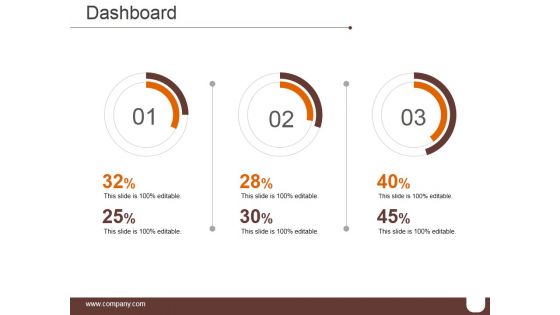
Dashboard Ppt PowerPoint Presentation Infographics Format Ideas
This is a dashboard ppt powerpoint presentation infographics format ideas. This is a three stage process. The stages in this process are speed, meter, business, marketing, equipment.
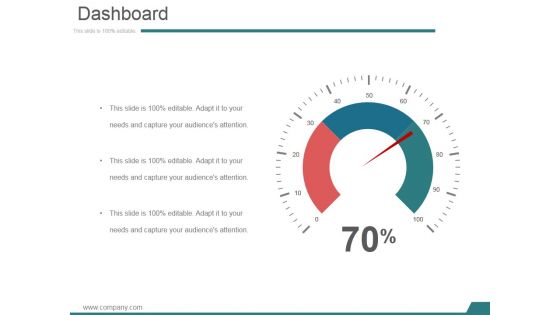
Dashboard Ppt PowerPoint Presentation Infographics Sample
This is a dashboard ppt powerpoint presentation infographics sample. This is a one stage process. The stages in this process are speed, meter, business, marketing, equipment.

Dashboard Ppt PowerPoint Presentation Gallery Layouts
This is a dashboard ppt powerpoint presentation gallery layouts. This is a two stage process. The stages in this process are speed, meter, business, marketing, equipment.

Dashboard Ppt PowerPoint Presentation Summary Example Topics
This is a dashboard ppt powerpoint presentation summary example topics. This is a one stage process. The stages in this process are speed, meter, business, marketing, equipment.

Dashboard Ppt PowerPoint Presentation Gallery Guidelines
This is a dashboard ppt powerpoint presentation gallery guidelines. This is a three stage process. The stages in this process are low, medium, high.
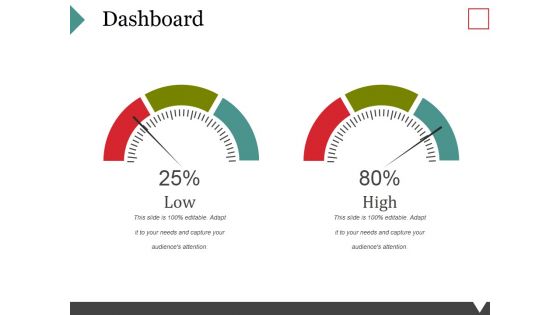
Dashboard Ppt PowerPoint Presentation Pictures Outfit
This is a dashboard ppt powerpoint presentation pictures outfit. This is a two stage process. The stages in this process are speed, meter, business, marketing, equipment.

Dashboard Ppt PowerPoint Presentation File Background
This is a dashboard ppt powerpoint presentation file background. This is a three stage process. The stages in this process are speed, meter, business, marketing, equipment.

Marketing Dashboard Ppt PowerPoint Presentation Templates
This is a marketing dashboard ppt powerpoint presentation templates. This is a two stage process. The stages in this process are business, marketing, management, finance, dashboard.

Revenue Dashboard Ppt PowerPoint Presentation Sample
This is a revenue dashboard ppt powerpoint presentation sample. This is a five stage process. The stages in this process are trends of sales cycle times, industries contribution, revenue trends, deal drop off by stage.
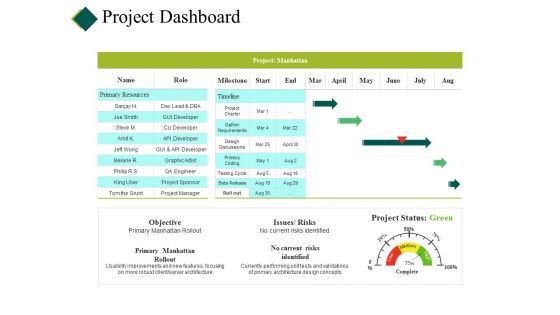
Project Dashboard Ppt PowerPoint Presentation Pictures Backgrounds
This is a project dashboard ppt powerpoint presentation pictures backgrounds. This is a four stage process. The stages in this process are cost, planning, table, project report, data management.

Sales Performance Dashboard Ppt PowerPoint Presentation Show
This is a sales performance dashboard ppt powerpoint presentation show. This is a four stage process. The stages in this process are lead sources revenue share, total sales by month, opportunities total sales by probability, win loss ratio.
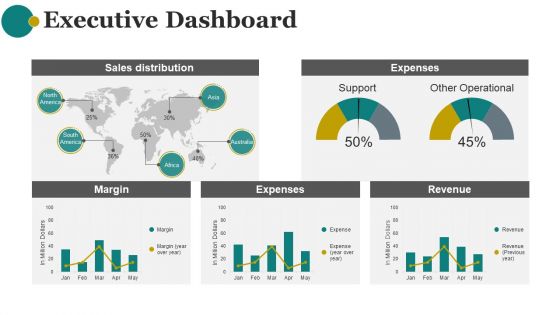
Executive Dashboard Ppt PowerPoint Presentation Graphics
This is a executive dashboard ppt powerpoint presentation graphics. This is a five stage process. The stages in this process are sales distribution, expenses, margin, expenses, revenue.

Dashboard Ppt PowerPoint Presentation Infographic Template Mockup
This is a dashboard ppt powerpoint presentation infographic template mockup. This is a three stage process. The stages in this process are dashboard, business, finance, marketing, management.

Executive Dashboard Ppt PowerPoint Presentation Introduction
This is a executive dashboard ppt powerpoint presentation introduction. This is a five stage process. The stages in this process are sales distribution, support expenses, other operational, margin, expenses.

Crm Marketing Dashboard Ppt PowerPoint Presentation Designs
This is a crm marketing dashboard ppt powerpoint presentation designs. This is a two stage process. The stages in this process are leads per week, leads this week target.
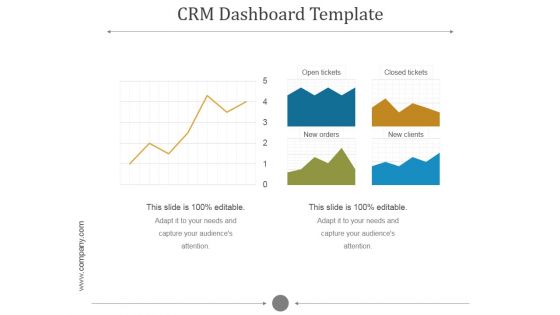
Crm Dashboard Template Ppt PowerPoint Presentation Designs
This is a crm dashboard template ppt powerpoint presentation designs. This is a five stage process. The stages in this process are open tickets, closed tickets, new orders, new clients.
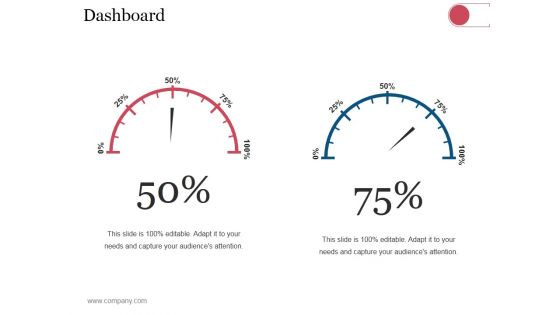
Dashboard Ppt PowerPoint Presentation Outline Grid
This is a dashboard ppt powerpoint presentation outline grid. This is a two stage process. The stages in this process are business, strategy, analysis, planning, dashboard, finance.

Dashboard Ppt PowerPoint Presentation Layouts Graphics Pictures
This is a dashboard ppt powerpoint presentation layouts graphics pictures. This is a three stage process. The stages in this process are business, strategy, analysis, planning, dashboard.
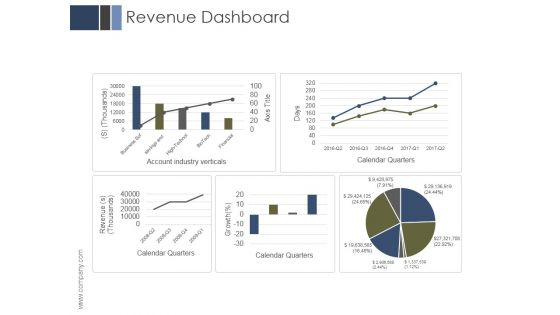
Revenue Dashboard Ppt PowerPoint Presentation Files
This is a revenue dashboard ppt powerpoint presentation files. This is a five stage process. The stages in this process are business, marketing, management, revenue, dashboard.
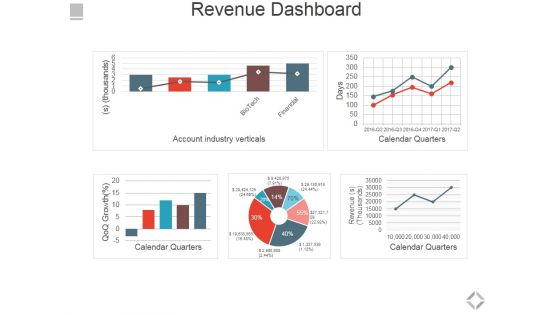
Revenue Dashboard Ppt PowerPoint Presentation Summary Brochure
This is a revenue dashboard ppt powerpoint presentation summary brochure. This is a five stage process. The stages in this process are account industry verticals, calendar quarters.

Crm Dashboard Kpis Ppt PowerPoint Presentation Rules
This is a crm dashboard kpis ppt powerpoint presentation rules. This is a three stage process. The stages in this process are revenue, acquisition, active subscribers.
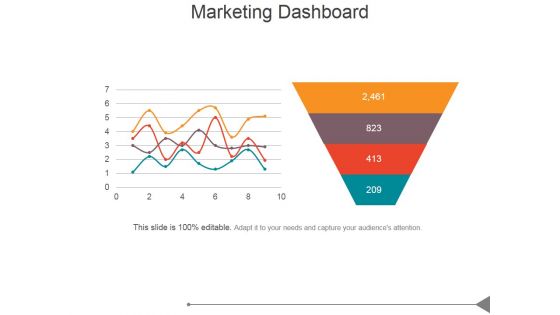
Marketing Dashboard Ppt PowerPoint Presentation Slide
This is a marketing dashboard ppt powerpoint presentation slide. This is a four stage process. The stages in this process are funnel, marketing, process, business, management.
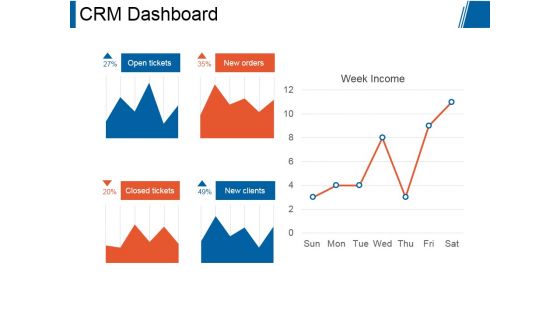
Crm Dashboard Ppt PowerPoint Presentation Good
This is a crm dashboard ppt powerpoint presentation good. This is a five stage process. The stages in this process are open tickets, new orders, closed tickets, new clients, week income.
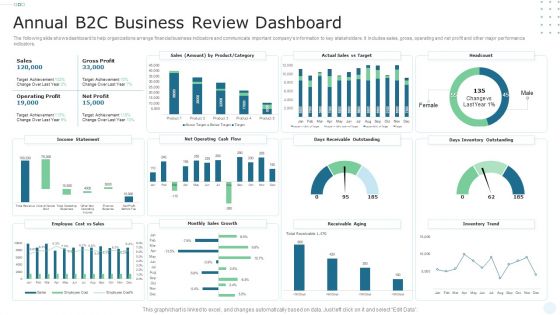
Annual B2C Business Review Dashboard Microsoft PDF
The following slide shows dashboard to help organizations arrange financial business indicators and communicate important companys information to key stakeholders. It includes sales, gross, operating and net profit and other major performance indicators. Showcasing this set of slides titled Annual B2C Business Review Dashboard Microsoft PDF. The topics addressed in these templates are Gross Profit, Sales, Operating Profit. All the content presented in this PPT design is completely editable. Download it and make adjustments in color, background, font etc. as per your unique business setting.
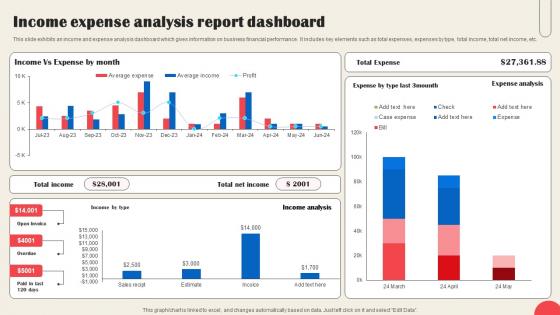
Income Expense Analysis Report Dashboard Sample Pdf
This slide exhibits an income and expense analysis dashboard which gives information on business financial performance. It includes key elements such as total expenses, expenses by type, total income, total net income, etc. Pitch your topic with ease and precision using this Income Expense Analysis Report Dashboard Sample Pdf This layout presents information on Income Expense, Analysis Report Dashboard It is also available for immediate download and adjustment. So, changes can be made in the color, design, graphics or any other component to create a unique layout.

Dashboard Ppt PowerPoint Presentation Example 2015
This is a dashboard ppt powerpoint presentation example 2015. This is a four stage process. The stages in this process are business, marketing, management, analysis, dashboard.
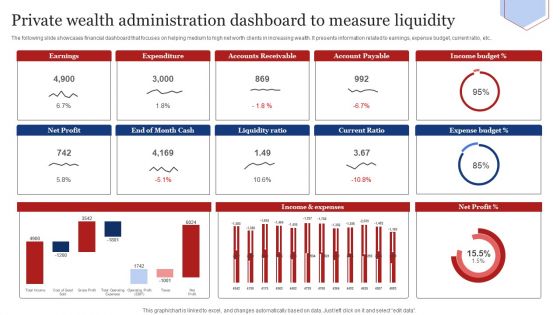
Private Wealth Administration Dashboard To Measure Liquidity Infographics PDF
The following slide showcases financial dashboard that focuses on helping medium to high net worth clients in increasing wealth. It presents information related to earnings, expense budget, current ratio, etc. Showcasing this set of slides titled Private Wealth Administration Dashboard To Measure Liquidity Infographics PDF. The topics addressed in these templates are Liquidity Ratio, Current Ratio, Expense Budget. All the content presented in this PPT design is completely editable. Download it and make adjustments in color, background, font etc. as per your unique business setting.

Financial Projections P And L Template 1 Ppt PowerPoint Presentation Portfolio Layouts
This is a financial projections p and l template 1 ppt powerpoint presentation portfolio layouts. This is a three stage process. The stages in this process are financial, marketing, investment, analysis, business.
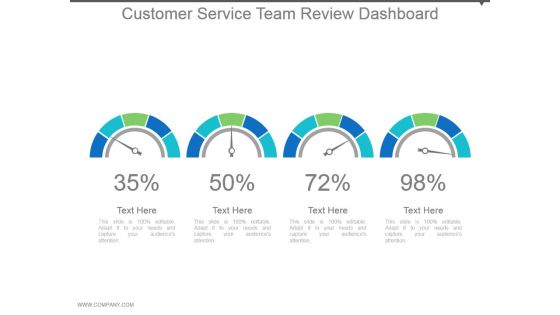
Customer Service Team Review Dashboard Powerpoint Slide Rules
This is a customer service team review dashboard powerpoint slide rules. This is a four stage process. The stages in this process are dashboard, meter, financials, speed, measure.

Project Metrics Dashboard And Reports Portrait PDF
This slide covers the project management dashboard which focuses on project financials with business objective, project costs, status, approved budget, forecasting, data variance, capital expenditure on new product development, comparison of total cost with actual budget, etc. Showcasing this set of slides titled Project Metrics Dashboard And Reports Portrait PDF. The topics addressed in these templates are Budget, Portfolio, Investment. All the content presented in this PPT design is completely editable. Download it and make adjustments in color, background, font etc. as per your unique business setting.

Dashboard For Managing Warehouse Operations Diagrams PDF
This slide showcases dashboard that can help organization to manage and track the warehouse operations. Its key elements are order, volume, inventory, monthly KPIs and global financial performance. Presenting this PowerPoint presentation, titled Dashboard For Managing Warehouse Operations Diagrams PDF, with topics curated by our researchers after extensive research. This editable presentation is available for immediate download and provides attractive features when used. Download now and captivate your audience. Presenting this Dashboard For Managing Warehouse Operations Diagrams PDF. Our researchers have carefully researched and created these slides with all aspects taken into consideration. This is a completely customizable Dashboard For Managing Warehouse Operations Diagrams PDF that is available for immediate downloading. Download now and make an impact on your audience. Highlight the attractive features available with our PPTs.
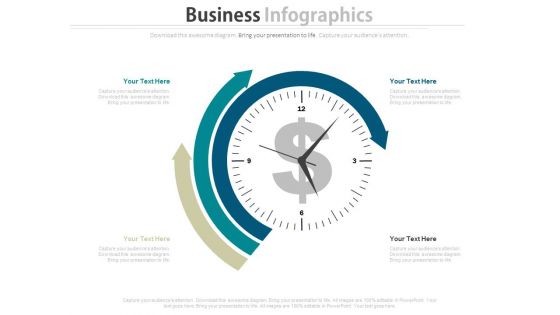
Dashboard Diagram For Finance And Strategic Analysis Powerpoint Slides
This PowerPoint template display graphics of clock with arrows around it and dollar symbol in center. You may use this PPT slide for financial and strategic analysis. This dashboard slide may useful for multilevel status report creation and approval process.

Dashboard Of Corporate Bank For Cash Flow Analysis Template PDF
This slide shows the corporate financial institution dashboard for cash flow analysis which assist in better accounting and finance Showcasing this set of slides titled Dashboard Of Corporate Bank For Cash Flow Analysis Template PDF. The topics addressed in these templates are Takeaways, Accounts Payable, Accounts Receivable. All the content presented in this PPT design is completely editable. Download it and make adjustments in color, background, font etc. as per your unique business setting.
Modifying Banking Functionalities Dashboard Tracking Customer Satisfaction Score Infographics PDF
This slide contains dashboard that depicts the overall customer satisfaction into quantitative form. Deliver an awe inspiring pitch with this creative enhancing financial institution operations dashboard tracking customer satisfaction score icons pdf bundle. Topics like dashboard tracking customer satisfaction score can be discussed with this completely editable template. It is available for immediate download depending on the needs and requirements of the user.

Clear Point Strategy Dashboard Ppt Presentation
This is a clear point strategy dashboard ppt presentation. This is a four stage process. The stages in this process are financial perspective, internal processes perspective, learning and growth perspective, customer perspective.
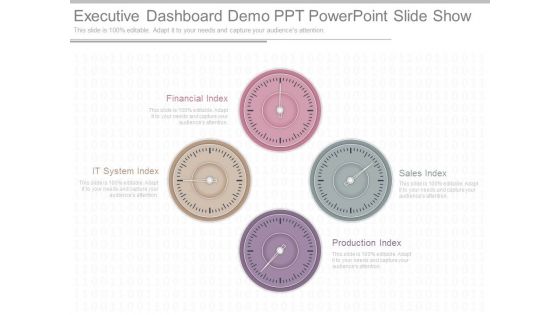
Executive Dashboard Demo Ppt Powerpoint Slide Show
This is a executive dashboard demo ppt powerpoint slide show. This is a four stage process. The stages in this process are financial index, it system index, production index, sales index.

Successful Corporate Technique Enhancing Firms Performance Corporate Financial Performance Diagrams PDF
This slide provides information regarding dashboard utilized by firm to monitor financial performance. The performance is tracked through revenues generated, vendors associated, profit generated, etc. Find a pre designed and impeccable Successful Corporate Technique Enhancing Firms Performance Corporate Financial Performance Diagrams PDF. The templates can ace your presentation without additional effort. You can download these easy to edit presentation templates to make your presentation stand out from others. So, what are you waiting for Download the template from Slidegeeks today and give a unique touch to your presentation.
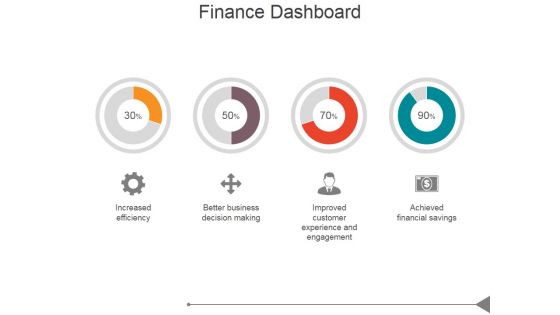
Finance Dashboard Ppt PowerPoint Presentation Diagrams
This is a finance dashboard ppt powerpoint presentation diagrams. This is a four stage process. The stages in this process are increased efficiency, better business decision making, improved customer experience and engagement, achieved financial savings.

Salesforce Dashboard Ppt PowerPoint Presentation Summary
This is a salesforce dashboard ppt powerpoint presentation summary. This is a two stage process. The stages in this process are business, marketing, dashboard, graph, speedometer.

Dashboard Ppt PowerPoint Presentation Infographics Images
This is a dashboard ppt powerpoint presentation infographics images. This is a two stage process. The stages in this process are low, medium, high, dashboard, measurement.
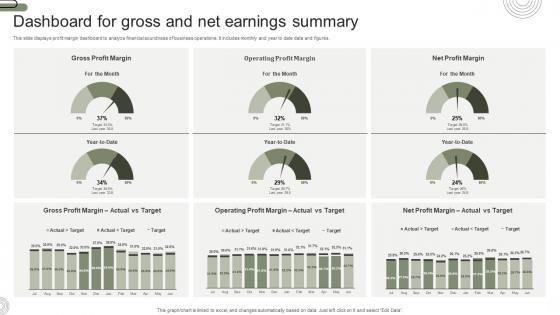
Dashboard For Gross And Net Earnings Summary Designs Pdf
This slide displays profit margin dashboard to analyze financial soundness of business operations. It includes monthly and year to date data and figures. Showcasing this set of slides titled Dashboard For Gross And Net Earnings Summary Designs Pdf. The topics addressed in these templates are Dashboard For Gross, Net Earnings Summary, Financial Soundness. All the content presented in this PPT design is completely editable. Download it and make adjustments in color, background, font etc. as per your unique business setting.
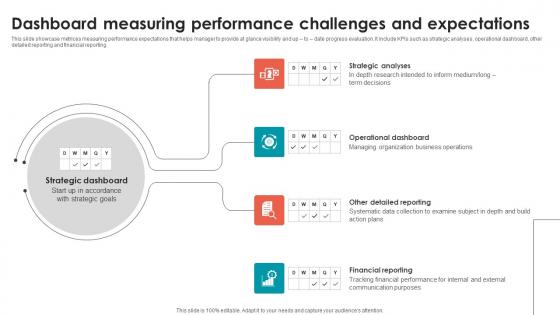
Dashboard Measuring Performance Challenges And Expectations Portrait Pdf
This slide showcase metrices measuring performance expectations that helps manager to provide at glance visibility and up to date progress evaluation. It include KPIs such as strategic analyses, operational dashboard, other detailed reporting and financial reporting. Showcasing this set of slides titled Dashboard Measuring Performance Challenges And Expectations Portrait Pdf. The topics addressed in these templates are Operational Dashboard, Strategic Analyses, Financial Reporting. All the content presented in this PPT design is completely editable. Download it and make adjustments in color, background, font etc. as per your unique business setting.
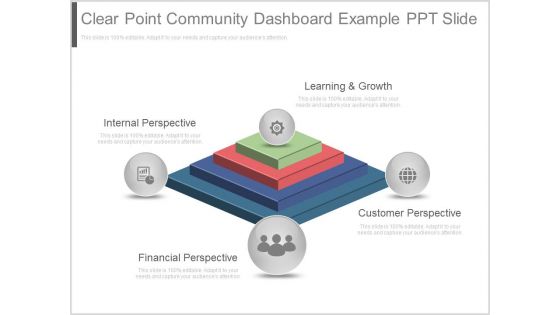
Clear Point Community Dashboard Example Ppt Slide
This is a clear point community dashboard example ppt slide. This is a four stage process. The stages in this process are internal perspective, learning and growth, financial perspective, customer perspective.
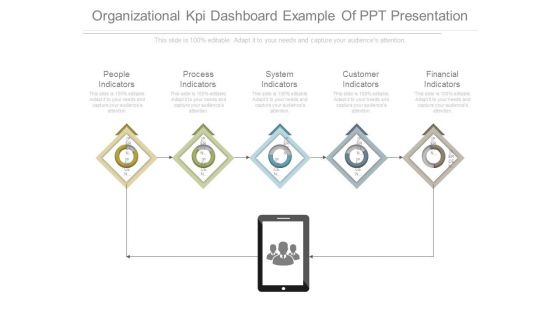
Organizational Kpi Dashboard Example Of Ppt Presentation
This is a organizational kpi dashboard example of ppt presentation. This is a five stage process. The stages in this process are people indicators, process indicators, system indicators, customer indicators, financial indicators.

 Home
Home