AI PPT Maker
Templates
PPT Bundles
Design Services
Business PPTs
Business Plan
Management
Strategy
Introduction PPT
Roadmap
Self Introduction
Timelines
Process
Marketing
Agenda
Technology
Medical
Startup Business Plan
Cyber Security
Dashboards
SWOT
Proposals
Education
Pitch Deck
Digital Marketing
KPIs
Project Management
Product Management
Artificial Intelligence
Target Market
Communication
Supply Chain
Google Slides
Research Services
 One Pagers
All Categories
-
Home
- Customer Favorites
- Financial Dashboard
Financial Dashboard
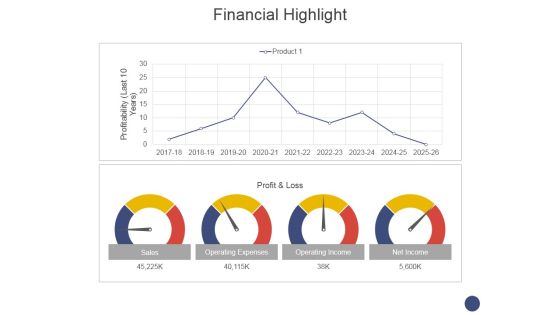
Financial Highlight Template 1 Ppt PowerPoint Presentation Model Deck
This is a financial highlight template 1 ppt powerpoint presentation model deck. This is a two stage process. The stages in this process are sales, operating expenses, operating income, net income.

Proactive Consumer Solution And How To Perform It Kpis For Financial Service Delivery Designs PDF
This slide represents the KPIs for financial service delivery and how machine learning and AI can help to foresee the processes, insights that can benefit the financial sector.Deliver an awe inspiring pitch with this creative Proactive Consumer Solution And How To Perform It Kpis For Financial Service Delivery Designs PDF bundle. Topics like Financial Dashboard, Machine Learning, Portfolio Composition can be discussed with this completely editable template. It is available for immediate download depending on the needs and requirements of the user.

Crisis Management Program Presentation Financial Performance Tracking Slides PDF
This slide presents the dashboard which will help firm in tracking the fiscal performance. This dashboard displays number of customers, vendors and revenues generated, expenses and profit incurred. Deliver and pitch your topic in the best possible manner with this crisis management program presentation financial performance tracking slides pdf. Use them to share invaluable insights on revenue, expense, profit, customer, financial performance tracking and impress your audience. This template can be altered and modified as per your expectations. So, grab it now.
Mitigating Cybersecurity Threats And Vulnerabilities Financial Performance Tracking Designs PDF
This slide presents the dashboard which will help firm in tracking the fiscal performance. This dashboard displays revenues and expenses trends and payment received analysis. Deliver and pitch your topic in the best possible manner with this mitigating cybersecurity threats and vulnerabilities financial performance tracking designs pdf. Use them to share invaluable insights on receivables analysis, revenue and expense trends and impress your audience. This template can be altered and modified as per your expectations. So, grab it now.
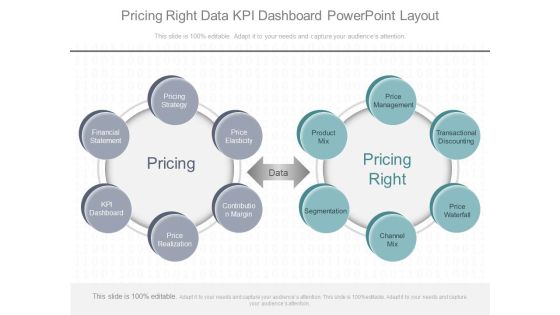
Pricing Right Data Kpi Dashboard Powerpoint Layout
This is a pricing right data kpi dashboard powerpoint layout. This is a two stage process. The stages in this process are price management, transactional discounting, price waterfall, channel mix, segmentation, product mix, price elasticity, contribution margin, price realization, kpi dashboard, financial statement, pricing, data, pricing right.

Organizational Program To Improve Team Productivity And Efficiency Company Financial Pictures PDF
This slide highlights KPI dashboard exhibiting overall improvement in the financial performance of company as the consequences of program implementation. Deliver an awe inspiring pitch with this creative organizational program to improve team productivity and efficiency company financial pictures pdf bundle. Topics like company financial performance dashboard can be discussed with this completely editable template. It is available for immediate download depending on the needs and requirements of the user.

Dashboard Ppt PowerPoint Presentation Inspiration Icons
This is a dashboard ppt powerpoint presentation inspiration icons. This is a four stage process. The stages in this process are business, marketing, finance, planning, analysis.

Key Evolutions In Financial Technology Industry Ideas PDF
This slide presents key industry trends dashboard for fintech helpful in leveraging technology to streamline operations of various financial processes. It includes insights on fintech adoption rates, top fintech technologies used and countrywide distribution of fintech using customers. Showcasing this set of slides titled Key Evolutions In Financial Technology Industry Ideas PDF. The topics addressed in these templates are Key Evolutions, Financial Technology Industry. All the content presented in this PPT design is completely editable. Download it and make adjustments in color, background, font etc. as per your unique business setting.
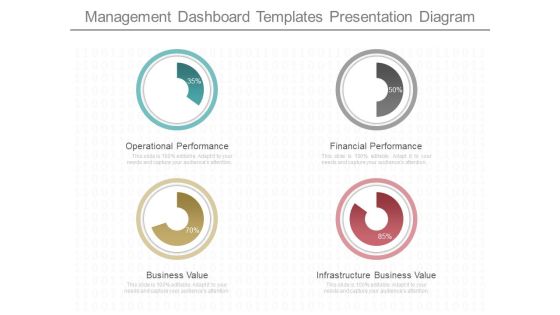
Management Dashboard Templates Presentation Diagram
This is a management dashboard templates presentation diagram. This is a four stage process. The stages in this process are operational performance, business value, financial performance, infrastructure business value.
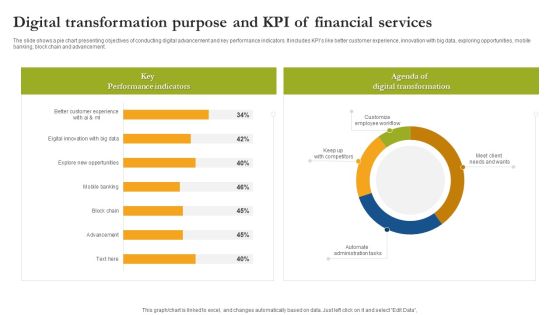
Digital Transformation Purpose And Kpi Of Financial Services Guidelines PDF
The slide shows a pie chart presenting objectives of conducting digital advancement and key performance indicators. It includes KPIs like better customer experience, innovation with big data, exploring opportunities, mobile banking, block chain and advancement. Showcasing this set of slides titled Digital Transformation Purpose And Kpi Of Financial Services Guidelines PDF. The topics addressed in these templates are Key Performance Indicators Digital Transformation, Customize Employee Workflow. All the content presented in this PPT design is completely editable. Download it and make adjustments in color, background, font etc. as per your unique business setting.
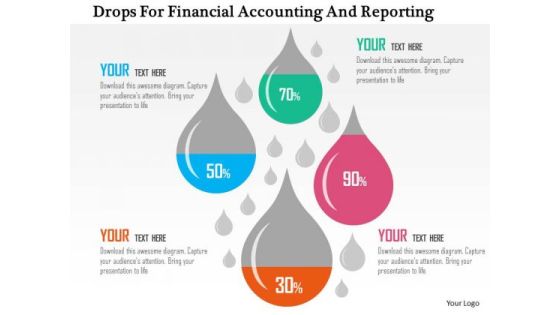
Business Diagram Drops For Financial Accounting And Reporting Presentation Template
This business diagram has been designed with drops displaying financial ratios. Download this diagram to depict financial and accounting ratios. Use this slide to build quality presentations for your viewers.

Business Framework Model Digital Illustration Of Financial Reports Marketing Diagram
Get Out Of The Dock With Our Business Framework Model Digital Illustration Of Financial Reports Marketing Diagram Powerpoint Templates. Your Mind Will Be Set Free.

Financial Performance Analysis Data Ppt PowerPoint Presentation Topics
This is a financial performance analysis data ppt powerpoint presentation topics. This is a three stage process. The stages in this process are finance, percentage, marketing, business, growth.
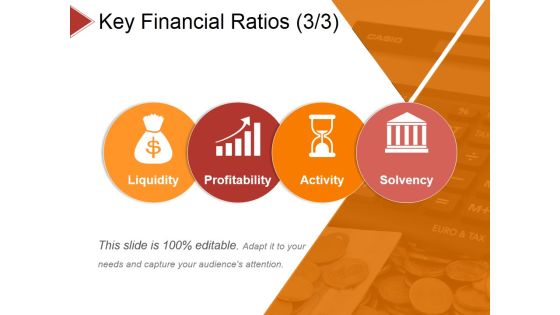
Key Financial Ratios Template 3 Ppt PowerPoint Presentation Summary Sample
This is a key financial ratios template 3 ppt powerpoint presentation summary sample. This is a four stage process. The stages in this process are liquidity, profitability, activity, solvency.
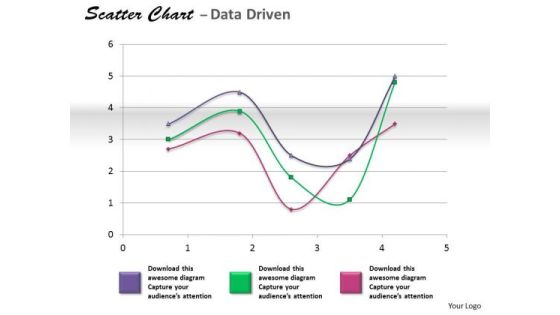
Financial Data Analysis Coordinate With Scatter Chart PowerPoint Templates
Get The Doers Into Action. Activate Them With Our financial data analysis coordinate with scatter chart Powerpoint Templates .

Bar Graph For Financial Statements Ppt PowerPoint Presentation Example
This is a bar graph for financial statements ppt powerpoint presentation example. This is a four stage process. The stages in this process are product version, finance, year.

Risk Metrics Dashboard And Mitigation Expenditure Dashboard Ideas PDF
This slide illustrates facts and figures of expenditure incurred on different risks. It includes financial risk, operational risks and competition risks. Pitch your topic with ease and precision using this Risk Metrics Dashboard And Mitigation Expenditure Dashboard Ideas PDF. This layout presents information on Management, Expenditure, Risk. It is also available for immediate download and adjustment. So, changes can be made in the color, design, graphics or any other component to create a unique layout.

Quantitative Data Analysis Bar Chart For Financial Markets PowerPoint Templates
Draft It Out On Our quantitative data analysis bar chart for financial markets Powerpoint Templates . Give The Final Touches With Your Ideas.

Crm Dashboard Intranet Dashboard Ppt PowerPoint Presentation Sample
This is a crm dashboard intranet dashboard ppt powerpoint presentation sample. This is a four stage process. The stages in this process are page views, events count, country, page views.

Crm Dashboard Intranet Dashboard Ppt PowerPoint Presentation Ideas Images
This is a crm dashboard intranet dashboard ppt powerpoint presentation ideas images. This is a four stage process. The stages in this process are page views, country, page views, events count.

Financial Data Analysis Area Chart For Showing Trends PowerPoint Templates
Document Your Views On Our financial data analysis area chart for showing trends Powerpoint Templates . They Will Create A Strong Impression.
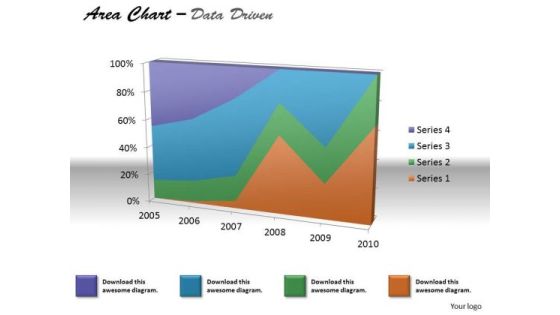
Financial Data Analysis Area Chart For Various Values PowerPoint Templates
Document The Process On Our financial data analysis area chart for various values Powerpoint Templates . Make A Record Of Every Detail.
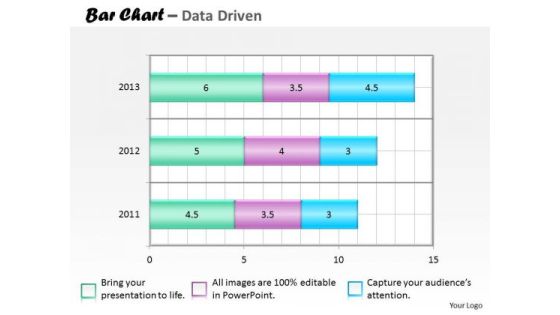
Financial Data Analysis Bar Chart For Collection Of PowerPoint Templates
Our financial data analysis bar chart for collection of Powerpoint Templates Team Are A Dogged Lot. They Keep At It Till They Get It Right.

Financial Data Analysis Currency Trading Bar Chart PowerPoint Templates
Put In A Dollop Of Our financial data analysis currency trading bar chart Powerpoint Templates . Give Your Thoughts A Distinctive Flavor.

Dashboard Program Ppt Presentation Powerpoint
This is a dashboard program ppt presentation powerpoint. This is a six stage process. The stages in this process are tasks, progress, matrix, resource, utilization, time, safety, progress, sales rate.

Budget And Financial Snapshot Ppt PowerPoint Presentation Example
This is a budget and financial snapshot ppt powerpoint presentation example. This is a two stage process. The stages in this process are sales, operating income, net income.

WMS Implementation Warehouse Management Dashboard Rules PDF
The slide demonstrates information regarding the warehouse management dashboard in order to track key activities. Deliver an awe-inspiring pitch with this creative wms implementation warehouse management dashboard rules pdf bundle. Topics like warehouse management dashboard, global financial performances, inventory can be discussed with this completely editable template. It is available for immediate download depending on the needs and requirements of the user.
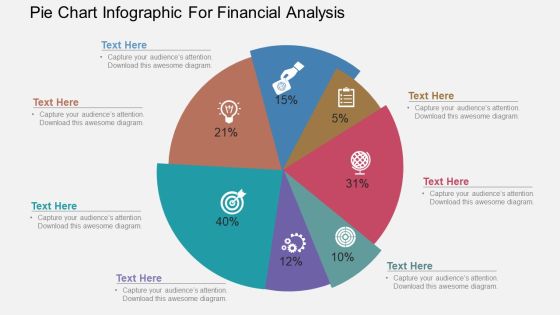
Pie Chart Infographic For Financial Analysis Powerpoint Template
Our above PowerPoint template has been designed with pie chart infographic. This slide is suitable to present financial analysis. Use this business diagram to present your work in a more smart and precise manner.

Crm Dashboard Sales Dashboard Template Ppt PowerPoint Presentation Inspiration
This is a crm dashboard sales dashboard template ppt powerpoint presentation inspiration. This is a five stage process. The stages in this process are sales by product march, lead owner breakdown, total lead ownership, month over month closing trend.

Financial Performance Ppt PowerPoint Presentation Gallery Infographic Template
This is a financial performance ppt powerpoint presentation gallery infographic template. This is a five stage process. The stages in this process are business, financial projections, key financial ratios, cash flow statement, income statement, balance sheet.
Financial Statements Reporting Ppt Powerpoint Presentation Summary Elements Cpb
This is a financial statements reporting ppt powerpoint presentation summary elements cpb. This is a three stage process. The stages in this process are financial statements reporting.

Reporting Dashboard Ppt Presentation Powerpoint
This is a reporting dashboard ppt presentation powerpoint. This is a four stage process. The stages in this process are dashboard, visual analysis tools, scorecards, reports.
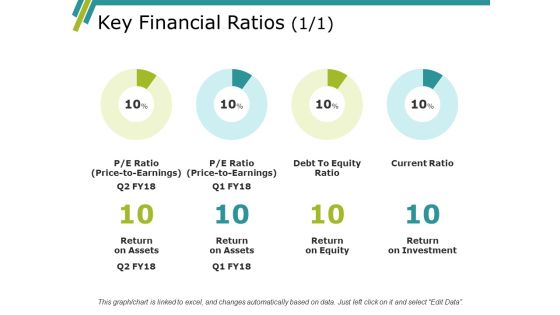
Key Financial Ratios Ppt PowerPoint Presentation Model Elements
This is a key financial ratios ppt powerpoint presentation model elements. This is a four stage process. The stages in this process are return on assets, return on equity, return on investment.
Business Framework Model Financial Report Analysis Diagram Marketing Diagram
Put In A Dollop Of Our Business Framework Model Financial Report Analysis Diagram Marketing Diagram Powerpoint Templates. Give Your Thoughts A Distinctive Flavor. Create Your Domain With Our Business Framework Model Financial Report Analysis Diagram Marketing Diagram Powerpoint Templates. Rule Minds With Your Thoughts.

Pie Charts For Financial Ratio Analysis Powerpoint Slides
This PowerPoint template has been designed with diagram of pie charts. This PPT slide can be used to prepare presentations for profit growth report and also for financial data analysis. You can download finance PowerPoint template to prepare awesome presentations.

Business Intelligence Financial Reporting Ppt PowerPoint Presentation Layouts Model
This is a business intelligence financial reporting ppt powerpoint presentation layouts model. This is a four stage process. The stages in this process are business analytics, ba, organizations data.
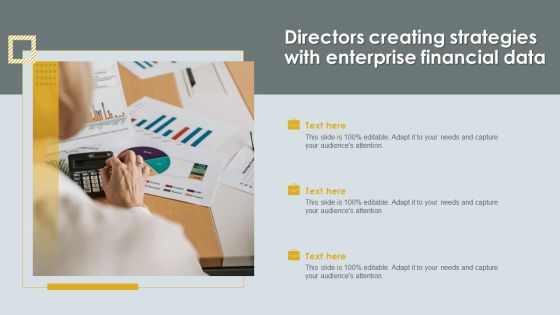
Directors Creating Strategies With Enterprise Financial Data Slides PDF
Presenting Directors Creating Strategies With Enterprise Financial Data Slides PDF to dispense important information. This template comprises Three stages. It also presents valuable insights into the topics including Directors Creating Strategies, Enterprise Financial Data. This is a completely customizable PowerPoint theme that can be put to use immediately. So, download it and address the topic impactfully.
Latest Facts About Data In Financial Services Icon Professional PDF
Pitch your topic with ease and precision using this Latest Facts About Data In Financial Services Icon Professional PDF. This layout presents information on Latest Facts About Data, Financial Services. It is also available for immediate download and adjustment. So, changes can be made in the color, design, graphics or any other component to create a unique layout.
Key Financial Ratios Template 2 Ppt PowerPoint Presentation Icon Professional
This is a key financial ratios template 2 ppt powerpoint presentation icon professional. This is a four stage process. The stages in this process are business, marketing, analysis, finance, search.

Financial Data Analytics Ppt Powerpoint Presentation Show Smartart Cpb
This is a financial data analytics ppt powerpoint presentation show smartart cpb. This is a four stage process. The stages in this process are financial data analytics.
Statistical Data Graph Icon Showing Financial Forecast Rules PDF
Presenting statistical data graph icon showing financial forecast rules pdf to dispense important information. This template comprises four stages. It also presents valuable insights into the topics including statistical data graph icon showing financial forecast. This is a completely customizable PowerPoint theme that can be put to use immediately. So, download it and address the topic impactfully.

Plan Financial Data Governance Icon Ppt Visual Aids PDF
Presenting Plan Financial Data Governance Icon Ppt Visual Aids PDF to dispense important information. This template comprises four stages. It also presents valuable insights into the topics including Plan Financial, Data Governance, Icon. This is a completely customizable PowerPoint theme that can be put to use immediately. So, download it and address the topic impactfully.
Test Tubes With Financial Data In Percentage Ratio Powerpoint Slides
This PowerPoint template contains graphics of test tubes with percentage values. You may download this PPT slide design to display financial ratio analysis. You can easily customize this template to make it more unique as per your need.
Financial Marketing Trends Ppt Powerpoint Presentation Gallery Microsoft Cpb
This is a financial marketing trends ppt powerpoint presentation gallery microsoft cpb. This is a four stage process. The stages in this process are financial marketing trends.

Business Overview PPT Slides Financial Snapshot Ppt Background PDF
Presenting business overview ppt slides financial snapshot ppt background pdf to provide visual cues and insights. Share and navigate important information on three stages that need your due attention. This template can be used to pitch topics like sales, operating income, net income. In addtion, this PPT design contains high resolution images, graphics, etc, that are easily editable and available for immediate download.
Financial Performance Metrics Ppt PowerPoint Presentation Infographic Template Influencers Cpb
This is a financial performance metrics ppt powerpoint presentation infographic template influencers cpb. This is a three stage process. The stages in this process are financial performance metrics.

Financial Projections And Key Metrics Ppt PowerPoint Presentation Samples
This is a financial projections and key metrics ppt powerpoint presentation samples. This is a five stage process. The stages in this process are of customers, year, of employees, sales, expenses.
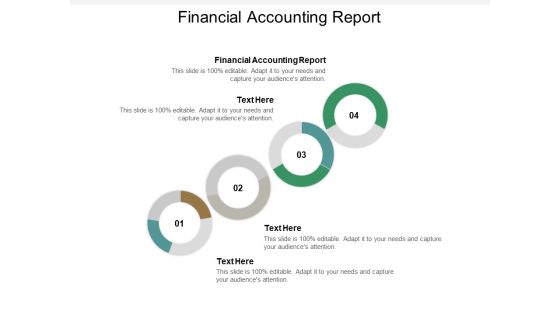
Financial Accounting Report Ppt PowerPoint Presentation Layouts Outfit Cpb
This is a financial accounting report ppt powerpoint presentation layouts outfit cpb. This is a four stage process. The stages in this process are financial accounting report.
Financial Reporting Analysis Ppt PowerPoint Presentation Icon Graphics Design Cpb
This is a financial reporting analysis ppt powerpoint presentation icon graphics design cpb. This is a seven stage process. The stages in this process are financial reporting analysis.

Financial Statement Reporting Ppt PowerPoint Presentation Pictures Themes Cpb
This is a financial statement reporting ppt powerpoint presentation pictures themes cpb. This is a three stage process. The stages in this process are financial statement reporting.
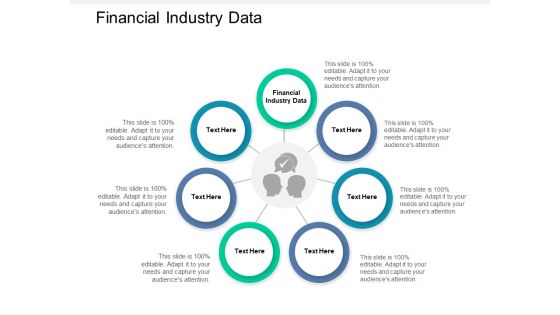
Financial Industry Data Ppt PowerPoint Presentation Outline Samples
This is a financial industry data ppt powerpoint presentation outline samples. This is a seven stage process. The stages in this process are financial industry data.

Protect Financial Data Online Ppt PowerPoint Presentation Ideas Graphics
This is a protect financial data online ppt powerpoint presentation ideas graphics. This is a five stage process. The stages in this process are protect financial data online.
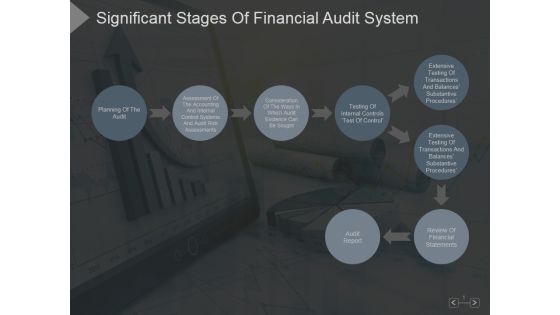
Significant Stages Of Financial Audit System Ppt PowerPoint Presentation Backgrounds
This is a significant stages of financial audit system ppt powerpoint presentation backgrounds. This is a eight stage process. The stages in this process are planning of the audit, audit report, review of financial statements, testing of internal controls.

Company Outline Financial Snapshot Ppt Styles Grid PDF
This is a company outline financial snapshot ppt styles grid pdf template with various stages. Focus and dispense information on three stages using this creative set, that comes with editable features. It contains large content boxes to add your information on topics like sales, operating income, net income. You can also showcase facts, figures, and other relevant content using this PPT layout. Grab it now.
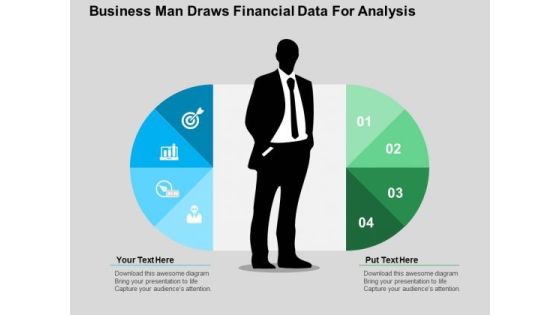
Business Man Draws Financial Data For Analysis PowerPoint Templates
This PowerPoint slide has a theme for financial data analysis. This image has been designed to display concept of financial planning and analysis. Deliver amazing presentations to mesmerize your audience using this image
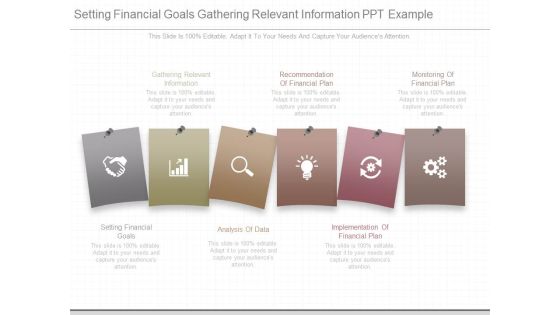
Setting Financial Goals Gathering Relevant Information Ppt Example
This is a setting financial goals gathering relevant information ppt example. This is a six stage process. The stages in this process are implementation of financial plan, analysis of data, gathering relevant information, recommendation of financial plan, monitoring of financial plan.

Financial Report Business PowerPoint Templates And PowerPoint Backgrounds 0511
Microsoft PowerPoint Template and Background with arrow pointing to the higher financial chart bar

Financial Report Business PowerPoint Themes And PowerPoint Slides 0511
Microsoft PowerPoint Slide and Theme with arrow pointing to the higher financial chart bar

Business Management Dashboard Powerpoint Graphics
This is a business management dashboard powerpoint graphics. This is a four stage process. The stages in this process are property system, crm system, asset system, finance system.

Dashboard Analytics Diagram Powerpoint Guide
This is a dashboard analytics diagram powerpoint guide. This is a three stage process. The stages in this process are value, analytic, reporting.
