AI PPT Maker
Templates
PPT Bundles
Design Services
Business PPTs
Business Plan
Management
Strategy
Introduction PPT
Roadmap
Self Introduction
Timelines
Process
Marketing
Agenda
Technology
Medical
Startup Business Plan
Cyber Security
Dashboards
SWOT
Proposals
Education
Pitch Deck
Digital Marketing
KPIs
Project Management
Product Management
Artificial Intelligence
Target Market
Communication
Supply Chain
Google Slides
Research Services
 One Pagers
All Categories
-
Home
- Customer Favorites
- Financial Dashboard
Financial Dashboard

data collection and analysis flow chart ppt powerpoint presentation microsoft
This is a data collection and analysis flow chart ppt powerpoint presentation microsoft. This is a nine stage process. The stages in this process are business, planning, marketing, strategy, management.

Monthly Traffic Source Overview Ppt PowerPoint Presentation Layouts Show
This is a monthly traffic source overview ppt powerpoint presentation layouts show. This is a three stage process. The stages in this process are google, vine press net, yahoo, bing, sources.

Big Data Opportunities And Challenges In Construction Ppt PowerPoint Presentation Outline
This is a big data opportunities and challenges in construction ppt powerpoint presentation outline. This is a three stage process. The stages in this process are finance, management, growth, percentage, business.
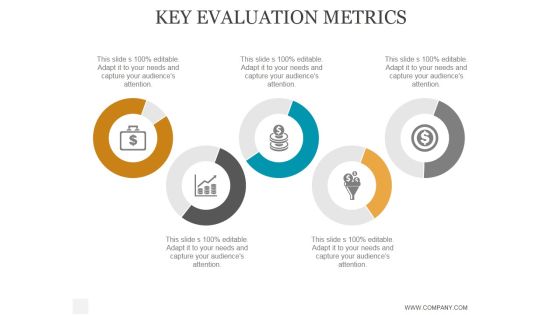
Key Evaluation Metrics Ppt PowerPoint Presentation Portfolio
This is a key evaluation metrics ppt powerpoint presentation portfolio. This is a five stage process. The stages in this process are business, strategy, marketing, analysis, success, icons.

Key Metrics Ppt PowerPoint Presentation Rules
This is a key metrics ppt powerpoint presentation rules. This is a four stage process. The stages in this process are business, strategy, marketing, success, analysis, finance.

Key Evaluation Metrics Ppt PowerPoint Presentation Example File
This is a key evaluation metrics ppt powerpoint presentation example file. This is a five stage process. The stages in this process are business, strategy, marketing, analysis, finance.
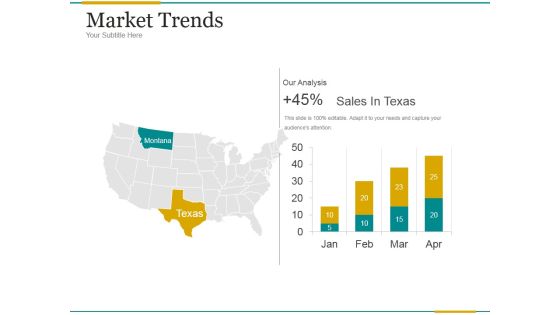
Market Trends Ppt PowerPoint Presentation Samples
This is a market trends ppt powerpoint presentation samples. This is a two stage process. The stages in this process are montana, our analysis, sales in texas.

Pandl Kpis Tabular Form Ppt PowerPoint Presentation Visual Aids
This is a pandl kpis tabular form ppt powerpoint presentation visual aids. This is a four stage process. The stages in this process are revenue, cogs, operating profit, net profit.

Cash Flow Statement Kpis Ppt PowerPoint Presentation Deck
This is a cash flow statement kpis ppt powerpoint presentation deck. This is a four stage process. The stages in this process are operations, financing activities, investing activities, net increase in cash.

Balance Sheet Kpis Tabular Form Ppt PowerPoint Presentation Professional Display
This is a balance sheet kpis tabular form ppt powerpoint presentation professional display. This is a four stage process. The stages in this process are current assets, current liabilities, total assets, total liabilities.

Budget Report Ppt PowerPoint Presentation Outline Examples
This is a budget report ppt powerpoint presentation outline examples. This is a five stage process. The stages in this process are project, amount, expenses, future scheduled, remaining.

Cash Flow Statement Kpis Tabular Form Ppt PowerPoint Presentation Infographics File Formats
This is a cash flow statement kpis tabular form ppt powerpoint presentation infographics file formats. This is a four stage process. The stages in this process are operations, investing activities, financing activities, net increase in cash.

P And L Kpis Template 1 Ppt PowerPoint Presentation Slides Show
This is a p and l kpis template 1 ppt powerpoint presentation slides show. This is a four stage process. The stages in this process are other income, total income, expenses, other expenses, depreciation expense.
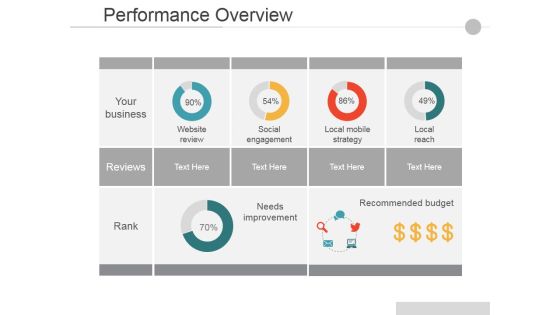
Performance Overview Ppt PowerPoint Presentation Infographic Template Design Ideas
This is a Performance Overview Ppt PowerPoint Presentation Infographic Template Design Ideas. This is a four stage process. The stages in this process are Your Business, Website Review, Social Engagement, Local Mobile Strategy, Local Reach.

Milestones For The Next Reporting Period Ppt PowerPoint Presentation Files
This is a milestones for the next reporting period ppt powerpoint presentation files. This is a seven stage process. The stages in this process are jan, feb, mar, apr, may, jun.

Sales Performance Reporting Ppt PowerPoint Presentation Model Summary
This is a sales performance reporting ppt powerpoint presentation model summary. This is a six stage process. The stages in this process are top selling plans, new customers, top sales reps, sales funnel, sales goal ytd, top opportunities.
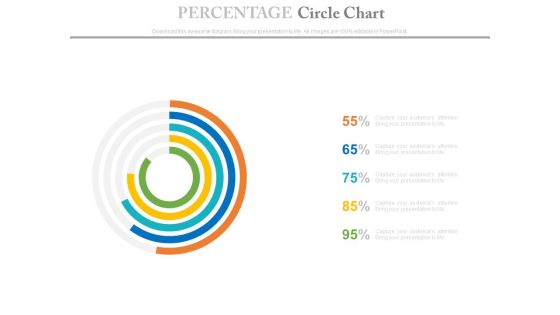
Percentage Data Circle Chart Powerpoint Slides
This PowerPoint template has been designed with circle chart. Download this PPT chart to depict financial ratio analysis. This PowerPoint slide is of great help in the business sector to make realistic presentations and provides effective way of presenting your newer thoughts.

Corporate Security And Risk Management Table Of Contents Corporate Security Summary PDF
This is a corporate security and risk management table of contents corporate security summary pdf template with various stages. Focus and dispense information on five stages using this creative set, that comes with editable features. It contains large content boxes to add your information on topics like ensuring financial assets security, leveraging workforce, budget assessment, dashboard, impact assessment . You can also showcase facts, figures, and other relevant content using this PPT layout. Grab it now.

Data Analytics Ppt PowerPoint Presentation Graphics
This is a data analytics ppt powerpoint presentation graphics. This is a five stage process. The stages in this process are data analysis, business, marketing, success, graph.

Data Analytics Ppt PowerPoint Presentation Themes
This is a data analytics ppt powerpoint presentation themes. This is a five stage process. The stages in this process are business, marketing, presentation, data analyst, management.
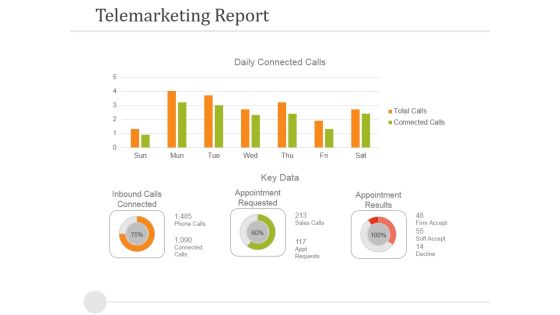
Telemarketing Report Template 1 Ppt PowerPoint Presentation Model Model
This is a telemarketing report template 1 ppt powerpoint presentation model model. This is a two stage process. The stages in this process are inbound calls connected, appointment requested, appointment results, key data.
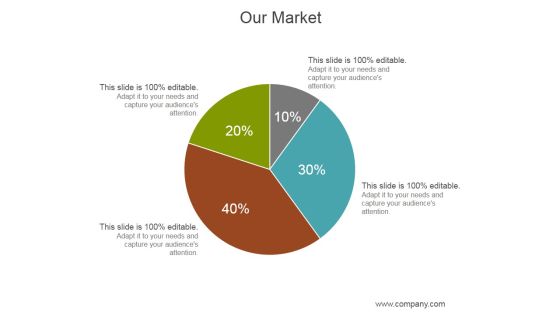
Our Market Ppt PowerPoint Presentation Deck
This is a our market ppt powerpoint presentation deck. This is a four stage process. The stages in this process are business, marketing, management, finance, analysis.

Bar Graph Ppt PowerPoint Presentation Model
This is a bar graph ppt powerpoint presentation model. This is a five stage process. The stages in this process are business, marketing, bar slides, management, finance.

Balance Sheet Kpis Template 1 Ppt PowerPoint Presentation Layouts Design Ideas
This is a balance sheet kpis template 1 ppt powerpoint presentation layouts design ideas. This is a four stage process. The stages in this process are current assets, current liabilities, total assets, total liabilities.

How Much Money We Need Ppt PowerPoint Presentation Outline
This is a how much money we need ppt powerpoint presentation outline. This is a three stage process. The stages in this process are business, marketing, management, production, sales.
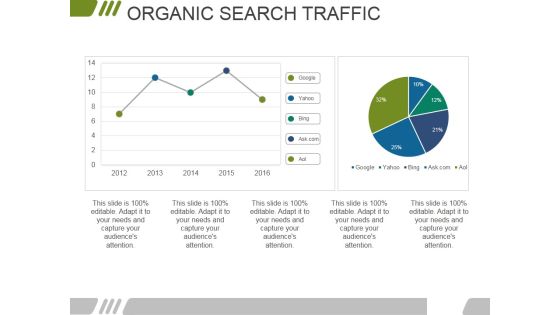
Organic Search Traffic Ppt PowerPoint Presentation Model Slideshow
This is a organic search traffic ppt powerpoint presentation model slideshow. This is a two stage process. The stages in this process are business, marketing, finance, management, organic.

Creating Successful Advertising Campaign Customer Satisfaction Score Graphics PDF
Following slide illustrates customer satisfaction score achieved by the firm in financial year 2019. It includes the statistics of customer satisfaction based on the survey done by the firm. Deliver an awe inspiring pitch with this creative creating successful advertising campaign customer satisfaction score graphics pdf bundle. Topics like customer satisfaction score can be discussed with this completely editable template. It is available for immediate download depending on the needs and requirements of the user.
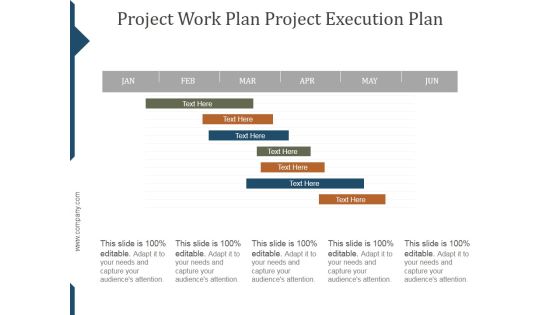
Project Work Plan Project Execution Plan Template Ppt PowerPoint Presentation Styles
This is a project work plan project execution plan template ppt powerpoint presentation styles. This is a seven stage process. The stages in this process are project, management, business, marketing, success.

data collection histograms ppt powerpoint presentation example
This is a data collection histograms ppt powerpoint presentation example. This is a six stage process. The stages in this process are business, planning, marketing, histograms, graph.

Key Performance Indicators Template 3 Ppt PowerPoint Presentation Samples
This is a key performance indicators template 3 ppt powerpoint presentation samples. This is a four stage process. The stages in this process are objective, measures, targets, invites.

Key Performance Indicators Template 2 Ppt PowerPoint Presentation Layouts Portfolio
This is a key performance indicators template 2 ppt powerpoint presentation layouts portfolio. This is a four stage process. The stages in this process are objective, measures, targets, invites.

Last 90 Days Results Ppt PowerPoint Presentation Introduction
This is a last 90 days results ppt powerpoint presentation introduction. This is a six stage process. The stages in this process are revenue, new customers, gross profit, sales comparison.

Acquisition Cost Per Customer Ppt PowerPoint Presentation Example 2015
This is a acquisition cost per customer ppt powerpoint presentation example 2015. This is a three stage process. The stages in this process are rising, steady, falling.
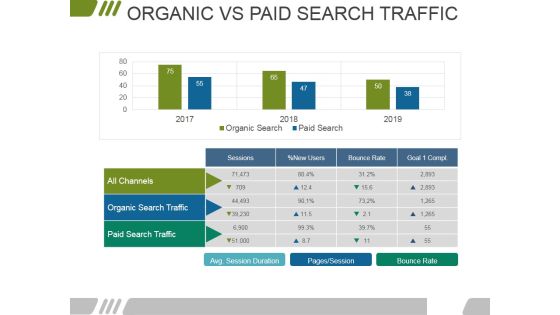
Organic Vs Paid Search Traffic Ppt PowerPoint Presentation Summary Visuals
This is a organic vs paid search traffic ppt powerpoint presentation summary visuals. This is a two stage process. The stages in this process are all channels, organic search traffic, paid search traffic, sessions, bounce rate.
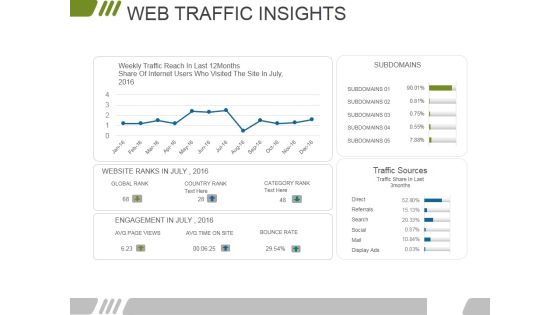
Web Traffic Insights Ppt PowerPoint Presentation Pictures Portrait
This is a web traffic insights ppt powerpoint presentation pictures portrait. This is a four stage process. The stages in this process are subdomains, traffic sources, category rank, country rank, global rank.
Website Performance Review Template 1 Ppt PowerPoint Presentation Slides Icons
This is a website performance review template 1 ppt powerpoint presentation slides icons. This is a three stage process. The stages in this process are online transaction, conversion rate, traffic source, site consumption time, organic branded.

Big Data Opportunities And Challenges Template Ppt PowerPoint Presentation Design Ideas
This is a big data opportunities and challenges template ppt powerpoint presentation design ideas. This is a three stage process. The stages in this process are business, marketing, success, finance, analysis.

Agency Performance Template 2 Ppt PowerPoint Presentation Graphics
This is a agency performance template 2 ppt powerpoint presentation graphics. This is a four stage process. The stages in this process are view ability, ad fraud, industry snapshot, brand safety, tra score.
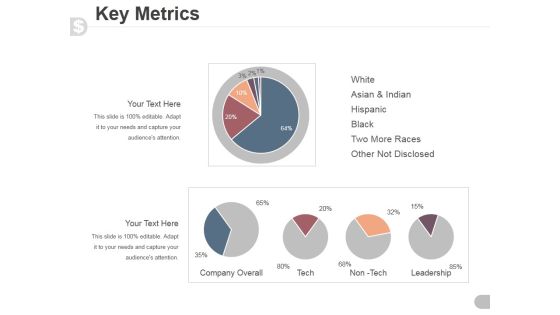
Key Metrics Ppt PowerPoint Presentation Visual Aids
This is a key metrics ppt powerpoint presentation visual aids. This is a five stage process. The stages in this process are white, asian and indian, hispanic, black, two more races, other not disclosed.

Big Data Database Comparison Ppt PowerPoint Presentation Outline
This is a big data database comparison ppt powerpoint presentation outline. This is a four stage process. The stages in this process are business, finance, management, percentage, growth.

Balance Sheet Kpis Ppt PowerPoint Presentation Professional
This is a balance sheet kpis ppt powerpoint presentation professional. This is a four stage process. The stages in this process are current assets, current liabilities, total assets, total liabilities.

Competitive Analysis Scatter Chart Radar Chart Ppt PowerPoint Presentation Infographics
This is a competitive analysis scatter chart radar chart ppt powerpoint presentation infographics. This is a eight stage process. The stages in this process are users interface, data import, example, pricing, support, update, tutorials, easy to use.
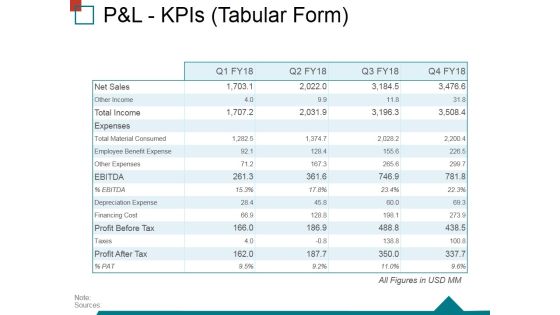
Pandl Kpis Tabular Form Ppt PowerPoint Presentation Ideas Structure
This is a pandl kpis tabular form ppt powerpoint presentation ideas structure. This is a four stage process. The stages in this process are operating profit, revenue, cogs, net profit.

Market Trends Ppt PowerPoint Presentation Model Background Images
This is a market trends ppt powerpoint presentation model background images. This is a two stage process. The stages in this process are our analysis, montana, texas, sales in texas.

Budget Report Ppt PowerPoint Presentation Topics
This is a budget report ppt powerpoint presentation topics. This is a five stage process. The stages in this process are project, incurred, future scheduled, budget, remaining.

Customer Trends Template 1 Ppt PowerPoint Presentation Diagrams
This is a customer trends template 1 ppt powerpoint presentation diagrams. This is a five stage process. The stages in this process are business, marketing, bar graph, finance, management.

Balance Sheet Kpis Tabular Form Ppt PowerPoint Presentation Outline Background Image
This is a balance sheet kpis tabular form ppt powerpoint presentation outline background image. This is a four stage process. The stages in this process are current assets, current liabilities, total assets, total liabilities.

Cash Flow Statement Kpis Tabular Form Ppt PowerPoint Presentation Gallery Good
This is a cash flow statement kpis tabular form ppt powerpoint presentation gallery good. This is a four stage process. The stages in this process are operations, financing activities, investing activities, net increase in cash.

Telemarketing Report Template 2 Ppt PowerPoint Presentation Summary Inspiration
This is a telemarketing report template 2 ppt powerpoint presentation summary inspiration. This is a five stage process. The stages in this process are telemarketing report, business, marketing, success, strategy.
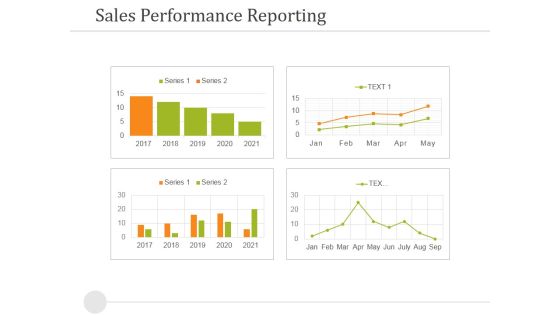
Sales Performance Reporting Ppt PowerPoint Presentation Outline Outfit
This is a sales performance reporting ppt powerpoint presentation outline outfit. This is a four stage process. The stages in this process are sales performance reporting, business, success, strategy, finance.
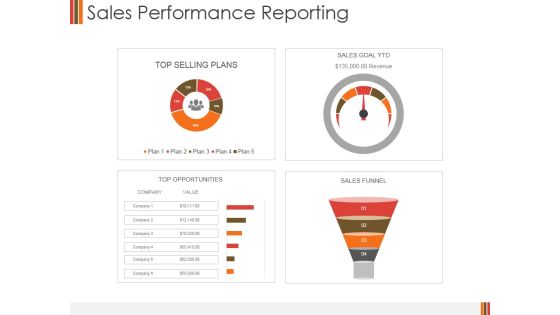
Sales Performance Reporting Ppt PowerPoint Presentation Slides Background Designs
This is a sales performance reporting ppt powerpoint presentation slides background designs. This is a four stage process. The stages in this process are top selling plans, sales goal ytd, top opportunities, sales funnel.

Content Marketing Performance Template 1 Ppt PowerPoint Presentation Infographics Graphics Example
This is a content marketing performance template 1 ppt powerpoint presentation infographics graphics example. This is a eight stage process. The stages in this process are brand awareness, engagement, sales, lead generation, customer retention lead nurturing, upsell.

Demand Forecasting Template 1 Ppt PowerPoint Presentation Styles Gridlines
This is a demand forecasting template 1 ppt powerpoint presentation styles gridlines. This is a four stage process. The stages in this process are trends, qualitative input, base forecast, seasonality factors.

Service Resource Planning Table Ppt Design Templates
This is a service resource planning table ppt design templates. This is a six stage process. The stages in this process are demand and capacity planning, engagement management, service delivery management, erp and corporate dashboards, new business, repeat business, strategic business, scope change, financial management.

Business Data Analysis Chart Comparing Multiple Entities PowerPoint Templates
Analyze Ailments On Our business data analysis chart comparing multiple entities Powerpoint Templates. Bring Out The Thinking Doctor In You. Dock Your Thoughts With Our Financial Analysis . They Will Launch Them Into Orbit.

Table Of Contents Risk Management For Organization Essential Assets Priorities Infographics PDF
This is a table of contents risk management for organization essential assets priorities infographics pdf template with various stages. Focus and dispense information on five stages using this creative set, that comes with editable features. It contains large content boxes to add your information on topics like leveraging workforce, dashboard, impact assessment, budget assessment, ensuring financial assets security. You can also showcase facts, figures, and other relevant content using this PPT layout. Grab it now.

Big Data Benefits Analytics In Healthcare Ppt PowerPoint Presentation Example 2015
This is a big data benefits analytics in healthcare ppt powerpoint presentation example 2015. This is a four stage process. The stages in this process are increased efficiency, better business decision making, improved customer experience and engagement, achieved financial savings.
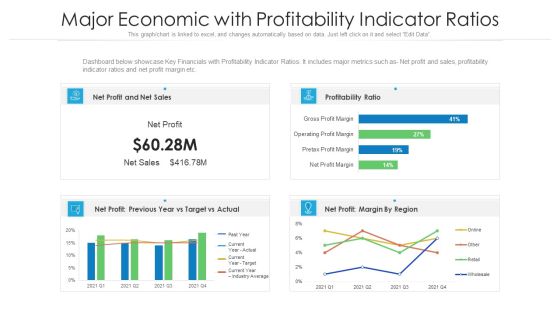
Major Economic With Profitability Indicator Ratios Ppt PowerPoint Presentation Gallery Layouts PDF
Dashboard below showcase Key Financials with Profitability Indicator Ratios. It includes major metrics such as- Net profit and sales, profitability indicator ratios and net profit margin etc. Pitch your topic with ease and precision using this major economic with profitability indicator ratios ppt powerpoint presentation gallery layouts pdf. This layout presents information on sales, profitability ratio, target. It is also available for immediate download and adjustment. So, changes can be made in the color, design, graphics or any other component to create a unique layout.
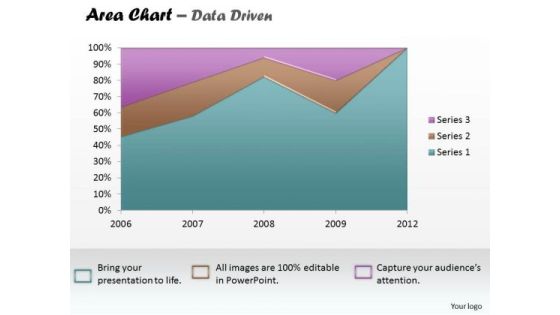
Data Analysis Excel Business Reporting Area Chart PowerPoint Templates
Establish The Dominance Of Your Ideas. Our data analysis excel business reporting area chart Powerpoint Templates Will Put Them On Top.
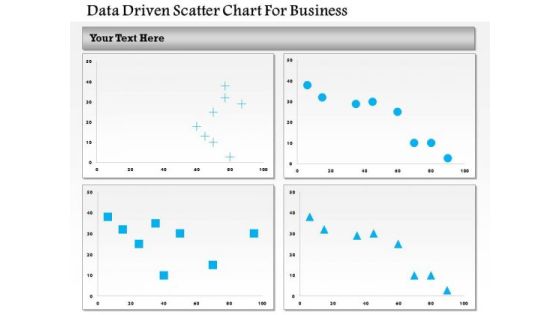
Business Diagram Data Driven Scatter Chart For Business PowerPoint Slide
This business diagram has been designed with four comparative charts. This slide suitable for data representation. You can also use this slide to present business analysis and reports. Use this diagram to present your views in a wonderful manner.
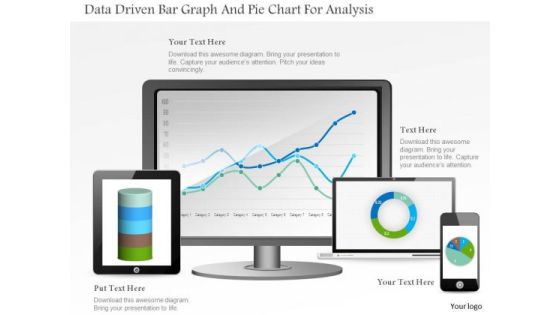
Business Diagram Data Driven Bar Graph And Pie Chart For Analysis PowerPoint Slide
This PowerPoint template displays technology gadgets with various business charts. Use this diagram slide, in your presentations to make business reports for statistical analysis. You may use this diagram to impart professional appearance to your presentations.

Business Diagram Colored Column Chart For Result Analysis PowerPoint Slide
This Power Point diagram has been designed with graphic of column chart. It contains diagram of bar char depicting annual business progress report. Use this diagram to build professional presentations for your viewers.

Business Diagram Two Tablets With Growth Bar Graph Data Driven PowerPoint Slide
This business diagram has been designed with comparative charts on tablets. This slide suitable for data representation. You can also use this slide to present business reports and information. Use this diagram to present your views in a wonderful manner.
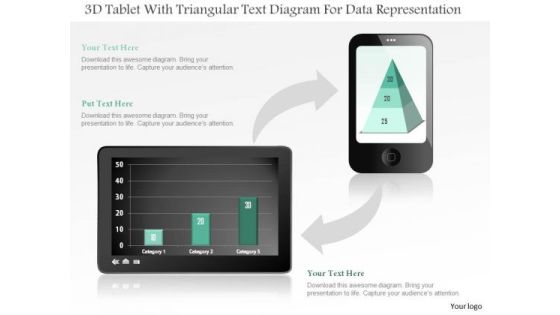
Business Diagram 3d Tablet With Triangular Text Diagram For Data Representation PowerPoint Slide
This business diagram displays bar graph on tablet and pyramid chart on mobile phone. Use this diagram, to make reports for interactive business presentations. Create professional presentations using this diagram.

Business Diagram Tablet With Pie And Business Bar Graph For Result Analysis PowerPoint Slide
This PowerPoint template displays technology gadgets with various business charts. Use this diagram slide, in your presentations to make business reports for statistical analysis. You may use this diagram to impart professional appearance to your presentations.

Data Analysis Template Driven Stock Chart For Market Trends PowerPoint Slides Templates
Drive Your Team Along The Road To Success. Take The Wheel With Our data analysis template driven stock chart for market trends powerpoint slides Templates .

Examples Of Data Analysis Market 3d Business Trend Series Chart PowerPoint Templates
Duct It Through With Our examples of data analysis market 3d business trend series chart Powerpoint Templates . Your Ideas Will Reach Into Their Minds Intact.

Data Analysis In Excel Column Chart For Business Analytics PowerPoint Templates
Our data analysis in excel column chart for business analytics Powerpoint Templates Heighten Concentration. Your Audience Will Be On The Edge.
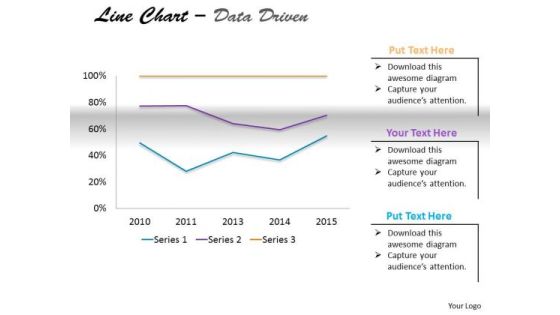
Multivariate Data Analysis Driven Market Line Chart PowerPoint Slides Templates
Delight Them With Our multivariate data analysis driven market line chart powerpoint slides Templates .
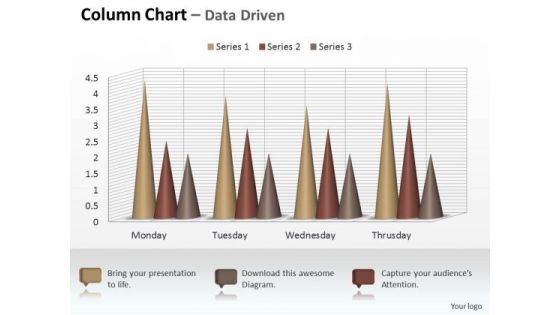
Marketing Data Analysis 3d Sets Of Column Chart PowerPoint Templates
Your Listeners Will Never Doodle. Our marketing data analysis 3d sets of column chart Powerpoint Templates Will Hold Their Concentration.
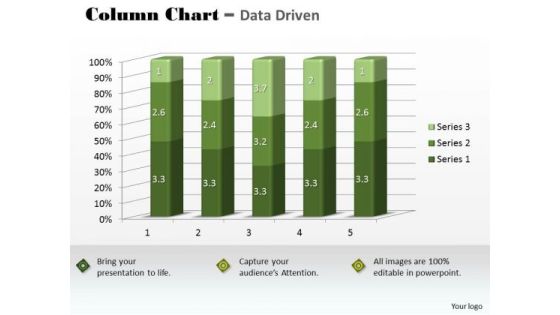
Marketing Data Analysis 3d Statistical Quality Control Chart PowerPoint Templates
Our marketing data analysis 3d statistical quality control chart Powerpoint Templates Abhor Doodling. They Never Let The Interest Flag.

Data Analysis Template Forex Market Bar Chart PowerPoint Templates
Attract A Crowd With Our data analysis template forex market bar chart Powerpoint Templates . They Will Drop It All And Come To Hear You.

Examples Of Data Analysis Market 3d Categories Sets PowerPoint Templates
Our examples of data analysis market 3d categories sets Powerpoint Templates Give Your Thoughts Their Due. They Project Them With Full Intensity.
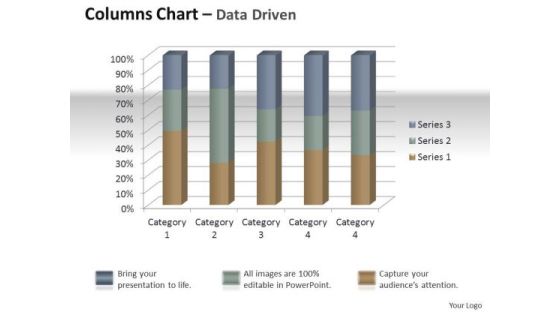
Marketing Data Analysis 3d Quality Control Of Units PowerPoint Templates
Establish Your Dominion With Our marketing data analysis 3d quality control of units Powerpoint Templates . Rule The Stage With Your Thoughts.
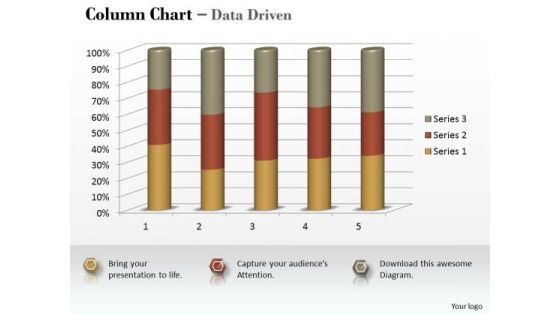
Marketing Data Analysis 3d Statistical Process Column Chart PowerPoint Templates
Be A Donor Of Great Ideas. Display Your Charity On Our marketing data analysis 3d statistical process column chart Powerpoint Templates .

Marketing Data Analysis 3d Statistical Process Control Chart PowerPoint Templates
Open Up Doors That Lead To Success. Our marketing data analysis 3d statistical process control chart Powerpoint Templates Provide The Handles.
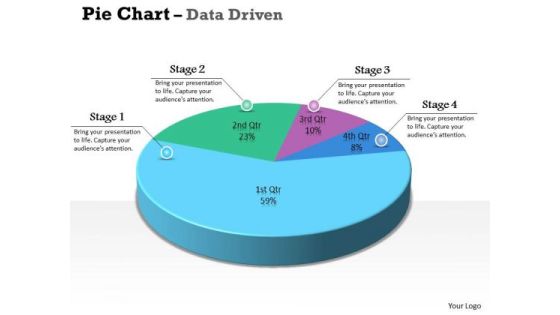
Data Analysis Excel 3d Pie Chart For Marketing Process PowerPoint Templates
Our data analysis excel 3d pie chart for marketing process Powerpoint Templates Team Are A Dogged Lot. They Keep At It Till They Get It Right.
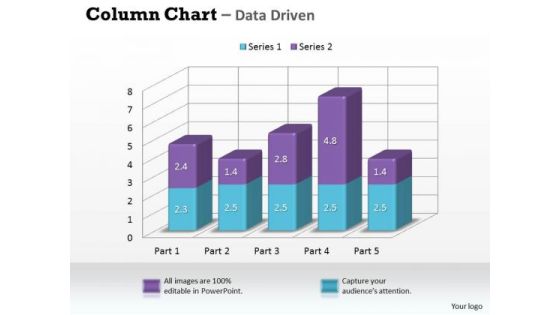
Data Analysis In Excel 3d Column Chart For Market Surveys PowerPoint Templates
Our data analysis in excel 3d column chart for market surveys Powerpoint Templates Leave No One In Doubt. Provide A Certainty To Your Views.

Data Analysis Programs 3d Bar Chart For Market Surveys PowerPoint Templates
Draw On The Experience Of Our data analysis programs 3d bar chart for market surveys Powerpoint Templates . They Imbibe From Past Masters.
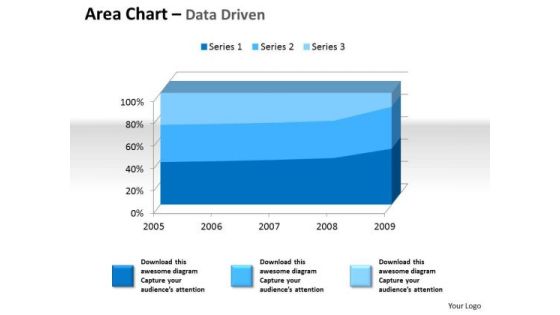
Examples Of Data Analysis Market 3d Area Chart For Quantiative PowerPoint Templates
Drum It Up With Our examples of data analysis market 3d area chart for quantiative Powerpoint Templates . Your Thoughts Will Raise The Tempo.
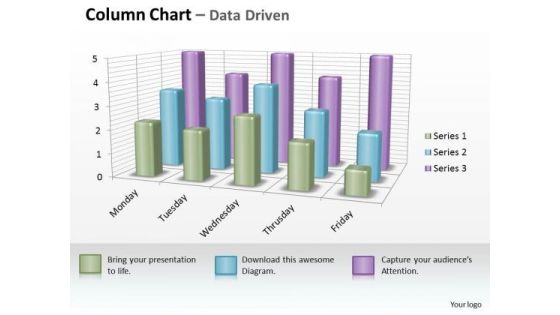
Examples Of Data Analysis Market 3d Business Inspection Procedure Chart PowerPoint Templates
However Dry Your Topic Maybe. Make It Catchy With Our examples of data analysis market 3d business inspection procedure chart Powerpoint Templates .

Examples Of Data Analysis Market 3d Business Intelligence And PowerPoint Templates
Our examples of data analysis market 3d business intelligence and Powerpoint Templates Are Dual Purpose. They Help Instruct And Inform At The Same Time.
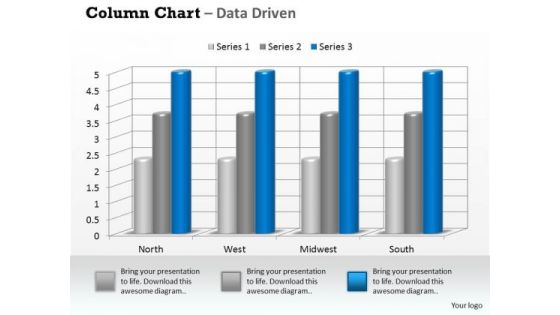
Examples Of Data Analysis Market 3d Business On Regular Intervals PowerPoint Templates
Drum It Out Loud And Clear On Our examples of data analysis market 3d business on regular intervals Powerpoint Templates . Your Words Will Ring In Their Ears.

Examples Of Data Analysis Market Driven Plotting The Business Values PowerPoint Slides Templates
Ring The Duck With Our examples of data analysis market driven plotting the business values powerpoint slides Templates . Acquire The Points With Your Ideas.

Examples Of Data Analysis Market Driven Radar Chart To Compare PowerPoint Slides Templates
Rely On Our examples of data analysis market driven radar chart to compare powerpoint slides Templates In Any Duel. They Will Drive Home Your Point.
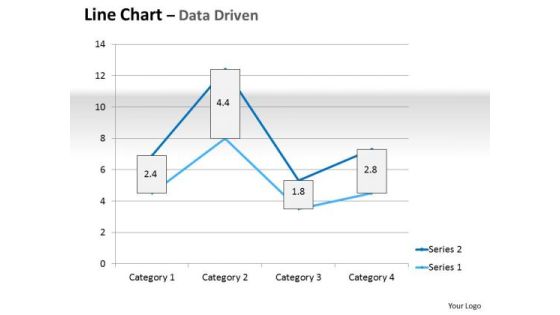
Multivariate Data Analysis Driven Line Chart Market Graph PowerPoint Slides Templates
Plan For All Contingencies With Our multivariate data analysis driven line chart market graph powerpoint slides Templates . Douse The Fire Before It Catches.

Data Analysis On Excel Driven Stock Chart For Market History PowerPoint Slides Templates
Draw Out The Best In You With Our data analysis on excel driven stock chart for market history powerpoint slides Templates . Let Your Inner Brilliance Come To The Surface.
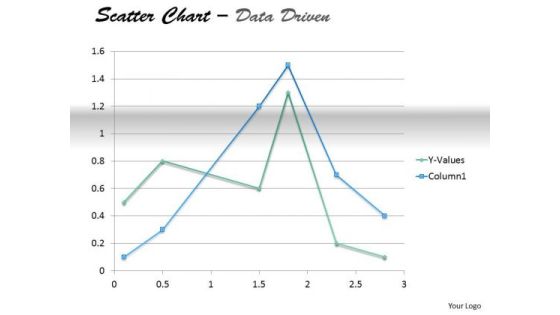
Examples Of Data Analysis Market Driven Present In Scatter Chart PowerPoint Slides Templates
Your Thoughts Will Take To Our examples of data analysis market driven present in scatter chart powerpoint slides Templates Like A Duck To Water. They Develop A Binding Affinity.

Magnifying Glass For Sales Performance Review Ppt PowerPoint Presentation Model
This is a magnifying glass for sales performance review ppt powerpoint presentation model. This is a four stage process. The stage in this process are magnifier glass, pie, finance, percentage, research.

Business Diagram 3d Thumb Chart And Tablet For Data Representation PowerPoint Slide
This business diagram displays graphic of 3d thumb up chart with icons on computer screen. This business slide contains the concept of business data representation. Use this diagram to build professional presentations for your viewers.
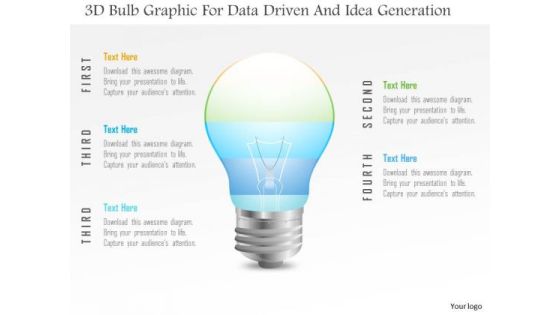
Business Diagram 3d Bulb Graphic For Data Driven And Idea Generation PowerPoint Slide
This Power Point template has been designed with 3d bulb graphic. Use this slide to represent technology idea and strategy concepts. Download this diagram for your business presentations and get exclusive comments on your efforts.
Business Diagram Hour Glass With 3d Man And Icons PowerPoint Slide
This diagram displays 3d man with hour glass and icons. This diagram contains concept of communication and technology. Use this diagram to display business process workflows in any presentations.
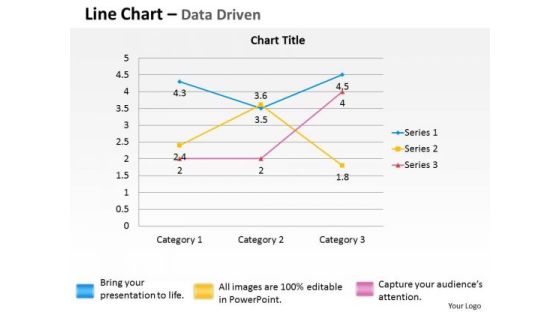
Quantitative Data Analysis Driven Economic Line Chart PowerPoint Slides Templates
Break The Deadlock With Our quantitative data analysis driven economic line chart powerpoint slides Templates . Let The Words Start To Flow.

Multivariate Data Analysis Numeric Values Surface Chart PowerPoint Templates
Your Grasp Of Economics Is Well Known. Help Your Audience Comprehend Issues With Our multivariate data analysis numeric values surface chart Powerpoint Templates .
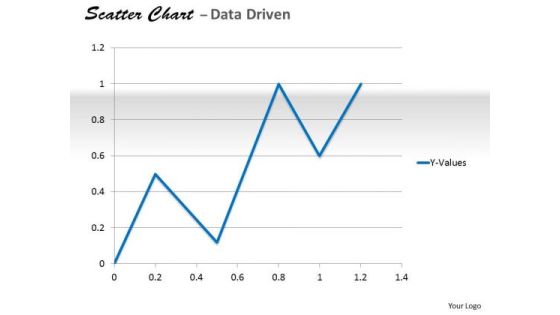
Data Analysis In Excel Analyzing Of Relationship Chart PowerPoint Templates
Delight Them With Our data analysis in excel analyzing of relationship chart Powerpoint Templates .
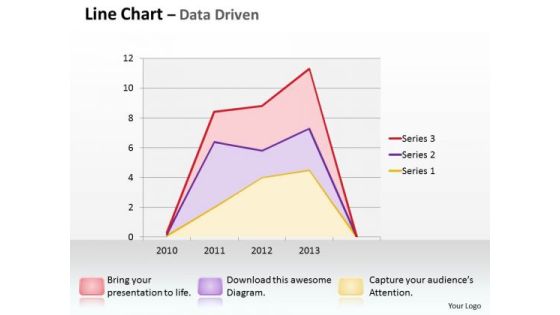
Multivariate Data Analysis Driven Line Chart Shows Revenue Trends PowerPoint Slides Templates
Good Camaraderie Is A Key To Teamwork. Our multivariate data analysis driven line chart shows revenue trends powerpoint slides Templates Can Be A Cementing Force.

Business Data Analysis Chart For Project PowerPoint Templates
Document Your Views On Our business data analysis chart for project Powerpoint Templates. They Will Create A Strong Impression.
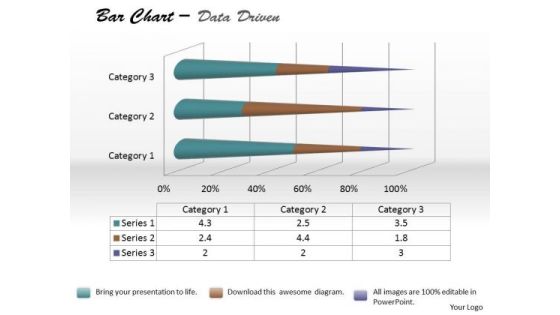
Data Analysis Bar Chart For Foreign Trade PowerPoint Templates
Be The Doer With Our data analysis bar chart for foreign trade Powerpoint Templates. Put Your Thoughts Into Practice.

Data Analysis Excel Business Tool Scatter Chart PowerPoint Templates
Dominate Proceedings With Your Ideas. Our data analysis excel business tool scatter chart Powerpoint Templates Will Empower Your Thoughts.
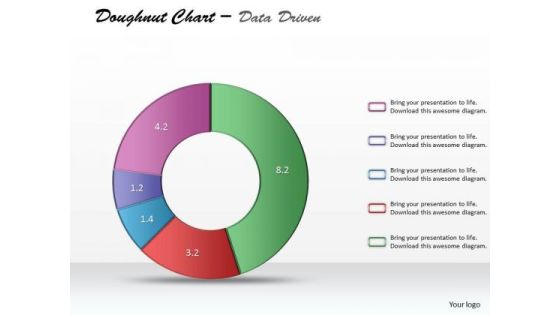
Data Analysis Excel Categorical Statistics Doughnut Chart PowerPoint Templates
Establish Your Dominion With Our data analysis excel categorical statistics doughnut chart Powerpoint Templates. Rule The Stage With Your Thoughts.

Data Analysis Techniques 3d Grouped Bar Chart PowerPoint Templates
Place The Orders With Your Thoughts. Our data analysis techniques 3d grouped bar chart Powerpoint Templates Know The Drill.
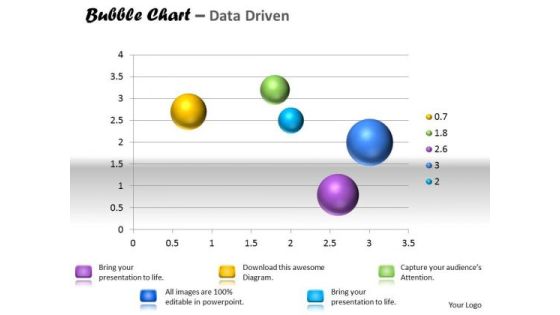
Data Analysis Template Interactive Bubble Chart PowerPoint Templates
Our data analysis template interactive bubble chart Powerpoint Templates Are A Wonder Drug. They Help Cure Almost Any Malaise.
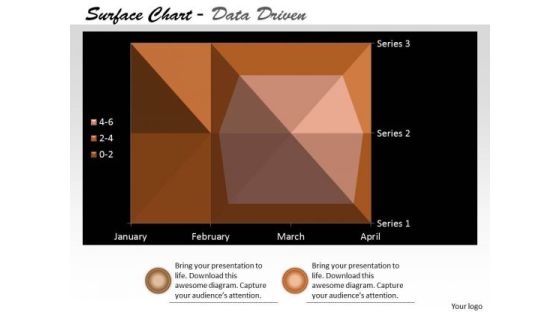
Multivariate Data Analysis Surface Chart Plots Trends PowerPoint Templates
Our multivariate data analysis surface chart plots trends Powerpoint Templates Heighten Concentration. Your Audience Will Be On The Edge.
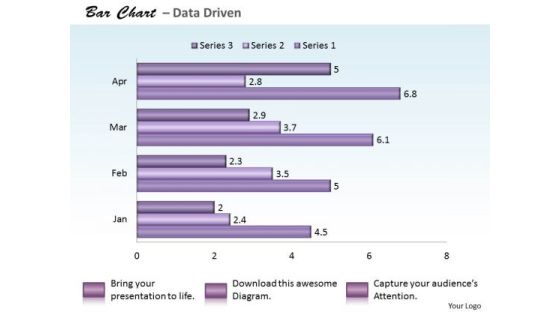
Quantitative Data Analysis Bar Chart For PowerPoint Templates
Reduce The Drag With Our quantitative data analysis bar chart for Powerpoint Templates . Give More Lift To Your Thoughts.

Data Analysis Techniques 3d Effective Display Chart PowerPoint Templates
Dribble Away With Our data analysis techniques 3d effective display chart Powerpoint Templates . Score A Goal With Your Ideas.
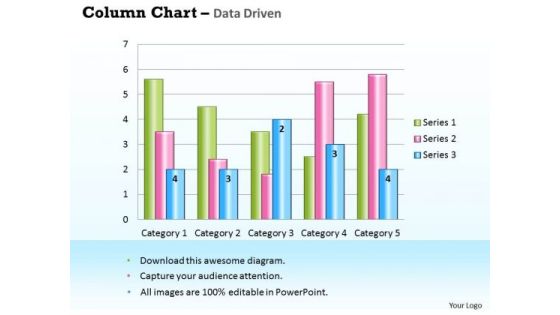
Business Data Analysis Chart For Case Studies PowerPoint Templates
Get Out Of The Dock With Our business data analysis chart for case studies Powerpoint Templates. Your Mind Will Be Set Free.
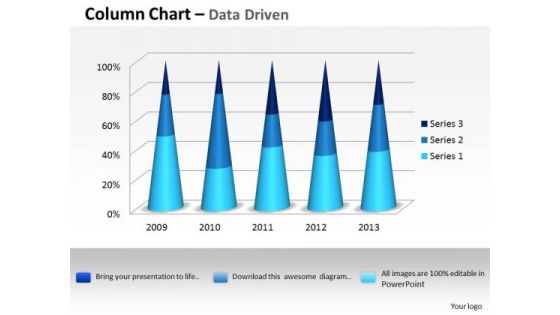
Data Analysis Excel 3d Process Variation Column Chart PowerPoint Templates
Put In A Dollop Of Our data analysis excel 3d process variation column chart Powerpoint Templates. Give Your Thoughts A Distinctive Flavor.
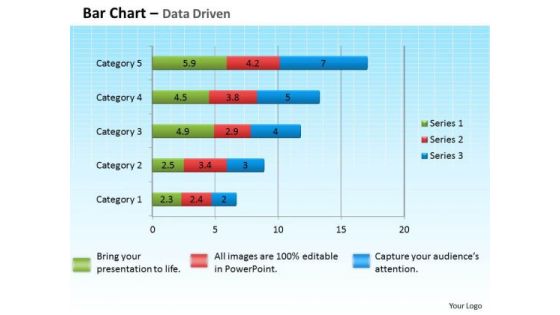
Data Analysis Excel Bar Graph To Compare PowerPoint Templates
Get The Domestics Right With Our data analysis excel bar graph to compare Powerpoint Templates. Create The Base For Thoughts To Grow.

Data Analysis Excel Bubble Chart For Business Tasks PowerPoint Templates
Doll Up Your Thoughts With Our data analysis excel bubble chart for business tasks Powerpoint Templates. They Will Make A Pretty Picture.

Data Analysis In Excel 3d Classification Of Chart PowerPoint Templates
With Our data analysis in excel 3d classification of chart Powerpoint Templates You Will Be Doubly Sure. They Possess That Stamp Of Authority.
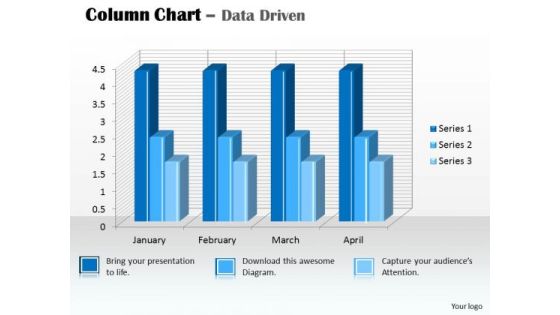
Data Analysis In Excel 3d Column Chart For PowerPoint Templates
Our data analysis in excel 3d column chart for Powerpoint Templates And Your Ideas Make A Great Doubles Pair. Play The Net With Assured Hands.

Data Analysis In Excel Of Stock Chart PowerPoint Templates
Plan Your Storyboard With Our data analysis in excel of stock chart Powerpoint Templates . Give An Outline To The Solutions You Have.

Data Analysis Programs 3d Bar Chart To Dispaly PowerPoint Templates
Lower The Drawbridge With Our data analysis programs 3d bar chart to dispaly Powerpoint Templates . Capture The Minds Of Your Audience.
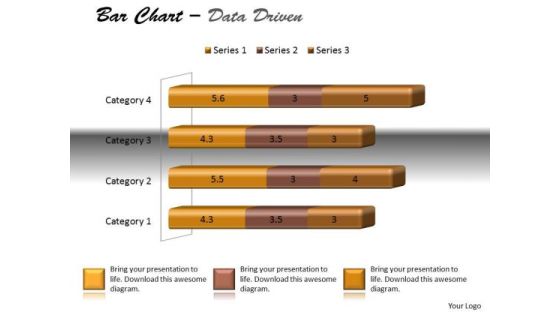
Data Analysis Techniques 3d Bar Chart For Modification PowerPoint Templates
Dreams Generate Thoughts, Thoughts Generate Ideas. Give Them Life With Our data analysis techniques 3d bar chart for modification Powerpoint Templates .
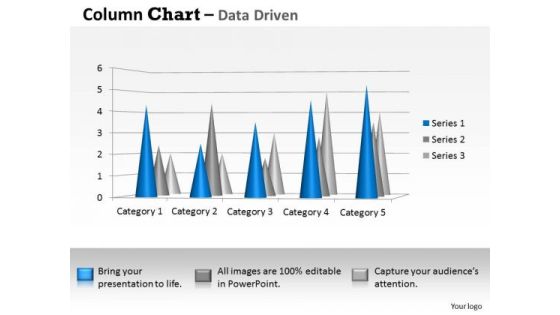
Data Analysis Techniques 3d Distribution Of In Sets PowerPoint Templates
Your Thoughts Will Be The Main Course. Provide The Dressing With Our data analysis techniques 3d distribution of in sets Powerpoint Templates .

Data Analysis Techniques 3d Graphical Presentation Of PowerPoint Templates
Our data analysis techniques 3d graphical presentation of Powerpoint Templates Will Follow The Drill. They Accomplish The Task Assigned To Them.

Data Analysis Techniques 3d In Segments Pie Chart PowerPoint Templates
Drink To The Success Of Your Campaign. Our data analysis techniques 3d in segments pie chart Powerpoint Templates Will Raise A Toast.

Data Analysis Template Driven Visualization Area Chart PowerPoint Slides Templates
Draw On The Energy Of Our data analysis template driven visualization area chart powerpoint slides Templates . Your Thoughts Will Perk Up.


