Financial Comparison

Financial Reporting Considerations For The Shipping Industry Debt Financial Covenants Demonstration PDF
This template covers debt covenant testing for the next 12 months, will be done on loan to value covenant, EBITDA covenants, vessel layup etc.This is a financial reporting considerations for the shipping industry debt financial covenants demonstration pdf. template with various stages. Focus and dispense information on one stage using this creative set, that comes with editable features. It contains large content boxes to add your information on topics like loan to value clause, covenants on ebitda, material adverse provisions, consider amending the loan agreement. You can also showcase facts, figures, and other relevant content using this PPT layout. Grab it now.
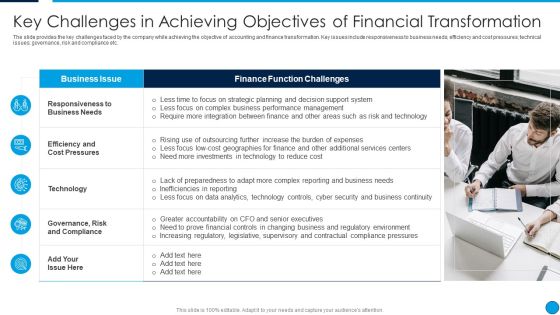
Summary Financial Key Challenges In Achieving Objectives Of Financial Transformation Professional PDF
The slide provides the key challenges faced by the company while achieving the objective of accounting and finance transformation. Key issues include responsiveness to business needs, efficiency and cost pressures, technical issues, governance, risk and compliance etc. This is a Summary Financial Key Challenges In Achieving Objectives Of Financial Transformation Professional PDF template with various stages. Focus and dispense information on five stages using this creative set, that comes with editable features. It contains large content boxes to add your information on topics like Business Issue, Finance Function Challenges, Responsiveness To Business Needs, Technology. You can also showcase facts, figures, and other relevant content using this PPT layout. Grab it now.
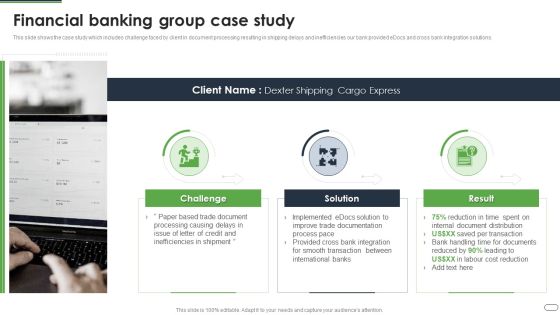
Financial Solutions Company Profile Financial Banking Group Case Study Diagrams PDF
This slide shows the case study which includes challenge faced by client in document processing resulting in shipping delays and inefficiencies our bank provided eDocs and cross bank integration solutions.This is a Financial Solutions Company Profile Financial Banking Group Case Study Diagrams PDF template with various stages. Focus and dispense information on three stages using this creative set, that comes with editable features. It contains large content boxes to add your information on topics like Processing Causing, Inefficiencies Shipment, International Banks You can also showcase facts, figures, and other relevant content using this PPT layout. Grab it now.

Commercial Bank Financial Services Company Profile Financial Banking Group Case Study Diagrams PDF
This slide shows the case study which includes challenge faced by client in document processing resulting in shipping delays and inefficiencies our bank provided eDocs and cross bank integration solutions. This is a Commercial Bank Financial Services Company Profile Financial Banking Group Case Study Diagrams PDF template with various stages. Focus and dispense information on three stages using this creative set, that comes with editable features. It contains large content boxes to add your information on topics like Challenge, Solution, Result. You can also showcase facts, figures, and other relevant content using this PPT layout. Grab it now.

Adjusting Financial Strategies And Planning Comparative Analysis Of Financial Analysis Software Structure PDF
This slide provides glimpse about comparative analysis of different corporate investment portfolios for selecting appropriate investment portfolio. It includes KPIs such as return, risk, liquidity, time horizon, etc. Coming up with a presentation necessitates that the majority of the effort goes into the content and the message you intend to convey. The visuals of a PowerPoint presentation can only be effective if it supplements and supports the story that is being told. Keeping this in mind our experts created Adjusting Financial Strategies And Planning Comparative Analysis Of Financial Analysis Software Structure PDF to reduce the time that goes into designing the presentation. This way, you can concentrate on the message while our designers take care of providing you with the right template for the situation.
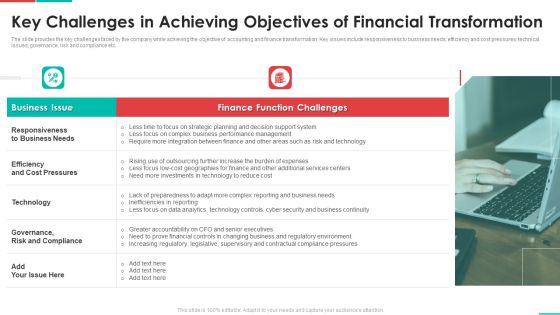
Roadmap For Financial Accounting Transformation Key Challenges In Achieving Objectives Of Financial Professional PDF
The slide provides the key challenges faced by the company while achieving the objective of accounting and finance transformation. Key issues include responsiveness to business needs efficiency and cost pressures technical issues governance, risk and compliance etc. This is a roadmap for financial accounting transformation key challenges in achieving objectives of financial professional pdf template with various stages. Focus and dispense information on two stages using this creative set, that comes with editable features. It contains large content boxes to add your information on topics like responsiveness to business needs, efficiency and cost pressures, technology, governance, risk and compliance. You can also showcase facts, figures, and other relevant content using this PPT layout. Grab it now.

Comparing Financial Of Companies In Same Industrial Sector Background PDF
This slide showcases the companies falling under same industry. Five companies of oil and gas industry are selected for the comparison purpose here. Key financial included here are market capitalization, current price, one year return etc. Showcasing this set of slides titled Comparing Financial Of Companies In Same Industrial Sector Background PDF. The topics addressed in these templates are Exxon Mobil Corp, Chevron Corporation, Devon Energy Corp. All the content presented in this PPT design is completely editable. Download it and make adjustments in color, background, font etc. as per your unique business setting.

Bidding Cost Comparison Bidder Comparison Prerequisites Of The Project Ppt Slides Display PDF
This slide shows comparison and selection of best construction company fulfilling eligibility criteria including financial turnover, experience, certification, major government project and credit facility. Deliver and pitch your topic in the best possible manner with this Bidding Cost Comparison Bidder Comparison Prerequisites Of The Project Ppt Slides Display PDF. Use them to share invaluable insights on annual financial turnover, experience, certification, major government project and impress your audience. This template can be altered and modified as per your expectations. So, grab it now.
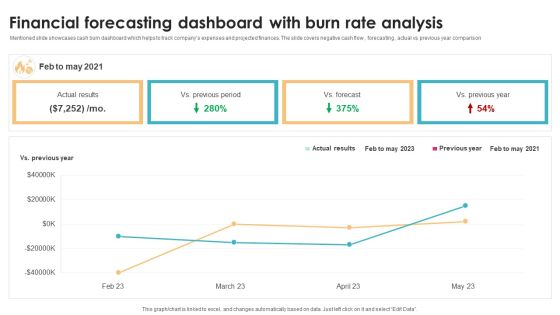
Financial Forecasting Dashboard With Burn Rate Analysis Brochure PDF
Mentioned slide showcases cash burn dashboard which helps to track companys expenses and projected finances. The slide covers negative cash flow , forecasting , actual vs previous year comparison Showcasing this set of slides titled Financial Forecasting Dashboard With Burn Rate Analysis Brochure PDF. The topics addressed in these templates are Previous Year, Analysis, Forecast. All the content presented in this PPT design is completely editable. Download it and make adjustments in color, background, font etc. as per your unique business setting.

Information Systems Security And Risk Management Plan Comparison Rules PDF
This graph chart is linked to excel, and changes automatically based on data. Just left click on it and select Edit Data. Find highly impressive Information Systems Security And Risk Management Plan Comparison Rules PDF on Slidegeeks to deliver a meaningful presentation. You can save an ample amount of time using these presentation templates. No need to worry to prepare everything from scratch because Slidegeeks experts have already done a huge research and work for you. You need to download Information Systems Security And Risk Management Plan Comparison Rules PDF for your upcoming presentation. All the presentation templates are 100 percent editable and you can change the color and personalize the content accordingly. Download now.

Analysis Between Actual And Forecasted Financial Budget Infographics PDF
This slide shows the table representing the comparison between actual and forecasted financial budget of an ecommerce company. It includes details related to investments, start and finish date, budget, actual to date, budget remaining, Percent spent, forecast calculated and remaining etc. Showcasing this set of slides titled Analysis Between Actual And Forecasted Financial Budget Infographics PDF. The topics addressed in these templates are External Labor, Budget Remaining, Forecast Remaining. All the content presented in this PPT design is completely editable. Download it and make adjustments in color, background, font etc. as per your unique business setting.
Financial Impact Of Fundraising On Organization Icons PDF
This slide showcases financial impact of raising funds on organization. It showcases comparison of various ratios before and after fundraising which are - debt to equity ratio, debt to capital ratio, shareholder equity ratio. Deliver an awe inspiring pitch with this creative Financial Impact Of Fundraising On Organization Icons PDF bundle. Topics like Debt To Equity Ratio, Debt To Capital Ratio, Shareholder Equity Ratio can be discussed with this completely editable template. It is available for immediate download depending on the needs and requirements of the user.

Budgeting Planned Actual Comparison Ppt PowerPoint Presentation Graphics
This is a budgeting planned actual comparison ppt powerpoint presentation graphics. This is a two stage process. The stages in this process are value difference, actual cost, planned cost, type of cost.

Budgeting Planned Actual Comparison Ppt PowerPoint Presentationpictures Files
This is a budgeting planned actual comparison ppt powerpoint presentationpictures files. This is a two stage process. The stages in this process are deviation, planned costs vs actual costs, planned cost, actual cost.

Budgeting Planned Actual Comparison Ppt PowerPoint Presentation Visual Aids Outline
This is a budgeting planned actual comparison ppt powerpoint presentation visual aids outline. This is a three stage process. The stages in this process are planned cost, actual cost, value difference.

Corporate Bank Business Account Comparison Matrix Slides PDF
This slide outlines the business account comparison matrix for corporate financial institution to which assist in to improve liquidity. It includes e payment account, current account, etc. Pitch your topic with ease and precision using this Corporate Bank Business Account Comparison Matrix Slides PDF. This layout presents information on Accounts, Electronic Credit, Charges. It is also available for immediate download and adjustment. So, changes can be made in the color, design, graphics or any other component to create a unique layout.

Financial Impact Of Fundraising On Organization Microsoft PDF
This slide showcases financial impact of raising funds on organization. It showcases comparison of various ratios before and after fundraising which are debt to equity ratio, debt to capital ratio, shareholder equity ratio. Whether you have daily or monthly meetings, a brilliant presentation is necessary. Financial Impact Of Fundraising On Organization Microsoft PDF can be your best option for delivering a presentation. Represent everything in detail using Financial Impact Of Fundraising On Organization Microsoft PDF and make yourself stand out in meetings. The template is versatile and follows a structure that will cater to your requirements. All the templates prepared by Slidegeeks are easy to download and edit. Our research experts have taken care of the corporate themes as well. So, give it a try and see the results.
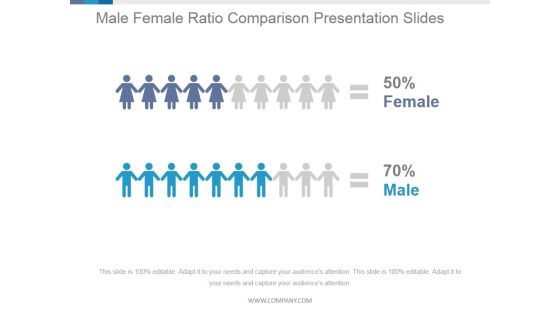
Male Female Ratio Comparison Ppt PowerPoint Presentation Picture
This is a male female ratio comparison ppt powerpoint presentation picture. This is a two stage process. The stages in this process are female, male, finance, compare.

Bank Comparison Comparison Analysis Of Profit And Business Evaluation Designs PDF
This slide presents banks comparison on basis of their net profit and change in profits from last year that provides insights on growth opportunities ahead of their current market value. It includes banks such as HDFC, ICICI, Axis ,Kotak Mahindra and IndusInd. Showcasing this set of slides titled Bank Comparison Comparison Analysis Of Profit And Business Evaluation Designs PDF. The topics addressed in these templates are US Bancorp, Truist Financial, Goldman Sachs. All the content presented in this PPT design is completely editable. Download it and make adjustments in color, background, font etc. as per your unique business setting.

Budget Performance Comparison Graph For Project Planning Pictures PDF
This slide covers comparison graph of revenue generation in financial management of project. Showcasing this set of slides titled budget performance comparison graph for project planning pictures pdf. The topics addressed in these templates are budget performance comparison graph for project planning. All the content presented in this PPT design is completely editable. Download it and make adjustments in color, background, font etc. as per your unique business setting.

Big Data Database Comparison Ppt PowerPoint Presentation Outline
This is a big data database comparison ppt powerpoint presentation outline. This is a four stage process. The stages in this process are business, finance, management, percentage, growth.

Budgeting Planned Actual Comparison Ppt PowerPoint Presentation Infographic Template
This is a budgeting planned actual comparison ppt powerpoint presentation infographic template. This is a two stage process. The stages in this process are planned costs vs actual costs, deviation, actual costs, planned costs.
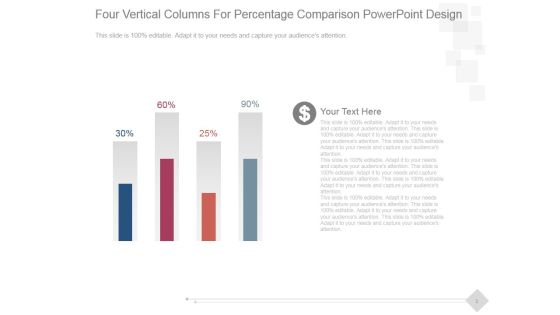
Four Vertical Columns For Percentage Comparison Ppt PowerPoint Presentation Introduction
This is a four vertical columns for percentage comparison ppt powerpoint presentation introduction. This is a four stage process. The stages in this process are business, marketing, success, management, presentation.
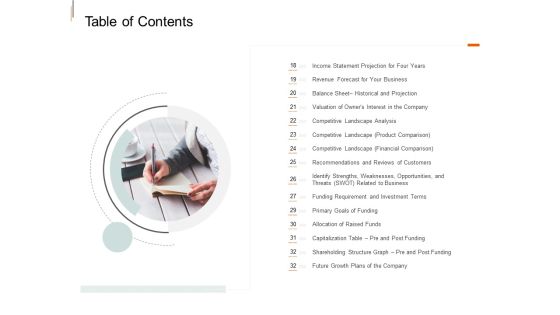
Equity Crowd Investing Table Of Contents Slide Financial Ppt Portfolio Design Inspiration PDF
This is a equity crowd investing table of contents slide financial ppt portfolio design inspiration pdf template with various stages. Focus and dispense information on one stage using this creative set, that comes with editable features. It contains large content boxes to add your information on topics like revenue forecast your business, competitive landscape analysis, funding requirement investment terms, future growth plans company, financial comparison. You can also showcase facts, figures, and other relevant content using this PPT layout. Grab it now.

Cost Comparison Table With Price Values Ppt PowerPoint Presentation Graphics
This is a cost comparison table with price values ppt powerpoint presentation graphics. This is a three stage process. The stages in this process are cost comparison.
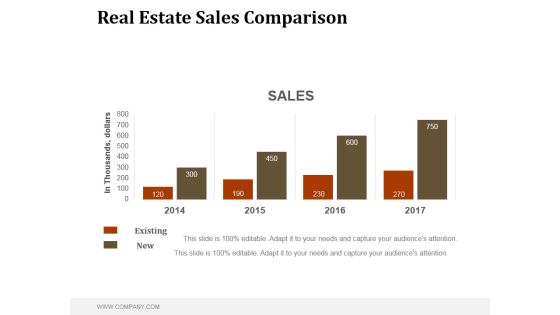
Real Estate Sales Comparison Ppt PowerPoint Presentation Good
This is a real estate sales comparison ppt powerpoint presentation good. This is a four stage process. The stages in this process are business, marketing, management, sales, comparison.
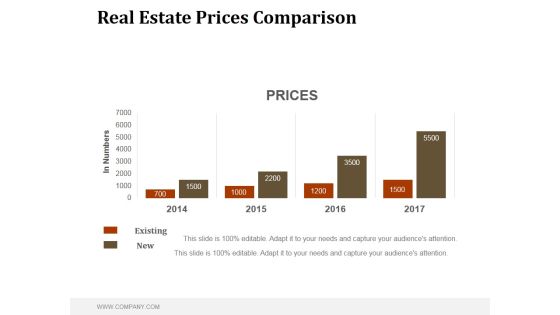
Real Estate Prices Comparison Ppt PowerPoint Presentation Example File
This is a real estate prices comparison ppt powerpoint presentation example file. This is a four stage process. The stages in this process are business, marketing, management, comparison, prices.

Comparison Chart For Strategic Planning Analysis Ppt PowerPoint Presentation Example
This is a comparison chart for strategic planning analysis ppt powerpoint presentation example. This is a two stage process. The stages in this process are business, finance, marketing, strategy, success.

3 Vendor Comparison Organization Scorecard Ppt Show Model PDF
The following slide showcases vendor comparison scorecard to determine the suitable supplier for organization procurement needs. The comparison is done on the basis of evaluation categories that are cost, credit rating, on-time delivery and financial stability. Showcasing this set of slides titled 3 Vendor Comparison Organization Scorecard Ppt Show Model PDF. The topics addressed in these templates are Evaluation Category, Supplier, Score. All the content presented in this PPT design is completely editable. Download it and make adjustments in color, background, font etc. as per your unique business setting.

Revenue And Expenses Comparison Historical And Projection Structure PDF
The slide provides the comparative graph of companys revenue and expenses for last 5 years historical and coming 4 years forecasted. Deliver an awe-inspiring pitch with this creative revenue and expenses comparison historical and projection structure pdf bundle. Topics like financials, revenue, operating expenses can be discussed with this completely editable template. It is available for immediate download depending on the needs and requirements of the user.
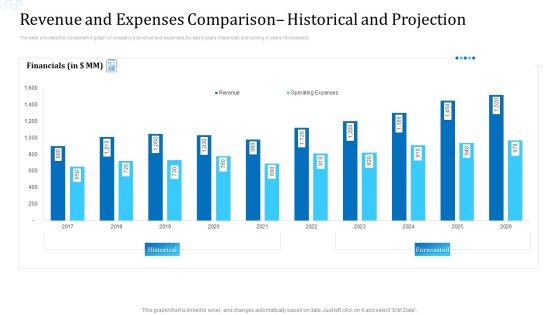
Revenue And Expenses Comparison Historical And Projection Mockup PDF
The slide provides the comparative graph of companys revenue and expenses for last 5 years historical and coming 4 years forecasted. Deliver an awe inspiring pitch with this creative revenue and expenses comparison historical and projection mockup pdf bundle. Topics like financials, revenue, expenses can be discussed with this completely editable template. It is available for immediate download depending on the needs and requirements of the user.
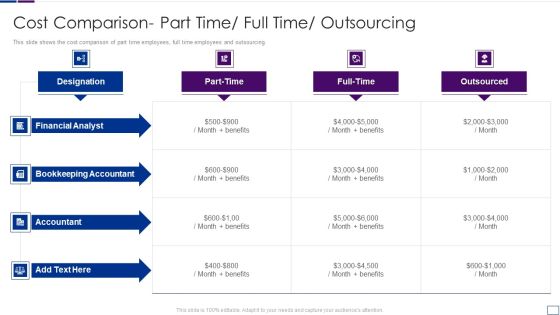
Outsourcing Financial Accounting Solutions For Company Cost Comparisonpart Structure PDF
This slide shows the cost comparison of part time employees, full time employees and outsourcing.Deliver an awe inspiring pitch with this creative outsourcing financial accounting solutions for company cost comparisonpart structure pdf bundle. Topics like bookkeeping accountant, financial analyst, senior accountant can be discussed with this completely editable template. It is available for immediate download depending on the needs and requirements of the user.

Comparative Analysis Of Companys Financial Structure Approach Inspiration PDF
This slide covers the comparison of two companies dealing in same products or services of their loan and bond amount they took for their work management. Pitch your topic with ease and precision using this Comparative Analysis Of Companys Financial Structure Approach Inspiration PDF. This layout presents information on Comparative Analysis, Companys Financial Structure Approach. It is also available for immediate download and adjustment. So, changes can be made in the color, design, graphics or any other component to create a unique layout.
Financial Benchmark Evaluation Of Retail Companies Professional PDF
This slide shows comparison analysis of different retail companies based on various benchmarks . it include benchmarks like revenue, net profit, gross profit etc. Showcasing this set of slides titled Financial Benchmark Evaluation Of Retail Companies Professional PDF. The topics addressed in these templates are Revenue, Net Profit, Gross Profit. All the content presented in this PPT design is completely editable. Download it and make adjustments in color, background, font etc. as per your unique business setting.
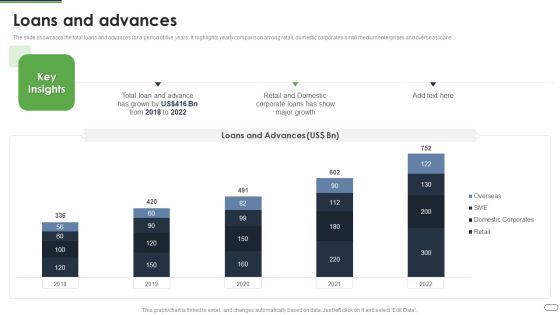
Financial Solutions Company Profile Loans And Advances Guidelines PDF
The slide showcases the total loans and advances for a period of five years. It highlights yearly comparison among retail, domestic corporates small medium enterprises and overseas loans Deliver an awe inspiring pitch with this creative Financial Solutions Company Profile Loans And Advances Guidelines PDF bundle. Topics like Loan Advance, Retail Domestic, Corporate Loans can be discussed with this completely editable template. It is available for immediate download depending on the needs and requirements of the user.

Projected Financial Results In FY 2020 One Pager Documents
This slide shows the key projected financial returns earned from business projects and services. It also represents the comparison of revenues from the previous year. Presenting you a fantastic Projected Financial Results In FY 2020 One Pager Documents. This piece is crafted on hours of research and professional design efforts to ensure you have the best resource. It is completely editable and its design allow you to rehash its elements to suit your needs. Get this Projected Financial Results In FY 2020 One Pager Documents A4 One-pager now.
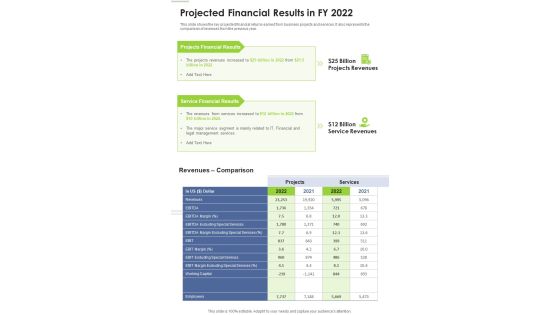
Projected Financial Results In FY 2022 One Pager Documents
This slide shows the key projected financial returns earned from business projects and services. It also represents the comparison of revenues from the previous year. Presenting you a fantastic Projected Financial Results In FY 2022 One Pager Documents. This piece is crafted on hours of research and professional design efforts to ensure you have the best resource. It is completely editable and its design allow you to rehash its elements to suit your needs. Get this Projected Financial Results In FY 2022 One Pager Documents A4 One-pager now.

Inventory Turnover Financial Ratios Chart Conversion Portrait PDF
This slide illustrates graph for inventory turnover ratio that can help company to analyze efficiency of inventory management. It showcases ratio graph comparison of 4 companies for a period of last 6 years Pitch your topic with ease and precision using this inventory turnover financial ratios chart conversion portrait pdf. This layout presents information on inventory turnover financial ratios chart conversion. It is also available for immediate download and adjustment. So, changes can be made in the color, design, graphics or any other component to create a unique layout.
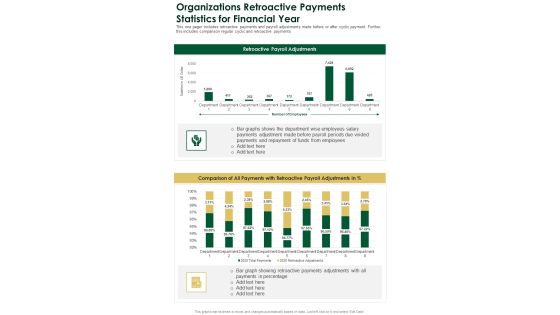
Organizations Retroactive Payments Statistics For Financial Year One Pager Documents
This one pager includes retroactive payments and payroll adjustments made before or after cyclic payment. Further, this includes comparison regular cyclic and retroactive payments. Presenting you an exemplary Organizations Retroactive Payments Statistics For Financial Year One Pager Documents. Our one-pager comprises all the must-have essentials of an inclusive document. You can edit it with ease, as its layout is completely editable. With such freedom, you can tweak its design and other elements to your requirements. Download this Organizations Retroactive Payments Statistics For Financial Year One Pager Documents brilliant piece now.
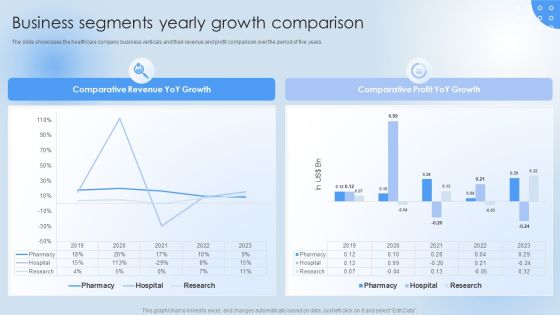
Pharmaceutical Company Financial Summary Business Segments Yearly Growth Guidelines PDF
The slide showcases the healthcare company business verticals and their revenue and profit comparison over the period of five years. The best PPT templates are a great way to save time, energy, and resources. Slidegeeks have 100 percent editable powerpoint slides making them incredibly versatile. With these quality presentation templates, you can create a captivating and memorable presentation by combining visually appealing slides and effectively communicating your message. Download Pharmaceutical Company Financial Summary Business Segments Yearly Growth Guidelines PDF from Slidegeeks and deliver a wonderful presentation.

Pharmaceutical Company Financial Summary Hospital Business Annual Profit Template PDF
The slide highlights the comparison of annual revenue and profit growth of the hospital business. It compares yearly profit and revenue change in percentage over the period of five years. Do you know about Slidesgeeks Pharmaceutical Company Financial Summary Hospital Business Annual Profit Template PDF These are perfect for delivering any kind od presentation. Using it, create PowerPoint presentations that communicate your ideas and engage audiences. Save time and effort by using our pre-designed presentation templates that are perfect for a wide range of topic. Our vast selection of designs covers a range of styles, from creative to business, and are all highly customizable and easy to edit. Download as a PowerPoint template or use them as Google Slides themes.
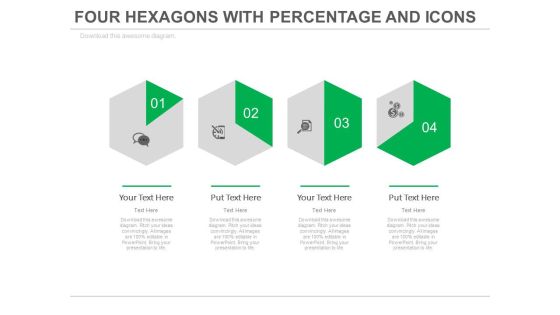
Four Steps Of Financial Growth Analysis Powerpoint Slides
This PowerPoint template with multiple Hexagons can be creatively used to present a timeline in a visual manner. This slide can also help the audience understand a 6 step process in an easier manner. The icons are totally customizable and can be edited to represent the particular process happening at that stage. It can also be used to represent different times or different activities to be carried out at different times in in a day in an office or an organization (e.g. - Medicine schedule) since the hexagon represents a clock and change of shade moves in a clockwise manner. The diagram can be used to represent a comparison or a report or an analysis of the data.

Annual Financial Data With KPI Insights Dashboard Structure PDF
The following slides highlights the financial kpas in summarized form to evaluate companys annual operating performance. It includes metrics such as gross, operating and net profit margin, income statement, target versus actual EBIT etc. Pitch your topic with ease and precision using this Annual Financial Data With KPI Insights Dashboard Structure PDF. This layout presents information on Gross Profit Margin, Operating Profit Margin, Net Profit Margin. It is also available for immediate download and adjustment. So, changes can be made in the color, design, graphics or any other component to create a unique layout.

6 Key Features For Financial Management Ppt PowerPoint Presentation Guidelines
This is a 6 key features for financial management ppt powerpoint presentation guidelines. This is a six stage process. The stages in this process are financial management, management, management features.
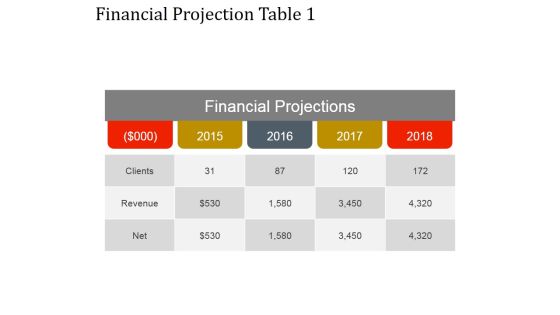
Financial Projection Table 1 Ppt PowerPoint Presentation Inspiration
This is a financial projection table 1 ppt powerpoint presentation inspiration. This is a five stage process. The stages in this process are clients, revenue, net.
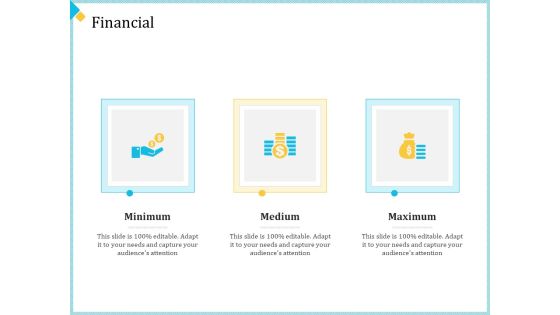
Establish Management Team Financial Ppt Pictures Graphics Download PDF
This is a establish management team financial ppt pictures graphics download pdf. template with various stages. Focus and dispense information on three stages using this creative set, that comes with editable features. It contains large content boxes to add your information on topics like minimum, medium, maximum. You can also showcase facts, figures, and other relevant content using this PPT layout. Grab it now.
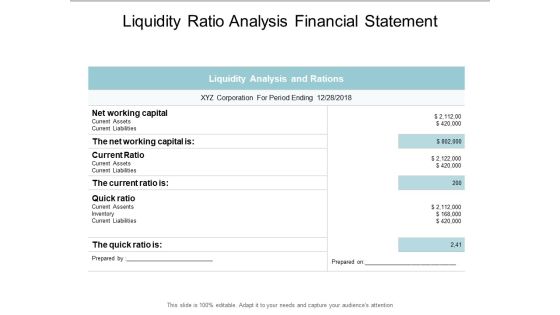
Liquidity Ratio Analysis Financial Statement Ppt PowerPoint Presentation Ideas Layouts
This is a liquidity ratio analysis financial statement ppt powerpoint presentation ideas layouts. This is a four stage process. The stages in this process are liquidity, cash assets, solvency.

Financial Estimates And Projections Ppt PowerPoint Presentation Layouts Graphics Pictures
This is a financial estimates and projections ppt powerpoint presentation layouts graphics pictures. This is a ten stage process. The stages in this process are investment, funding, private equity, venture capital.

Financial Projections Income Statement Ppt PowerPoint Presentation Portfolio Layouts
This is a financial projections income statement ppt powerpoint presentation portfolio layouts. This is a one stage process. The stages in this process are business, strategy, analysis, pretention, finance, table.
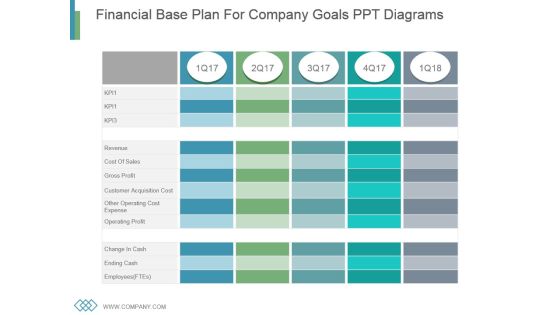
Financial Base Plan For Company Goals Ppt Diagrams
This is a financial base plan for company goals ppt diagrams. This is a five stage process. The stages in this process are revenue, cost of sales, gross profit, customer acquisition cost, other operating cost expense, operating profit, change in cash, ending cash, employees.

Financial Management Marketing Ppt PowerPoint Presentation Outline Templates
This is a financial management marketing ppt powerpoint presentation outline templates. This is a four stage process. The stages in this process are comparison, planning, marketing, finance, strategy.

Taxi Aggregator Venture Capitalist Fundraising Financial Highlights Diagrams PDF
This slide provides the glimpse about the financial highlights which focuses on sales, gross margin, net profit, etc. This is a taxi aggregator venture capitalist fundraising financial highlights diagrams pdf template with various stages. Focus and dispense information on one stages using this creative set, that comes with editable features. It contains large content boxes to add your information on topics like financial highlights. You can also showcase facts, figures, and other relevant content using this PPT layout. Grab it now.

Cab Aggregator Services Investor Capital Funding Financial Topics PDF
This is a cab aggregator services investor capital funding financial topics pdf template with various stages. Focus and dispense information on three stages using this creative set, that comes with editable features. It contains large content boxes to add your information on topics like financial. You can also showcase facts, figures, and other relevant content using this PPT layout. Grab it now.
Latest Facts About Data In Financial Services Icon Professional PDF
Pitch your topic with ease and precision using this Latest Facts About Data In Financial Services Icon Professional PDF. This layout presents information on Latest Facts About Data, Financial Services. It is also available for immediate download and adjustment. So, changes can be made in the color, design, graphics or any other component to create a unique layout.
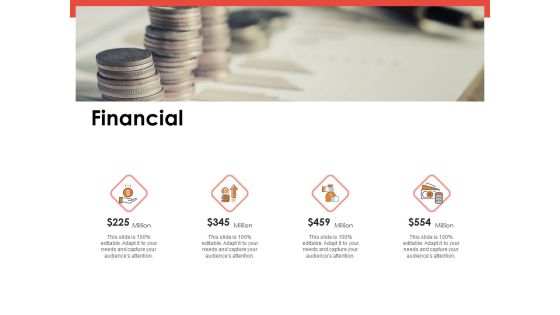
Label Identity Design Financial Ppt PowerPoint Presentation Professional Templates PDF
This is a label identity design financial ppt powerpoint presentation professional templates pdf template with various stages. Focus and dispense information on four stages using this creative set, that comes with editable features. It contains large content boxes to add your information on topics like financial. You can also showcase facts, figures, and other relevant content using this PPT layout. Grab it now.

Effectivity Associated To Target Market Financial Formats PDF
This is a effectivity associated to target market financial formats pdf template with various stages. Focus and dispense information on one stages using this creative set, that comes with editable features. It contains large content boxes to add your information on topics like financial, minimum, maximum. You can also showcase facts, figures, and other relevant content using this PPT layout. Grab it now.

Advertisement Administration Financial Ppt Infographics Graphics Pictures PDF
This is a advertisement administration financial ppt infographics graphics pictures pdf template with various stages. Focus and dispense information on two stages using this creative set, that comes with editable features. It contains large content boxes to add your information on topics like financial, maximum, minimum. You can also showcase facts, figures, and other relevant content using this PPT layout. Grab it now.
Strategic Marketing Plan Financial Ppt Icon Clipart PDF
This is a strategic marketing plan financial ppt icon clipart pdf template with various stages. Focus and dispense information on three stages using this creative set, that comes with editable features. It contains large content boxes to add your information on topics like financial, maximum, minimum, medium. You can also showcase facts, figures, and other relevant content using this PPT layout. Grab it now.
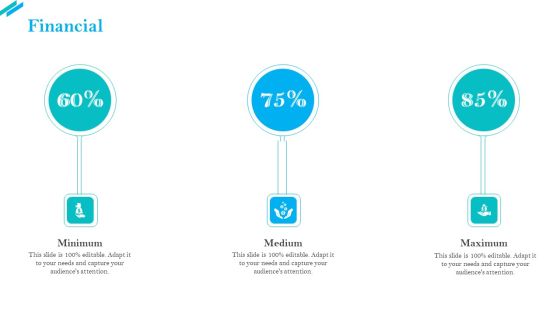
SCR For Market Financial Ppt Inspiration Ideas PDF
This is a SCR for market financial ppt inspiration ideas pdf template with various stages. Focus and dispense information on three stages using this creative set, that comes with editable features. It contains large content boxes to add your information on topics like financial, minimum, medium, maximum. You can also showcase facts, figures, and other relevant content using this PPT layout. Grab it now.

Inorganic Growth Business Financial Ppt Slides Information PDF
This is a inorganic growth business financial ppt slides information pdf template with various stages. Focus and dispense information on one stages using this creative set, that comes with editable features. It contains large content boxes to add your information on topics like financial. You can also showcase facts, figures, and other relevant content using this PPT layout. Grab it now.

 Home
Home